. 2019 Oct;21(10):963-973.
doi: 10.1016/j.neo.2019.07.001. Epub 2019 Aug 19.

Depletion of the Transcriptional Coactivator Amplified in Breast Cancer 1 (AIB1) Uncovers Functionally Distinct Subpopulations in Triple-Negative Breast Cancer

Affiliations

Depletion of the Transcriptional Coactivator Amplified in Breast Cancer 1 (AIB1) Uncovers Functionally Distinct Subpopulations in Triple-Negative Breast Cancer

F R Saenz et al. Neoplasia. 2019 Oct.

Abstract

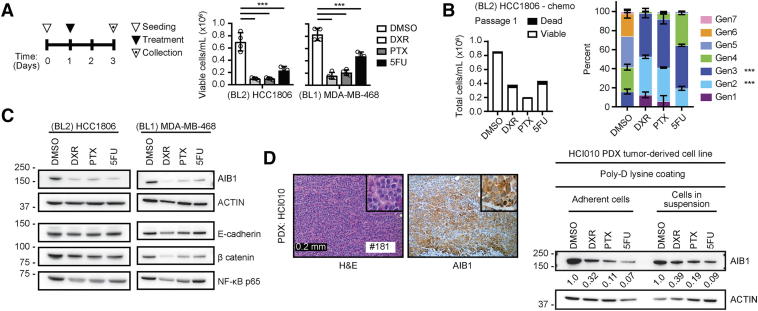
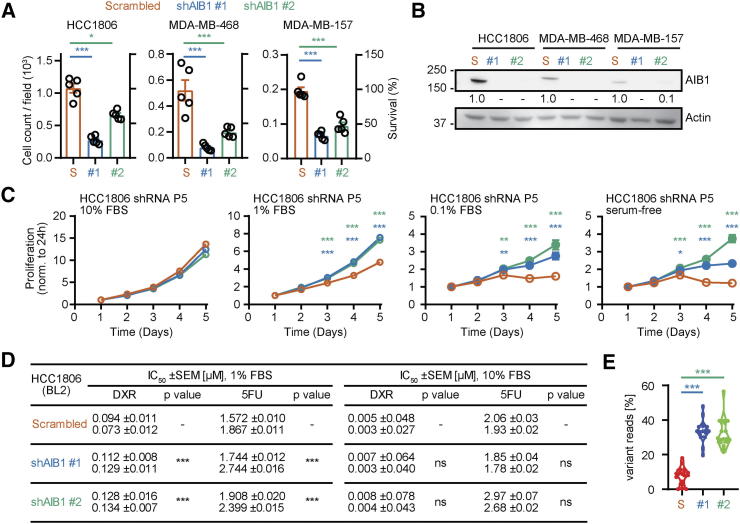
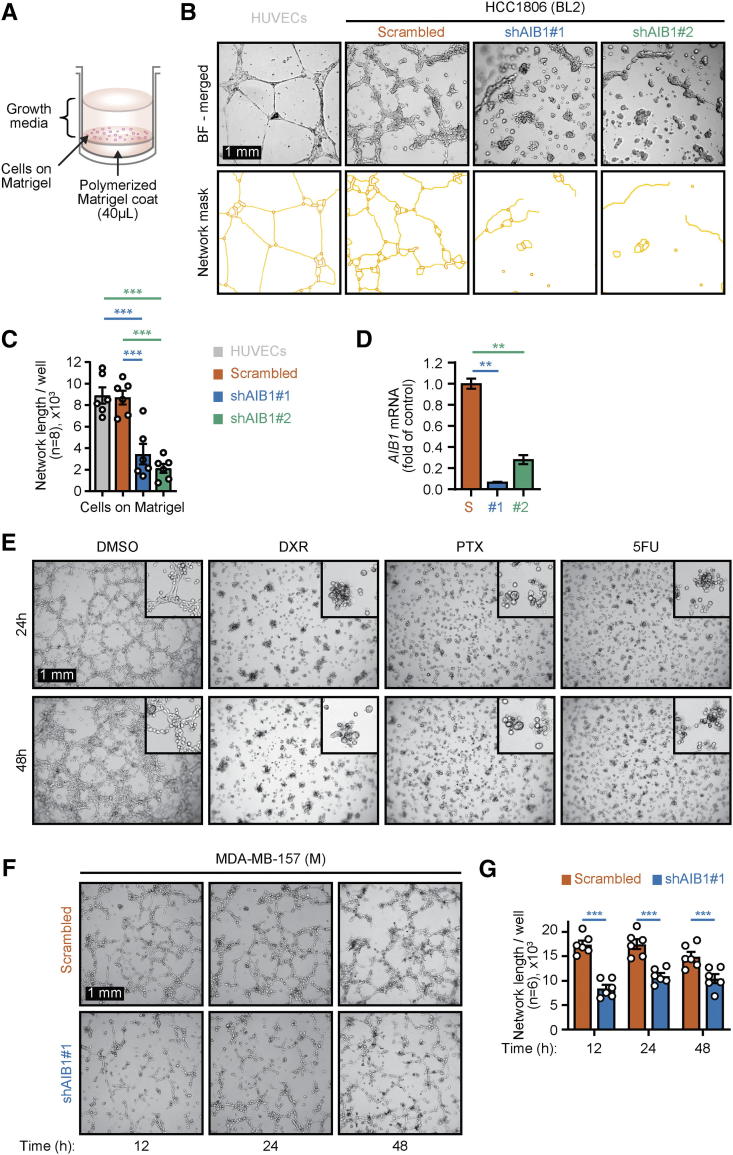
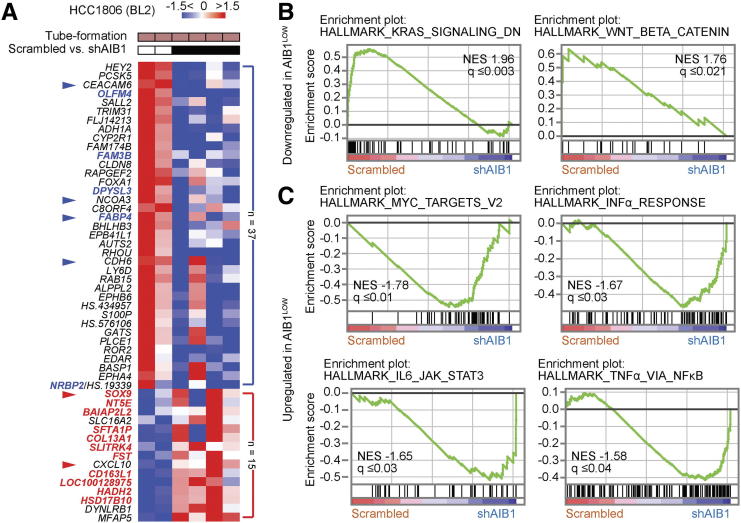
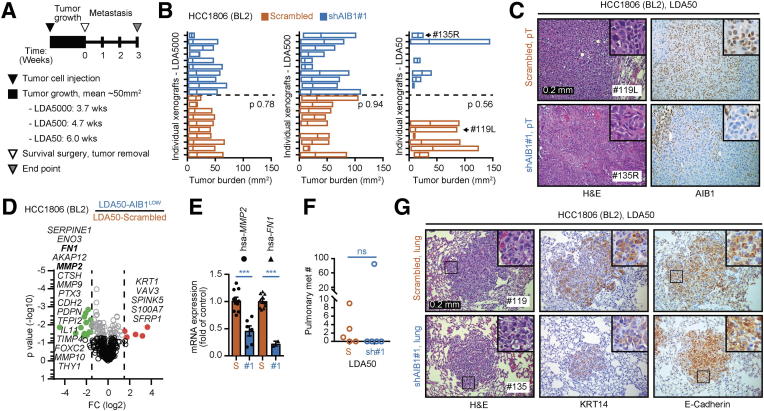
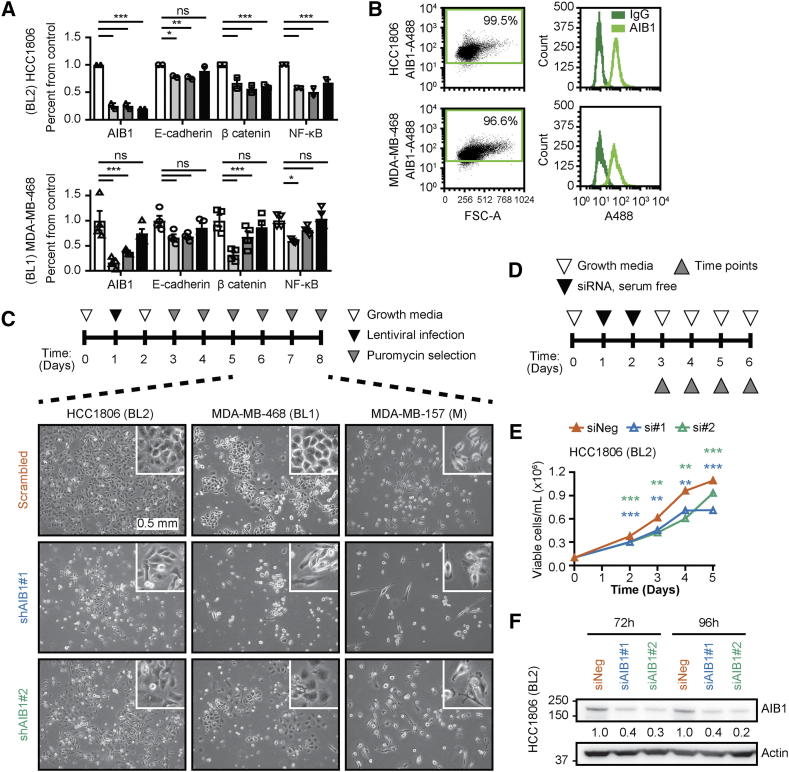
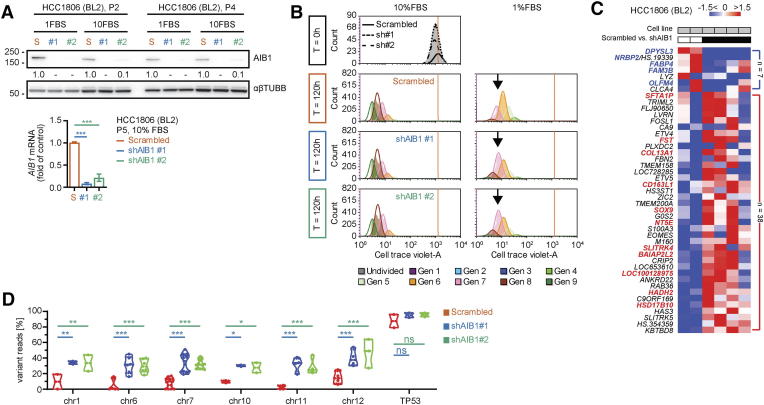
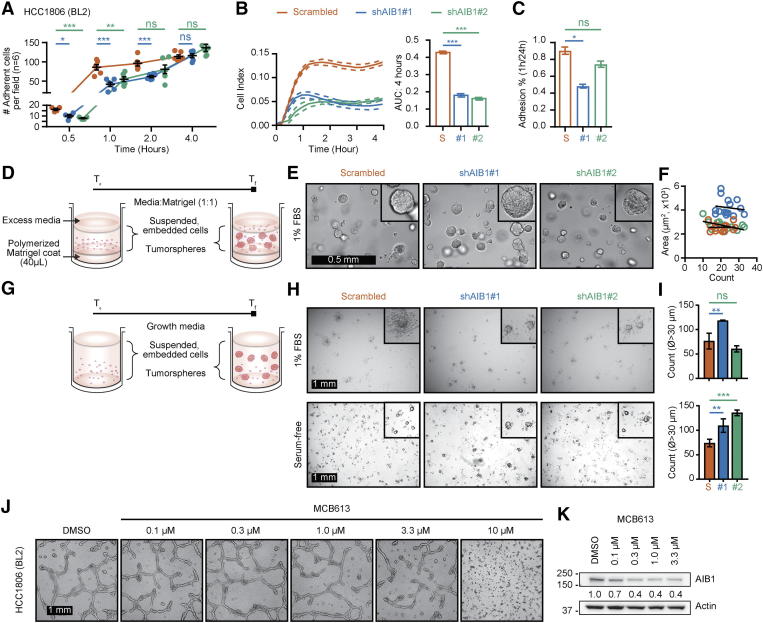
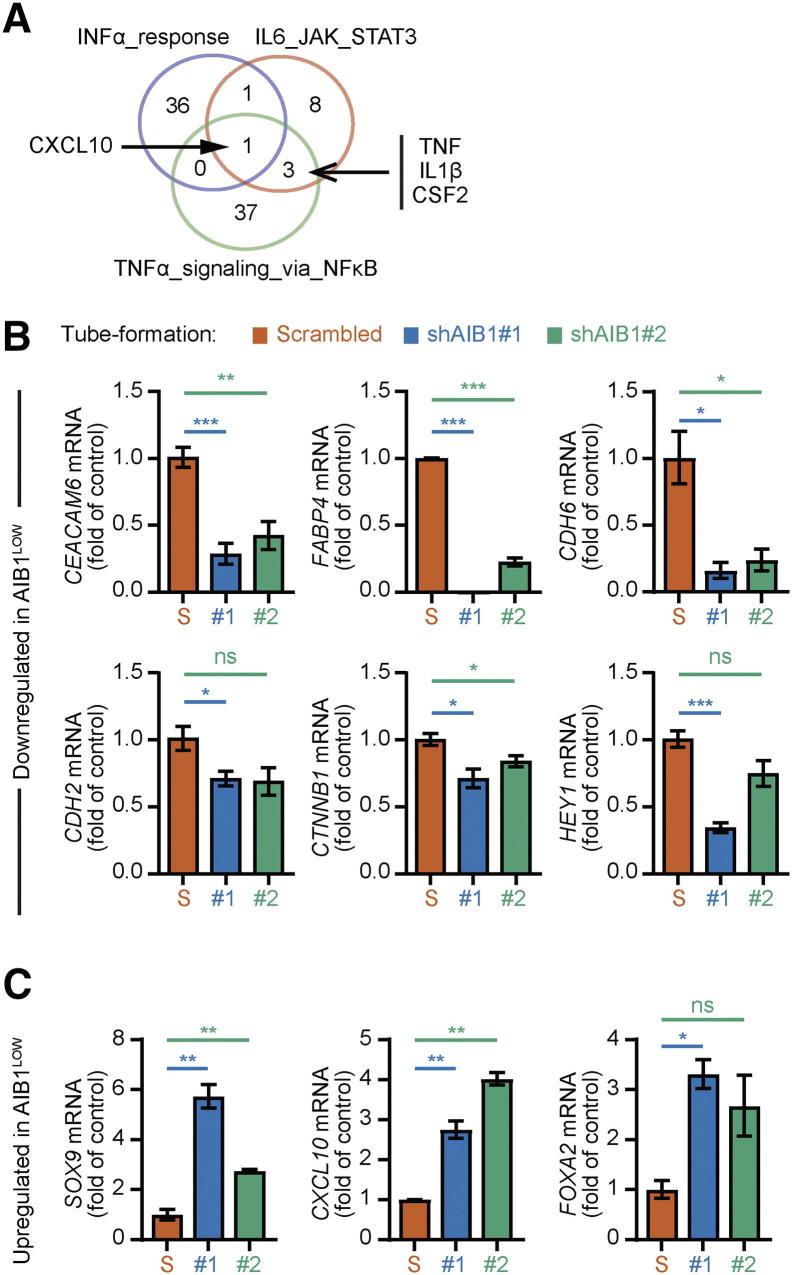
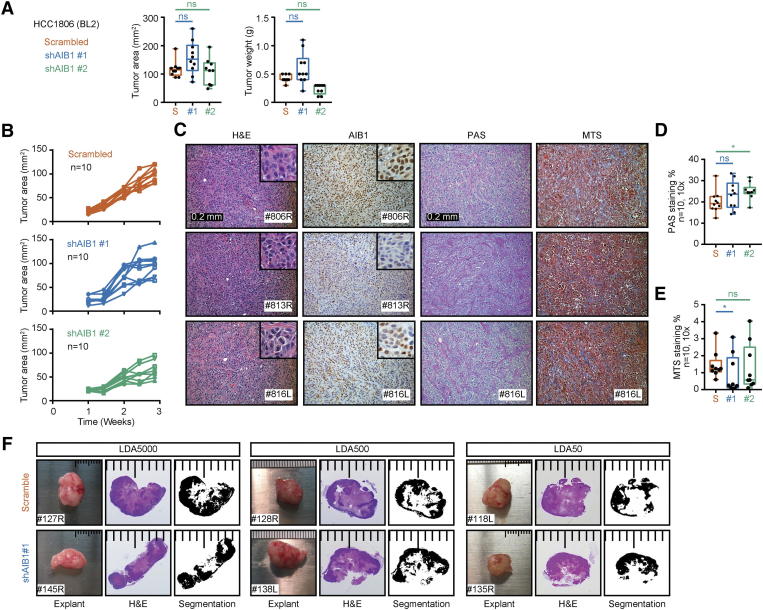
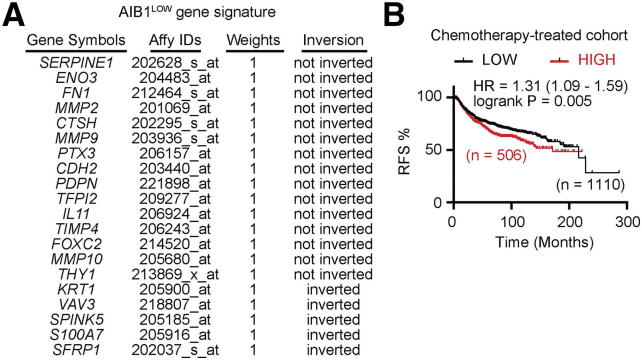
The transcriptional coactivator Amplified in Breast Cancer 1 (AIB1) plays a major role in the progression of hormone and HER2-dependent breast cancers but its role in triple negative breast cancer (TNBC) is undefined. Here, we report that established TNBC cell lines, as well as cells from a TNBC patient-derived xenograft (PDX) that survive chemotherapy treatment in vitro express lower levels of AIB1 protein. The surviving cell population has an impaired tube-formation phenotype when cultured onto basement membrane, a property shared with TNBC cells that survive shRNA-mediated depletion of AIB1 (AIB1LOW cells). DNA analysis by exome sequencing revealed that AIB1LOW cells represent a distinct subpopulation. Consistent with their in vitro phenotype AIB1LOW cells implanted orthotopically generated slower growing tumors with less capacity for pulmonary metastases. Gene expression analysis of cultured cells and tumors revealed that AIB1LOW cells display a distinct expression signature of genes in pro-inflammatory pathways, cell adhesion, proteolysis and tissue remodeling. Interestingly, the presence of this AIB1LOW expression signature in breast cancer specimens is associated with shorter disease free survival of chemotherapy treated patients. We concluded that TNBC cell lines contain heterogeneous populations with differential dependence on AIB1 and that the gene expression pattern of AIB1LOW cells may represent a signature indicative of poor response to chemotherapy in TNBC patients.


Figures

Figure 1
Figure 1
Chemotherapy downregulates AIB1 expression in TNBC cell lines. (A) HCC1806 and MDA-MB-468 cells were treated as shown (left panel) with DXR, PTX and 5FU. Viable cells were determined by Trypan blue exclusion (n = 4) (right panel) (B) Total count of HCC1806 cells labeled with Cell Trace Violet dye (left) following chemotherapy treatment (n = 2) and percent distribution of dividing cells by doubling generations (right). (C) Representative Western blot images for AIB1, E-cadherin, β catenin, and NF-kB from chemotherapy-treated surviving HCC1806 and MDA-MB-468 cells (n = 2) (D) H&E and AIB1 IHC staining of HCI010 PDX tumor grafts (left) and Western blot images (right) of HCI010 PDX-derived cell lines treated as in A. Graphs are representative of three independent experiments. Technical repeats shown. Mean ± SEM. Scale bar: 200 μm. One-way ANOVA followed by Sidak's (A and C) or Dunnett's (B) multiple comparisons test. *P ≤ .05, **P ≤ .01, ***P ≤ .001.
Figure 2
Figure 2
Phenotype of AIB1 shRNA on BL2-HCC1806 cells in vitro. (A) Cell count per field (n = 5) (left axis) and percent survival (right axis) of TNBC cell lines following AIB1 shRNA infection and selection relative to their respective control shRNA. (B) Representative Western images for AIB1 in cells from A. (C) Proliferation of serial passaged HCC1806 AIB1LOW relative to control shRNA in 10%, 1%, 0.1% serum-supplemented RPMI 1640 growth media or serum-free basal media. (D) IC50 from dose response curves of 72-hours chemotherapy treated HCC1806 AIB1LOW cells and control shRNA in 1% or 10% serum-supplemented culture conditions. Graphs are representative of three independent experiments. Mean ± SEM. Linear regression (slope coefficient) and Non-linear regression (least-squares) for each cell type. (E) Genomic variant analysis of HCC1806 AIB1LOW relative to control shRNA (passage 5). Quantification of variant reads (16 variants on 6 chromosomes, n = 2) is shown as a percentage of total reads. One-way ANOVA followed by Dunnett's multiple comparisons test. *P ≤ .05, **P ≤ .01, ***P ≤ .001.
Figure 3
Figure 3
AIB1LOWTNBC cells have reduced tube formation phenotype. (A) Schematic of tube formation assay on Matrigel™. (B) Representative images of 48-hour tube-formation assays showing HCC1806 AIB1LOW compared to control shRNA cells and (top) and network mask (bottom) (C) Bar graphs showing average of tube network length per well (n = 6). (D) AIB1 mRNA expression of cells from B. (E) Representative micrographs of 48-hours tube-formation assay of HCC1806 cells that survived chemotherapy vs DMSO control (F) Representative micrographs of tube-formation assays showing AIB1LOW compared to control shRNA MDA-MB-157 cells at indicated time points. (G) Average tube network length measured per image (n = 6) of tube-formation from F. Graphs are representative of three independent experiments. Mean ± SEM. Scale bar = 1 mm. Two-tailed t-test. *P ≤ .05, **P ≤ .01, ***P ≤ .001.
Figure 4
Figure 4
Gene expression patterns of HCC1806 AIB1LOWcells with reduced tube-formation phenotype. (A) Heatmap showing differentially expressed genes in HCC1806 AIB1LOW cells relative to control shRNA from tube formation assays. Bold, overlapping genes with 2D cultures. Arrowheads, RT-qPCR validation performed. Gene enrichment plots showing (B) down-regulated and (C) up-regulated pathways in HCC1806 AIB1LOW cells relative to control shRNA (n = 2). Gene expression fold change and NES FDR as indicated.
Figure 5
Figure 5
Limiting dilution HCC1806 AIB1LOWcells have reduced growth and metastatic capacity in vivo. (A) Schematic timeline for in vivo limiting dilution analysis. (B) Individual tumor size of HCC1806 AIB1LOW and control shRNA per LDA group (n = 10). (C) Representative images of H&E and IHC staining of primary tumor grafts for HCC1806 AIB1LOW and control shRNA. (D) Volcano plot showing differential gene expression of LDA50-AIB1LOW xenografts (n = 2) relative to control shRNA xenografts (n = 4). (E) PCR gene expression for MMP2 and FN1 in LDA50-AIB1LOW xenografts (n = 2) relative to control shRNA xenografts. (F) Number of mice with confirmed pulmonary metastasis by H&E in the LDA50 group. (G) Representative images of H&E, KRT14, and E-cadherin IHC staining in lung tissues for HCC1806 AIB1LOW and control shRNA. Mean ± SEM. Two-tailed t-test. *P ≤ .05, **P ≤ .01, ***P ≤ .001.
Supplementary Figure 1
Molecular characterization of AIB1 expressing TNBC cell lines following chemotherapy and RNAi treatment. (A) Quantitation of band intensity normalized to Actin for listed proteins from Western blots in chemotherapy-treated surviving basal like subtypes of TNBC cell lines. (B) Intracellular AIB1 protein expression of parental HCC1806 and MDA-MB-468 cells analyzed by flow cytometry. (C) Schematic timeline for shRNA lentiviral infection and puromycin selection. Representative images of shRNA-treated TNBC cell lines after puromycin selection. (D) Schematic timeline for siRNA treatment of HCC1806 cell lines. (E) Proliferation of siRNA treated HCC1806 cells. (E) Representative Western blot image for AIB1 protein in siRNA-treated HCC1806 cells at 72 and 96 hours. Two-way ANOVA followed by Dunnett's multiple comparisons test in A. Linear regression (slope coefficient) in D. *P ≤ 0.05, **P ≤ .01, ***P ≤ .001.
Supplementary Figure 2
Molecular characterization of serial passaged HCC1806 AIB1LOWcells in vitro. (A) Representative Western blot images for AIB1 protein and PCR gene expression of AIB1 in serial passaged HCC1806 AIB1LOW relative to control shRNA. (B) Proliferation analysis by CellTrace Violet of serial passaged HCC1806 AIB1LOW relative to control shRNA in 10% or 1% serum-supplemented growth media after 72 hours. (C) Heatmap showing differentially expressed genes in HCC1806 AIB1LOW cells relative to control shRNA from cell lines (2D culture). (D) Quantification of genomic variant reads as percentage of total reads for each genomic locus in HCC1806 AIB1LOW cells relative to control shRNA. TP53 intron 6 is shown as a control (n = 2). One-way and two-way ANOVA followed by Dunnett's multiple comparisons test in A (lower panel) and D, respectively. *P ≤ .05, **P ≤ .01, ***P ≤ .001.
Supplementary Figure 3
Characterization of HCC1806 AIB1LOW cells. (A) Quantification of adherent HCC1806 AIB1LOW on plastic compared to control shRNA cells seeded at similar densities and measured over time. Adherent cells were counted per well (n = 6) following decanting of the supernatant after seeding and stained with Crystal Violet. (B) Adhesion properties of HCC1806 AIB1LOW compared to control shRNA cells represented as cell index (left) measured by an electrical-cell impedance substrate array and the area under the curve (right). (C) Percentage of adhered HCC1806 AIB1LOW compared to control shRNA cells 1-hour post seeding and normalized to percentage of adhered cells 24-hours post seeding. (D) Schematic describing tumorsphere culture embedded in Matrigel TM. (E) Representative images of HCC1806 AIB1LOW compared to control shRNA cells forming tumorspheres. (F) Correlation analysis for tumorsphere size and count from HCC1806 AIB1LOW compared to control shRNA cells. (G) Schematic describing tumorsphere culture in suspension using ultra-low attachment plates. (H) Representative micrographs of serial passaged HCC1806 AIB1LOW compared to control shRNA cells cultured in 1% serum-supplemented (top) and serum-free conditions (bottom). (I) Tumorsphere count using diameter (ᴓ) of the longest axis. (J) Tube-formation assay of parental HCC1806 treated with increasing concentrations of MCB613 and DMSO for 12-hours, trypsinized, then seeded onto Matrigel for 72-hours. (K) Western blot analysis of AIB1 protein after MCB613 treatment of HCC1806 cells cultured onto Matrigel after 72h. Graphs are representative of at least two independent experiments. Mean ±SEM. Scale bar = 1 mm (J). Two-tailed t-test. *P ≤ .05, **P ≤ .01, ***P ≤ .001.
Supplementary Figure 4
Gene expression analysis of HCC1806 AIB1LOW cell lines on Matrigel. 4. (A) Venn Diagram showing overlap of leading-edge lists from inflammatory pathways in 4C. (B) Independent gene expression validation of down-regulated genes during tube-formation in HCC1806 control shRNA cells (Figure 4). Data analysis and normalization as described in Figure (C) Independent gene expression validation of upregulated genes during tube-formation in HCC1806-BL2 AIB1LOW cells. Two biological samples from each condition were submitted for microarray analysis and each sample was validated. Graphs are representative of at least two independent experiments. Mean ±SEM. Two-tailed t-test. *P ≤ .05, **P ≤ .01, ***P ≤ .001.
Supplementary Figure 5
Analysis of HCC1806AIB1LOW orthotopic xenografts. (A) Average end-point tumor size and weight of 1×10⁶ HCC1806AIB1LOW compared to control shRNA cells injected into the cleared mammary fat pad of 4-week old nude mice; n = 10. (B) Line graphs of HCC1806AIB1LOW cells compared to control shRNA cells showing tumor development over time. (C) Representative images of H&E and IHC staining from primary tumor graft sections of the 1×10⁶ HCC1806 AIB1LOW compared to control shRNA xenografts. (D)Quantification of stromal glycoprotein stained with periodic-acid shift (PAS) stromal collagen or (E) stained with Masson’s trichome staining (MTS). (F) Representative H&E stains from LDA50-HCC1806AIB1LOW versus control shRNA showing levels of tissue necrosis.
Supplementary Figure 6
Recurrence free survival (RFS) of chemotherapy treated patients with breast cancer relative to the AIB1LOW 20 gene expression signature. (A) List of signature genes derived from a comparison of HCC1806 AIB1LOW relative to control shRNA xenograft tumors. (B) Kaplan-Meier curve showing significantly longer RFS of patients which tumors lacking the AIB1LOW 20 gene expression signature. Log-rank p values and hazard ratios (HRs; 95% CI) are shown. Note: For signature genes whose expression was downregulated in AIB1LOW tumors the respective expression levels in breast cancer specimens were inverted for the combined analysis to take the directionality of expression of the signature genes into account.

Similar articles

Cited by

References

    1. Hammond MEH, Hayes DF, Wolff AC, Mangu PB, Temin S. American Society of Clinical Oncology/College of American Pathologists guideline recommendations for immunohistochemical testing of estrogen and progesterone receptors in breast cancer. J Oncol Pract. 2010;6(4):195–197. - PMC - PubMed
    1. Wolff AC. American Society of Clinical Oncology/College of American Pathologists guideline recommendations for human epidermal growth factor receptor 2 testing in breast cancer. J Clin Oncol. 2006;25(1):118–145. - PubMed
    1. Perou CM. Molecular portraits of human breast tumours. Nature. 2000;406(6797):747–752. - PubMed
    1. Sørlie T. Gene expression patterns of breast carcinomas distinguish tumor subclasses with clinical implications. Proc Natl Acad Sci U S A. 2001;98(19):10869–10874. - PMC - PubMed
    1. Nielsen TO Immunohistochemical and clinical characterization of the basal-like subtype of invasive breast carcinoma. Clin Cancer Res. 2004;10(16):5367–5374. - PubMed

Publication types

MeSH terms

Substances