. 2019 Aug 21;20(17):4074.
doi: 10.3390/ijms20174074.

Radiocontrast Agent Diatrizoic Acid Induces Mitophagy and Oxidative Stress via Calcium Dysregulation

Affiliations

Radiocontrast Agent Diatrizoic Acid Induces Mitophagy and Oxidative Stress via Calcium Dysregulation

Dakota B Ward et al. Int J Mol Sci. .

Abstract

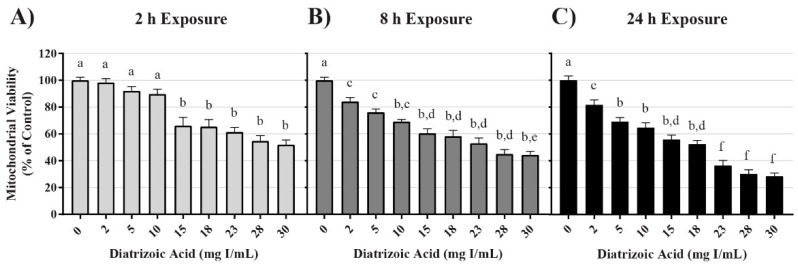
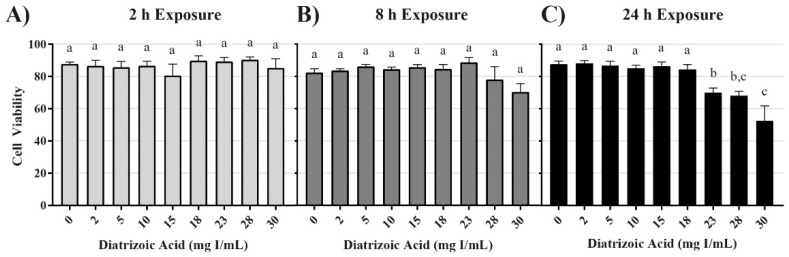
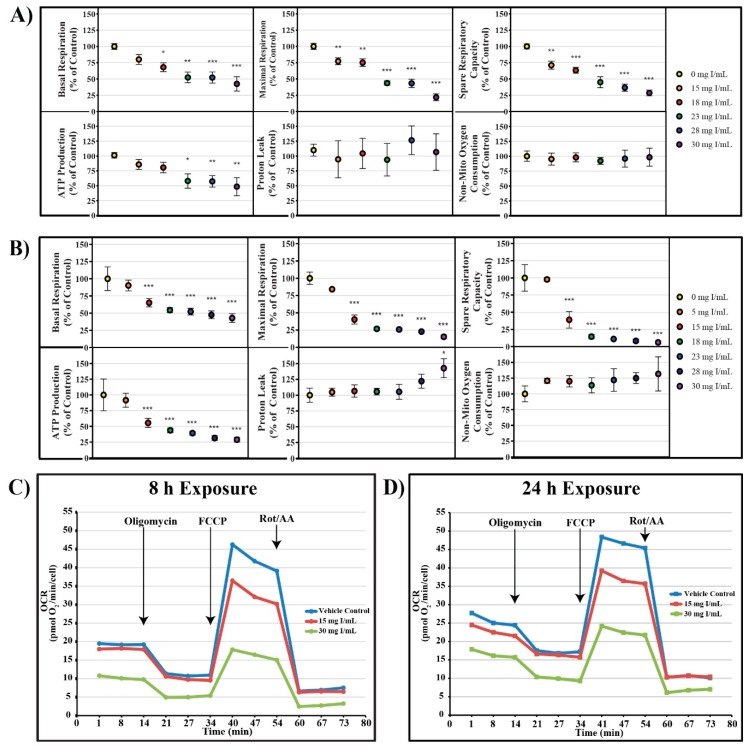
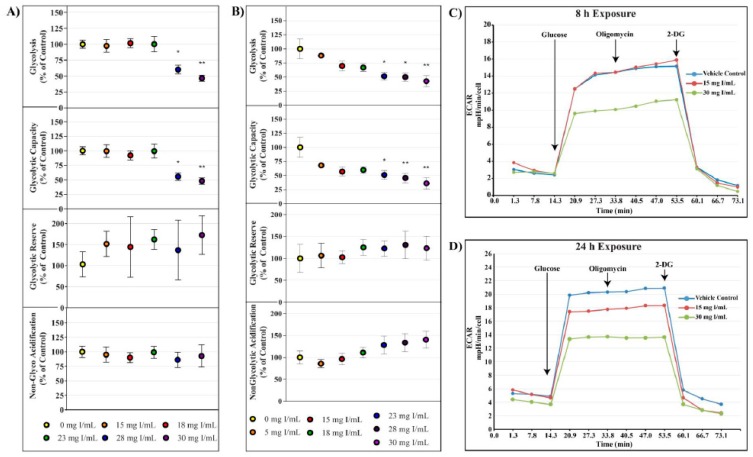
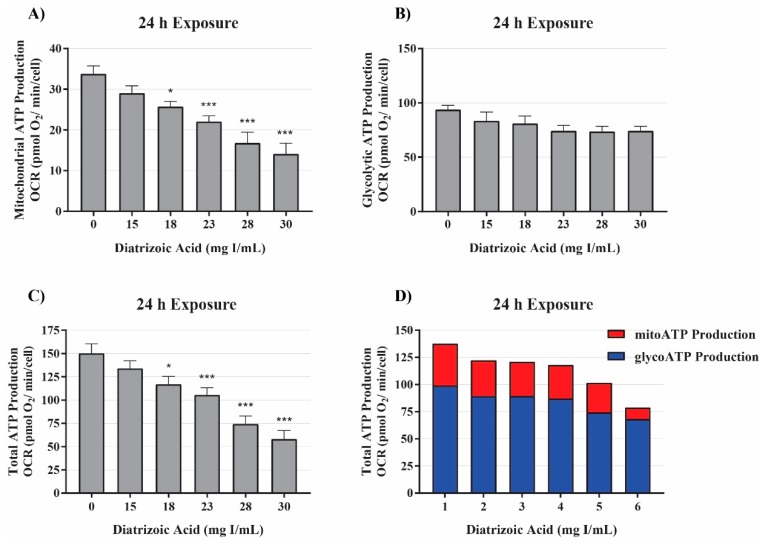
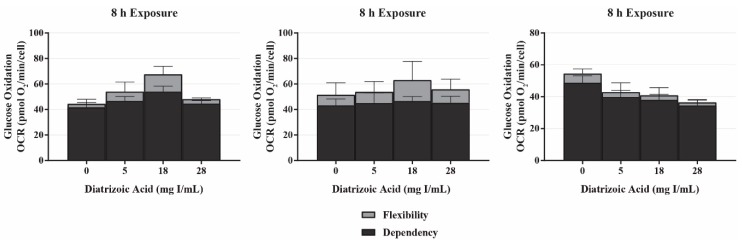
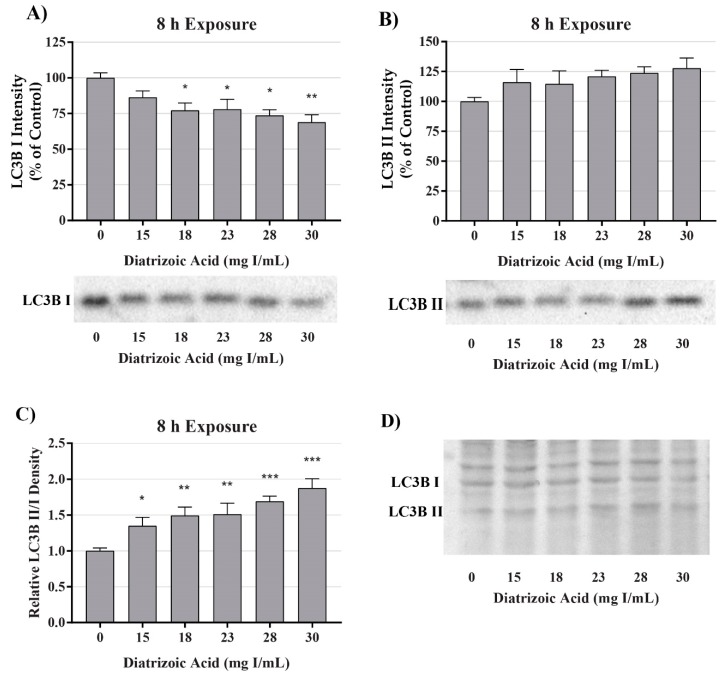
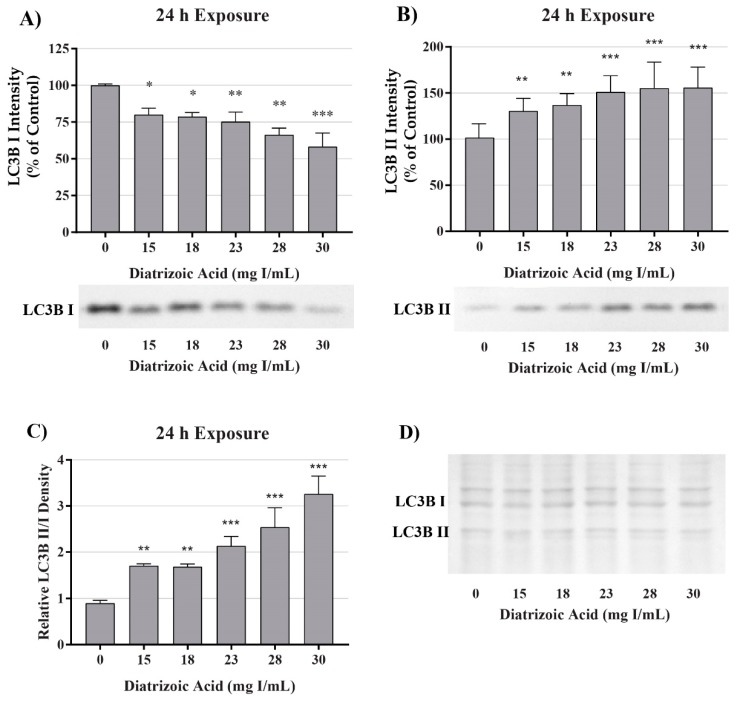
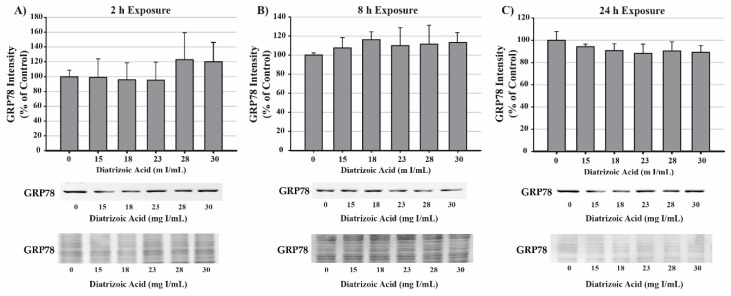
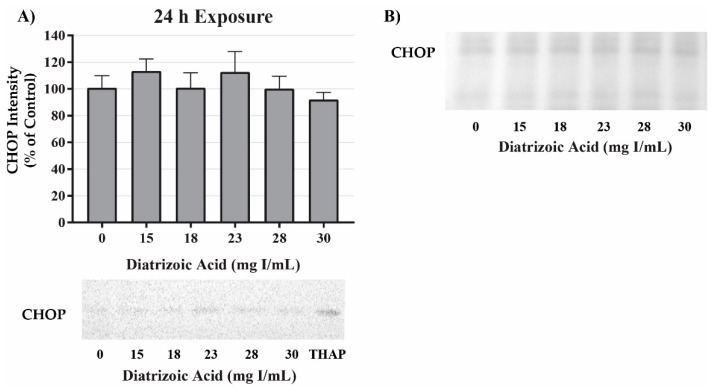
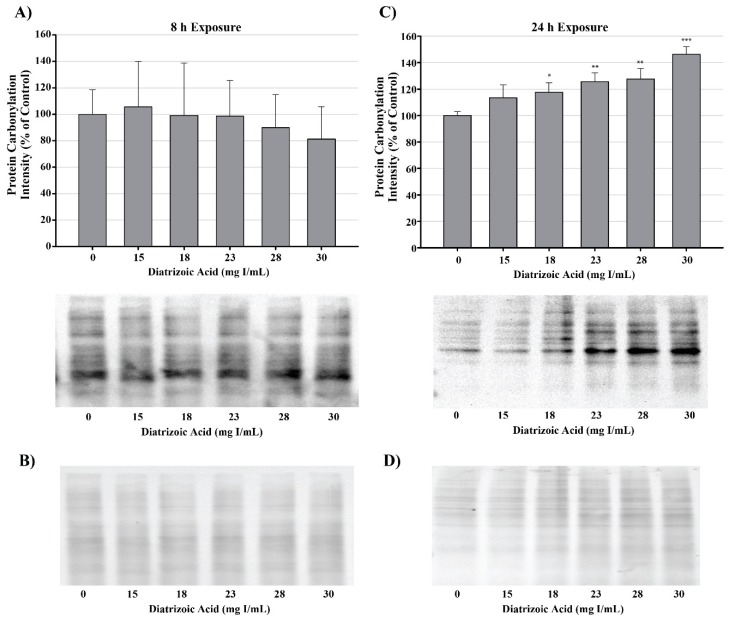
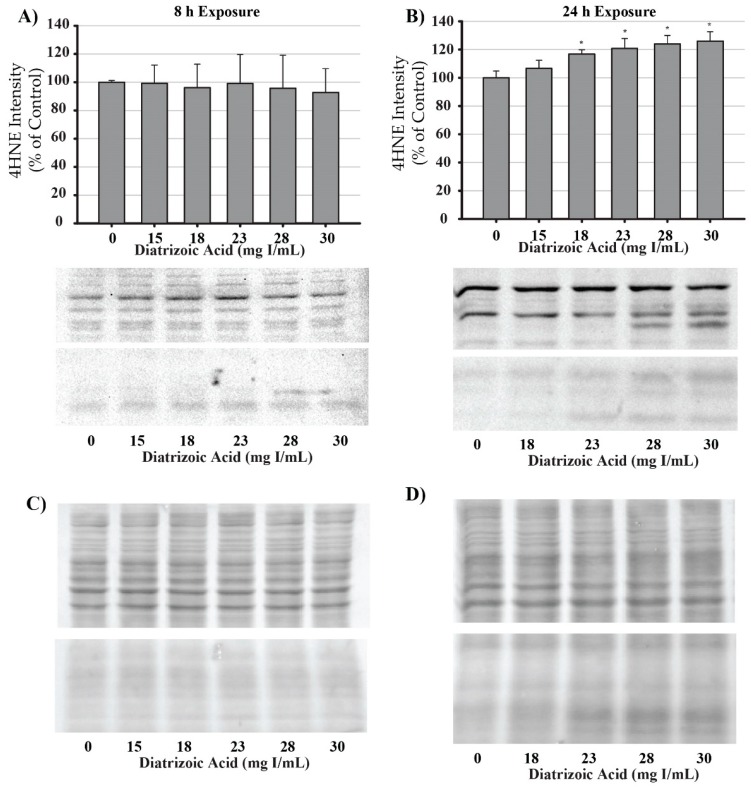
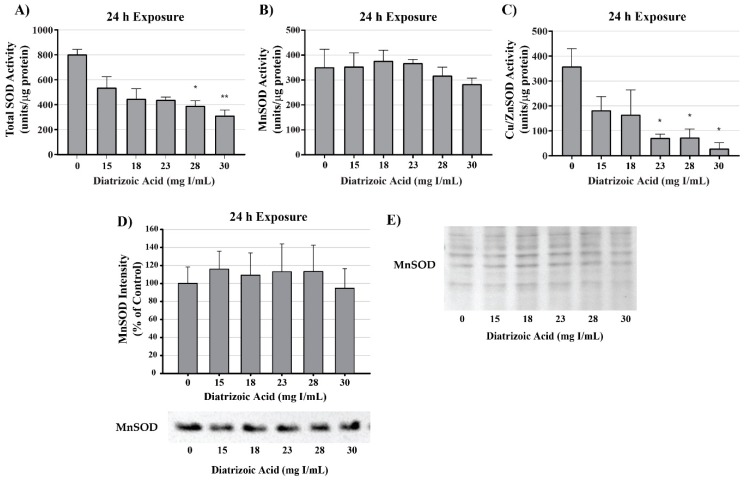
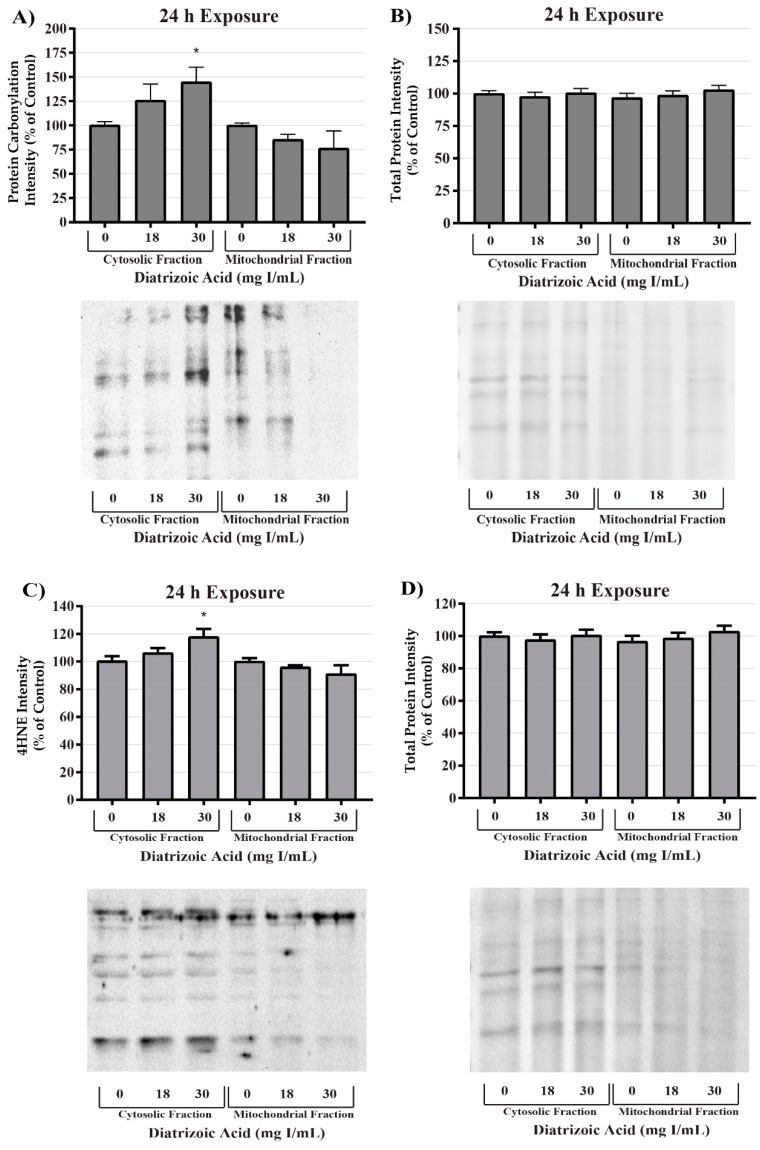
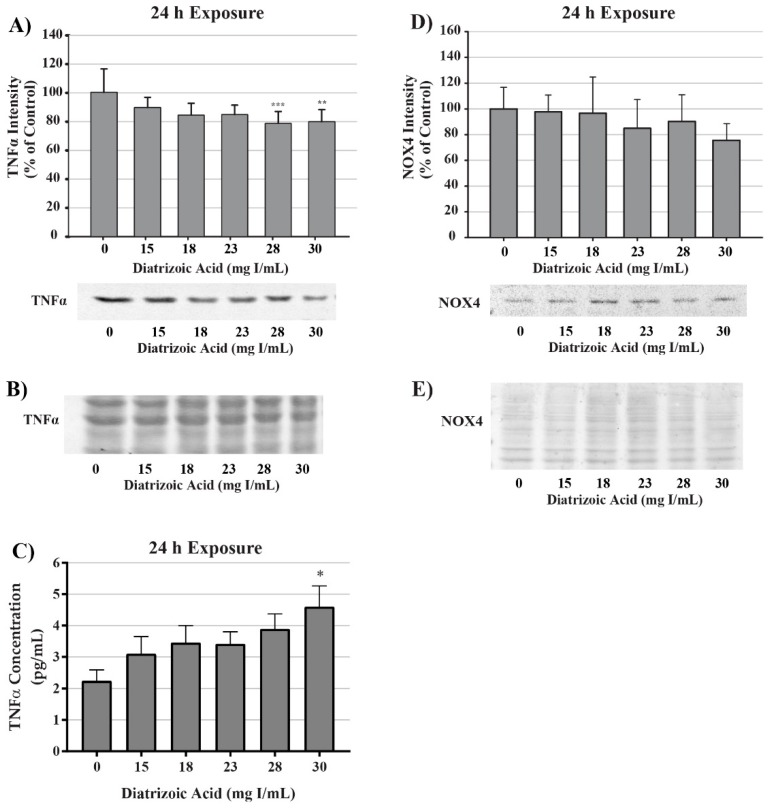
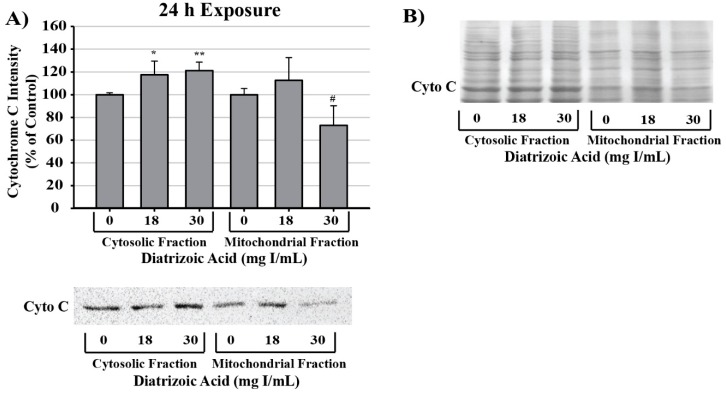
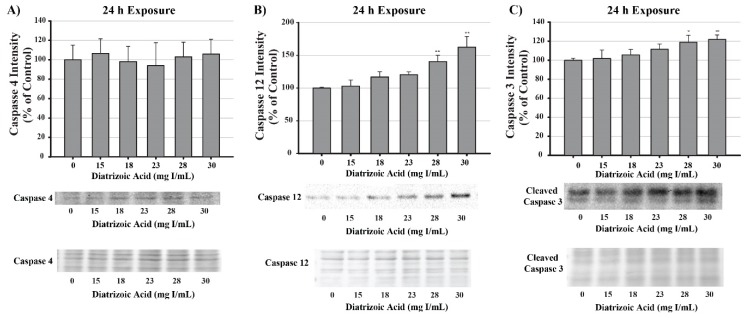
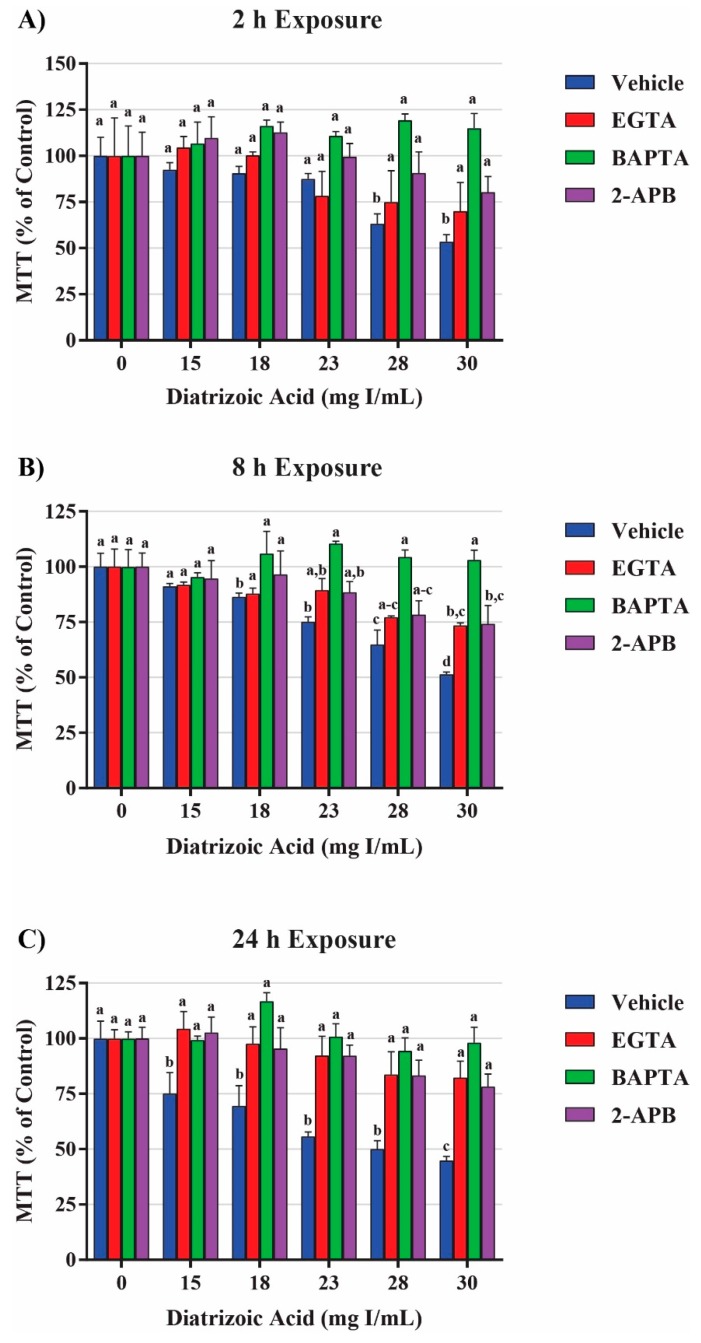
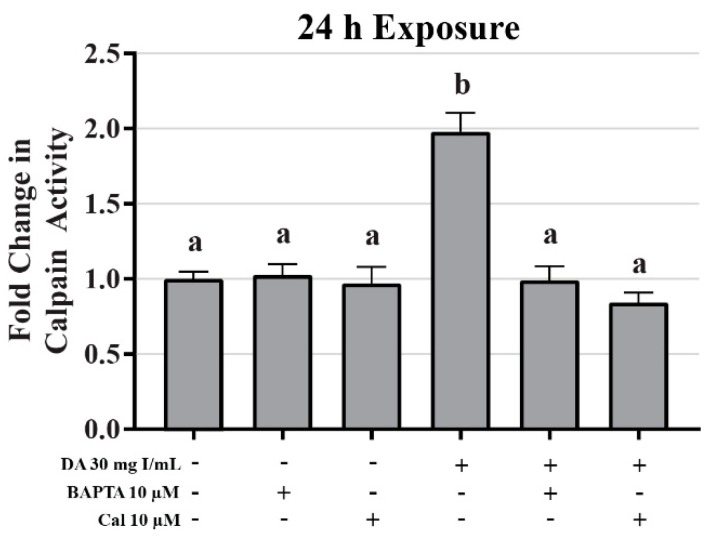
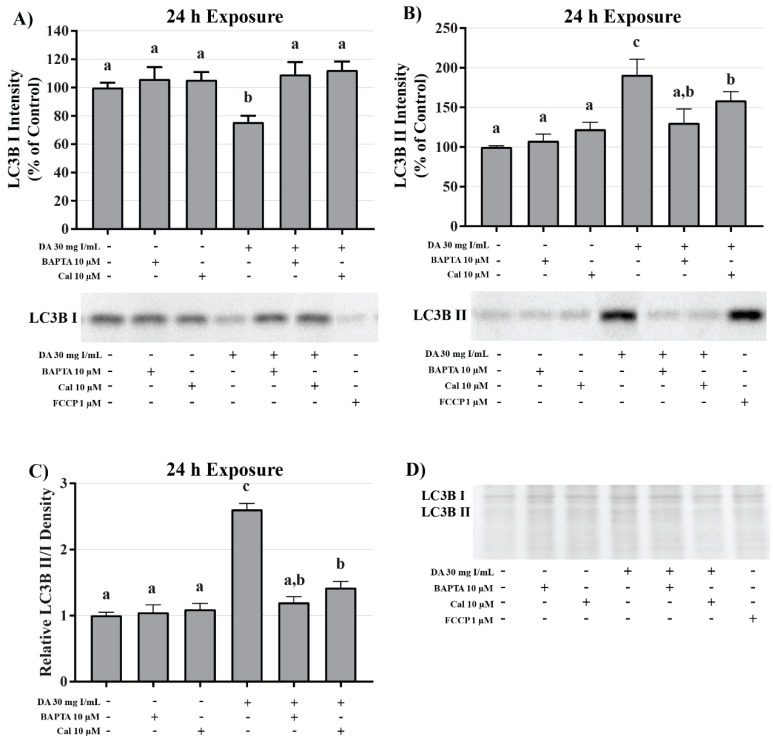
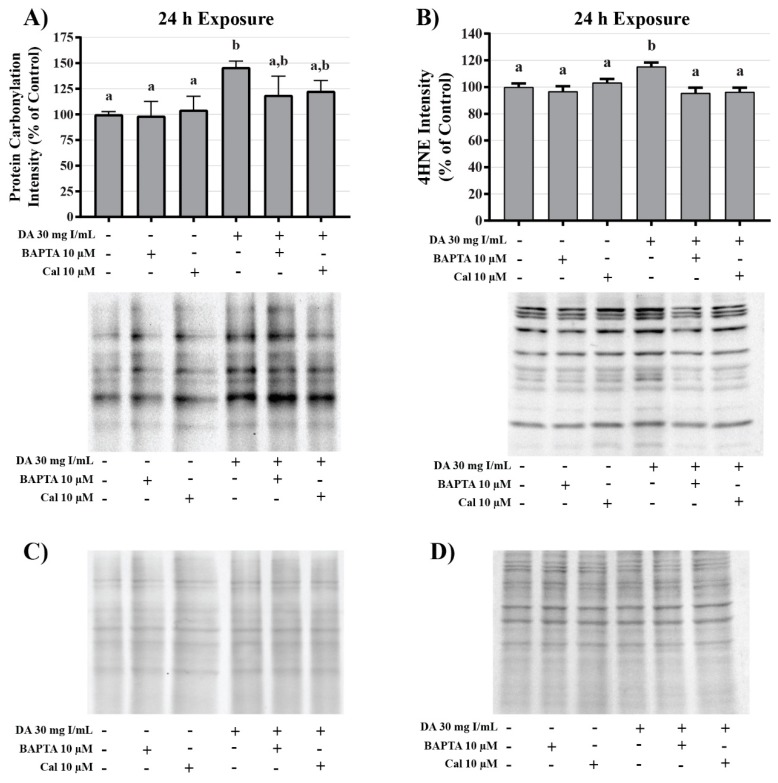
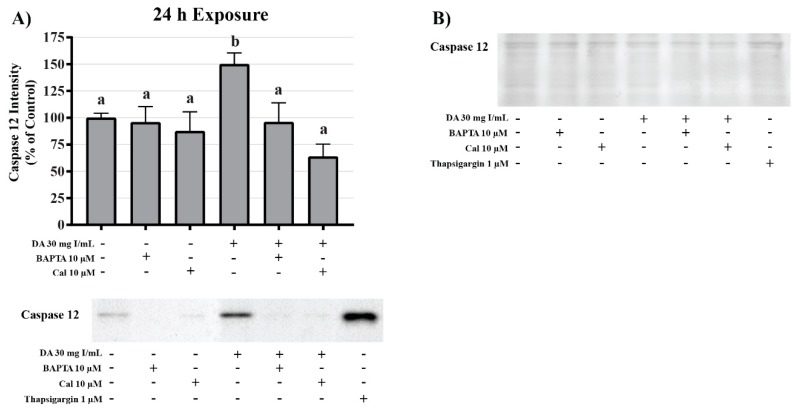
Contrast-induced acute kidney injury (CI-AKI) is the third most common cause of hospital associated kidney damage. Potential mechanisms of CI-AKI may involve diminished renal hemodynamics, inflammatory responses, and direct cytotoxicity. The hypothesis for this study is that diatrizoic acid (DA) induces direct cytotoxicity to human proximal tubule (HK-2) cells via calcium dysregulation, mitochondrial dysfunction, and oxidative stress. HK-2 cells were exposed to 0-30 mg I/mL DA or vehicle for 2-24 h. Conversion of 3-(4,5-dimethylthiazol-2-yl)-2,5-diphenyltetrazolium bromide (MTT) and trypan blue exclusion indicated a decrease in mitochondrial and cell viability within 2 and 24 h, respectively. Mitochondrial dysfunction was apparent within 8 h post exposure to 15 mg I/mL DA as shown by Seahorse XF cell mito and Glycolysis Stress tests. Mitophagy was increased at 8 h by 15 mg I/mL DA as confirmed by elevated LC3BII/I expression ratio. HK-2 cells pretreated with calcium level modulators BAPTA-AM, EGTA, or 2-aminophenyl borinate abrogated DA-induced mitochondrial damage. DA increased oxidative stress biomarkers of protein carbonylation and 4-hydroxynonenol (4HNE) adduct formation. Caspase 3 and 12 activation was induced by DA compared to vehicle at 24 h. These studies indicate that clinically relevant concentrations of DA impair HK-2 cells by dysregulating calcium, inducing mitochondrial turnover and oxidative stress, and activating apoptosis.

Keywords: HK-2 cells; Seahorse XFe; contrast-induced acute kidney injury; diatrizoic acid; mitophagy; oxidative stress; proximal tubule cytotoxicity.


Conflict of interest statement

The authors declare no conflict of interest.

Figures

Figure 1
Figure 1
Diatrizoic acid cytotoxic effects on mitochondrial viability in HK-2 cells using 3-(4,5-dimethylthiazol-2-yl)-2,5-diphenyltetrazolium bromide (MTT). Diatrizoic acid (DA) diminished mitochondrial viability at 2 h (A), 8 h (B), and 24 h (C). Different letters (a–f) above each bar indicate statistical difference (p < 0.05) between all treatments compared across all time points (2, 8, and 24 h). Values represent mean ± SEM for three independent experiments.
Figure 2
Figure 2
Diatrizoic acid cytotoxic effects on cell viability in HK-2 cells using trypan blue exclusion. DA diminished cell viability at 24 h (C) but not at 2 h (A) or 8 h (B). Different letters (a–c) above each bar indicate statistical difference (p < 0.05) when comparing all DA concentrations across all time points. Values represent mean ± SEM for three independent experiments.
Figure 3
Figure 3
Diatrizoic acid effects on various parameters of mitochondrial respiration in HK-2 cells. DA diminished key parameters of mitochondrial respiration following 8 h (A) and 24 h (B) exposure. Representative time course profile of oxygen consumption rate (OCR) of a Seahorse cell mito stress test following exposure to DA for 8 h (C) and 24 h (D). Statistical difference from 0 mg I/mL DA depicted by an asterisk (* p < 0.05, ** p < 0.01, *** p < 0.001). Values represent mean ± SEM for three independent experiments.
Figure 4
Figure 4
Diatrizoic acid effects on various parameters of glycolysis in HK-2 cells. DA diminished key parameters of glycolysis following 8 h (A) and 24 h (B) exposure. Representative time course profile of extracellular acidification rate (ECAR) of a Seahorse cell glycolytic stress test following exposure to DA for 8 h (C) and 24 h (D). Statistical difference from 0 mg I/mL DA depicted by an asterisk (* p < 0.05, ** p < 0.01). Values represent mean ± SEM for three independent experiments.
Figure 5
Figure 5
Diatrizoic acid effects on mitochondrial, glycolytic, and total ATP production. DA diminished ATP production linked to mitochondrial respiration (A) and total ATP production (C) but not glycolytic ATP production (B) following 24 h exposure. Representative graph of ATP production of the real-time ATP rate assay following exposure to DA for 24 h (D). Statistical difference from 0 mg I/mL DA depicted by an asterisk (* p < 0.05, *** p < 0.001). Values represent mean ± SEM for three independent experiments.
Figure 6
Figure 6
Diatrizoic acid effects on mitochondrial fuel oxidation in HK-2 cells. DA did not affect mitochondrially-linked oxidation of glucose, glutamine, and fatty acids in response to 8 h exposure. Values represent mean ± SEM for three independent experiments.
Figure 7
Figure 7
Diatrizoic acid effects on LC3B expression in HK-2 cells following 8 h exposure. DA induced mitophagy following 8 h exposure. Representative blots and cumulative densitometry included for LC3BI (A), LC3BII (B) exposure, and LC3BII/LC3B I ratio (C) following 8 h exposure to DA. Representative blot showing equivalent Memcode reversible stain for 40 µg loaded protein depicted for 8 h (D) exposure. Statistical difference from 0 mg I/mL diatrizoic acid depicted by an asterisk (* p < 0.05, ** p < 0.01, *** p < 0.001). Values represent mean ± SEM for three independent experiments.
Figure 8
Figure 8
Diatrizoic acid effects on LC3B expression in HK-2 cells following 24 h exposure. DA induced mitophagy following 24 h exposure. Representative blots and cumulative densitometry included for LC3BI (A), LC3BII (B) exposure, and LC3BII/LC3BI ratio (C) following 24 h exposure to DA. Memcode protein staining of LC3BI and II blot loaded with 40 µg protein (D). Statistical difference from 0 mg I/mL diatrizoic acid depicted by an asterisk (* p < 0.05, ** p < 0.01, *** p < 0.001). Values represent mean ± SEM for three independent experiments.
Figure 9
Figure 9
Diatrizoic acid effects on GRP78 expression in HK-2 cells. DA did not activate the unfolded protein response (UPR). Representative blots and cumulative densitometry included for glucose-regulated protein 78 (GRP78) expression following 2 h (A), 8 h (B), and 24 h (C) exposure to DA. Protein loading of 40 µg in each lane was visualized with Memcode reversible stain and depicted below each GRP78 blot. Values represent mean ± SEM for three independent experiments.
Figure 10
Figure 10
Diatrizoic acid effects on C/EBP homologous protein (CHOP) expression in HK-2 cells. DA did not induce ER stress. Representative blots and cumulative densitometry included for CHOP expression at 24 h (A). Panel (B) depicts Memcode reversible stain for 40 µg loaded protein. Positive control for CHOP expression was thapsigargin (THAP). Values represent mean ± SEM for three independent experiments.
Figure 11
Figure 11
Diatrizoic acid effects on protein carbonylation in HK-2 cells. Carbonylated proteins were similar between control and DA treated cells at 8 h (A). DA at 18–30 mg I/mL increased protein carbonylation in cell lysate at 24 h (C). Memcode reversible stain for 15 µg protein depicted for 8 h (B) and 24 h (D) exposure. Statistical difference from 0 mg I/mL diatrizoic acid loading for gels is depicted by an asterisk (* p < 0.05, ** p < 0.01, *** p < 0.001). Values represent mean ± SEM for three independent experiments.
Figure 12
Figure 12
Diatrizoic acid effects on 4-hydroxynonenol (4HNE) adduct formation in HK-2 cells. An increase in 4HNE protein adduct formation was evident in cell lysate following 24 h exposure (B) to 18–30 mg I/mL. Positive bands of 4HNE were unchanged after 8 h (A) DA exposure. Panels (C) and (D) depict 8 h and 24 h, respectively, for protein loading of 40 µg per lane. Statistical difference from 0 mg I/mL diatrizoic acid depicted by an asterisk (* p < 0.05). Values represent mean ± SEM for three independent experiments.
Figure 13
Figure 13
Diatrizoic acid effects on superoxide dismutase expression and activity in cellular fractions of HK-2 cells. Total superoxide dismutase (SOD) activity was decreased at 24 h by 28 and 30 mg I/mL (A). DA exposure did not change MnSOD activity (B) or protein expression (D). A decrease in Cu/Zn activity (C) was evident at 24 h exposure to 23–30 mg I/mL. Protein staining with Memcode (E) shown for blot visualizing MnSOD (D). Statistical difference from 0 mg I/mL diatrizoic acid depicted by an asterisk (* p < 0.05, ** p < 0.01). Values represent mean ± SEM for three independent experiments.
Figure 14
Figure 14
Diatrizoic acid effects on oxidative stress within cellular fractions of HK-2 cells. DA-induced oxidative stress predominantly in the cytosol. Representative blot and cumulative densitometry for expression of Oxyblot (A) and 4HNE protein adducts (C) in cytosolic and mitochondrial fractions following 24 h exposure to DA. Memcode reversible staining of blots loaded with 15 and 40 µg protein and densitometry for Oxyblot (B) and 4HNE (D). Asterisks (* p < 0.05) indicate statistical difference from vehicle control in cytosolic fraction. Values represent mean ± SEM for three independent experiments.
Figure 15
Figure 15
Diatrizoic acid effects on tumor necrosis factor alpha (TNFα) and NADPH oxidase (NOX4) expression in HK-2 cells. DA induced TNFα activation but did not affect downstream effectors. TNFα expression in cell lysate was decreased in response to 28 and 30 mg I/mL DA at 24 h (A). An increase in TNFα leakage into the cell media was evident at 24 h (C) with 30 mg I/mL DA. No significant change in NOX4 expression was apparent in cell lysate following 24 h (D) exposure to DA. Representative blot with Memcode reversible stain for 40 µg loaded protein depicted for TNFα (B) and NOX4 (E) following 24 h exposure. Statistical difference from 0 mg I/mL diatrizoic acid depicted by an asterisk (* p < 0.05, ** p < 0.01, *** p < 0.001). Values represent mean ± SEM for three independent experiments.
Figure 16
Figure 16
Diatrizoic acid effects on mitochondrial membrane integrity in HK-2 cells. DA diminished mitochondrial membrane integrity. Representative blot and cumulative densitometry for cytochrome c expression (A) in cytosolic and mitochondrial fractions following 24 h exposure to DA. Representative blot of protein staining to confirm equal 40 µg protein loading for cytochrome c (B). Asterisks (* p < 0.05, ** p < 0.01) indicate statistical difference from vehicle control in cytosolic fraction. Octothorpe (# p < 0.05) indicate statistical difference from vehicle control in mitochondrial fraction. Values represent mean ± SEM for three independent experiments.
Figure 17
Figure 17
Diatrizoic acid effects on the expression of caspase 4, caspase 12, and caspase 3 in HK-2 cells. DA induced apoptosis via caspase 3 and caspase 12 activation. Representative blot and cumulative densitometry for total caspase 4 (A), caspase 12 (B), and cleaved caspase 3 (C) protein expression following 24 h exposure to DA. Asterisks (* p < 0.05, ** p < 0.01) indicate statistical difference from vehicle control. Protein loading reversible stain shown below respective protein. Each lane was loaded with 40 µg protein. Values represent mean ± SEM for three independent experiments.
Figure 18
Figure 18
Effects of EGTA (extracellular calcium chelator), BAPTA-AM (intracellular calcium chelator), or 2-APB (inositol triphosphate receptor antagonist) pretreatment on mitochondrial viability in HK-2 cells. DA induced cytotoxicity was attenuated in response to calcium concentration modulators. BAPTA-AM offered protection from DA-induced cytotoxicity within 2 h (A), 8 h (B), and 24 h (C). EGTA and 2-APB provided partial protection from DA-induced cytotoxicity within 8 h (B) and 24 h (C). Different superscripts (a–d) indicate a statistical difference (p < 0.05) between groups. Values represent mean ± SEM for three independent experiments.
Figure 19
Figure 19
Diatrizoic acid effects on calpain activity in HK-2 cells. DA induced activation of calpain. HK-2 cells exposed to 30 mg I/mL DA for 24 h demonstrated a two-fold increase in calpain activity. Pretreatment with either 10 µM BAPTA-AM (calcium chelator) or 10 µM calpeptin (Cal; calpain pathway inhibitor) completely abrogated DA-induced calpain activity. Different superscripts (a,b) indicate a statistical difference between groups. Values represent mean ± SEM for three independent experiments of two biological replicants.
Figure 20
Figure 20
Effects of BAPTA-AM or calpeptin pretreatment on light chain (LC)3B expression in HK-2 cells. Pretreating HK-2 cells with BAPTA-AM or calpeptin attenuated DA-induced conversion of LC3BI to LC3BII. Representative blots and cumulative densitometry included for LC3BI (A), LC3BII (B), and LC3BII/LC3B I ratio (C) following 24 h exposure to DA. Protein loading stain depicted for 40 µg loaded pin (D). Positive control for LC3B conversion was FCCP (oxidative phosphorylation uncoupling agent). Different superscripts (a–c) indicate a statistical difference (p < 0.05) between group. Values represent mean ± SEM for three independent experiments of two biological replicants.
Figure 21
Figure 21
Effects of BAPTA-AM or calpeptin pretreatment on oxidative stress in HK-2 cells. Pretreatment with BAPTA-AM or calpeptin slightly decreased protein carbonylation and completely abrogated 4HNE adduct formation. Representative blots and cumulative densitometry included for protein carbonylation (A) and 4HNE adduct formation (B) following 24 h exposure to DA. Panel (C) depicts protein loading of protein carbonylation membrane and panel (D) depicts protein loading for 4HNE membrane. Different superscripts (a,b) indicate a statistical difference (p < 0.05) between groups. Values represent mean ± SEM for three independent experiments.
Figure 22
Figure 22
Effects of BAPTA-AM or calpeptin pretreatment on caspase 12 activity in HK-2 cells. Pretreatment with BAPTA-AM or calpeptin abrogated caspase 12 activation. Representative blots and cumulative densitometry included for caspase 12 (A) following 24 h exposure to DA. Representative blot with Memcode reversible stain for 40 µg loaded protein (B). Positive control for caspase 12 activation was thapsigargin. Different superscripts (a,b) indicate a statistical difference (p < 0.05) between various groups. Values represent mean ± SEM for three independent experiments.

References

    1. Fahling M., Seeliger E., Patzak A., Persson P.B. Understanding and preventing contrast-induced acute kidney injury. Nat. Rev. Nephrol. 2017;13:169–180. doi: 10.1038/nrneph.2016.196. - DOI - PubMed
    1. Brown J.R., Rezaee M.E., Nichols E.L., Marshall E.J., Siew E.D., Matheny M.E. Incidence and In-Hospital Mortality of Acute Kidney Injury (AKI) and Dialysis-Requiring AKI (AKI-D) After Cardiac Catheterization in the National Inpatient Sample. J. Am. Heart Assoc. 2016;5:e002739. doi: 10.1161/JAHA.115.002739. - DOI - PMC - PubMed
    1. Persson P.B., Hansell P., Liss P. Pathophysiology of contrast medium-induced nephropathy. Kidney Int. 2005;68:14–22. doi: 10.1111/j.1523-1755.2005.00377.x. - DOI - PubMed
    1. Liu Z.Z., Viegas V.U., Perlewitz A., Lai E.Y., Persson P.B., Patzak A., Sendeski M.M. Iodinated contrast media differentially affect afferent and efferent arteriolar tone and reactivity in mice: A possible explanation for reduced glomerular filtration rate. Radiology. 2012;265:762–771. doi: 10.1148/radiol.12120044. - DOI - PubMed
    1. Huang Y.T., Chen Y.Y., Lai Y.H., Cheng C.C., Lin T.C., Su Y.S., Liu C.H., Lai P.C. Resveratrol alleviates the cytotoxicity induced by the radiocontrast agent, ioxitalamate, by reducing the production of reactive oxygen species in HK-2 human renal proximal tubule epithelial cells in vitro. Int. J. Mol. Med. 2016;37:83–91. doi: 10.3892/ijmm.2015.2404. - DOI - PMC - PubMed

MeSH terms