Comparative Study
. 2019 Aug 22;20(1):668.
doi: 10.1186/s12864-019-6002-9.

Comparative transcriptomics of early petal development across four diverse species of Aquilegia reveal few genes consistently associated with nectar spur development

Affiliations
Comparative Study

Comparative transcriptomics of early petal development across four diverse species of Aquilegia reveal few genes consistently associated with nectar spur development

Evangeline S Ballerini et al. BMC Genomics. .

Abstract

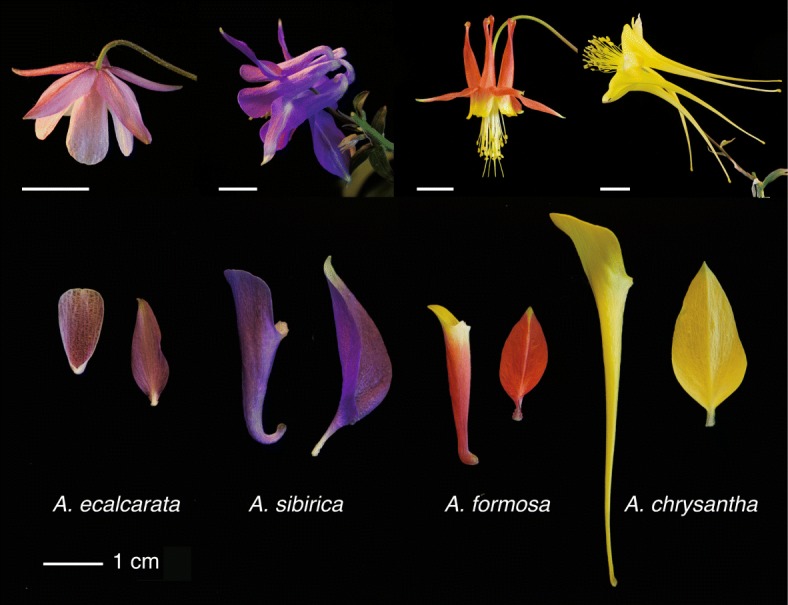
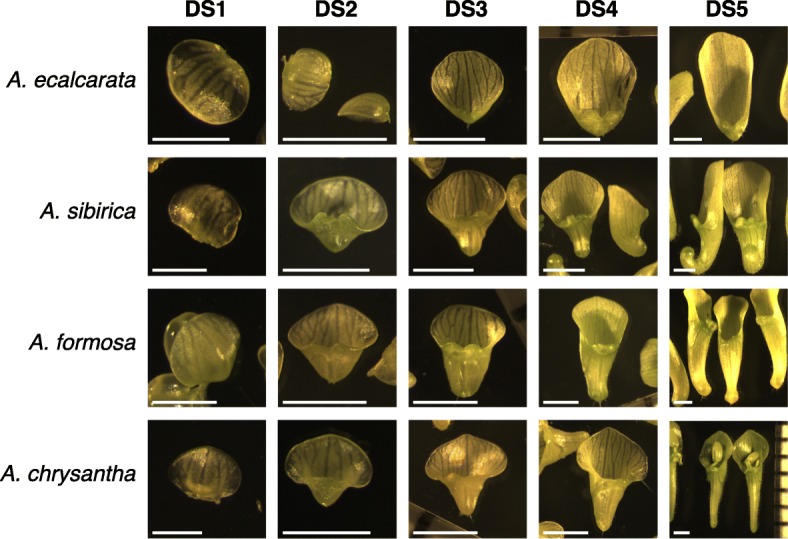
Background: Petal nectar spurs, which facilitate pollination through animal attraction and pollen placement, represent a key innovation promoting diversification in the genus Aquilegia (Ranunculaceae). Identifying the genetic components that contribute to the development of these three-dimensional structures will inform our understanding of the number and types of genetic changes that are involved in the evolution of novel traits. In a prior study, gene expression between two regions of developing petals, the laminar blade and the spur cup, was compared at two developmental stages in the horticultural variety A. coerulea 'Origami'. Several hundred genes were differentially expressed (DE) between the blade and spur at both developmental stages. In order to narrow in on a set of genes crucial to early spur formation, the current study uses RNA sequencing (RNAseq) to conduct comparative expression analyses of petals from five developmental stages between four Aquilegia species, three with morphologically variable nectar spurs, A. sibirica, A. formosa, and A. chrysantha, and one that lacks nectar spurs, A. ecalcarata.

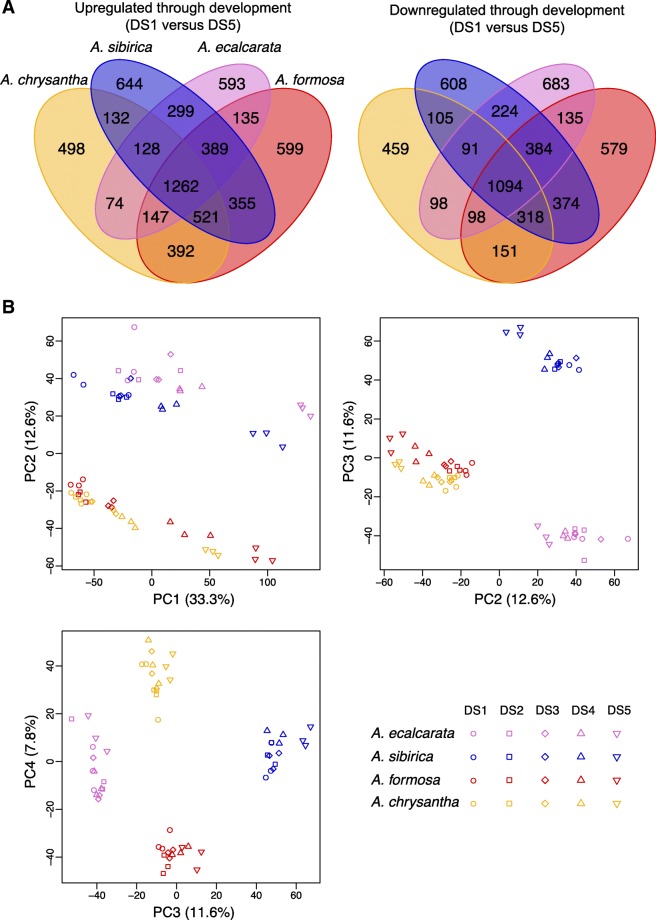
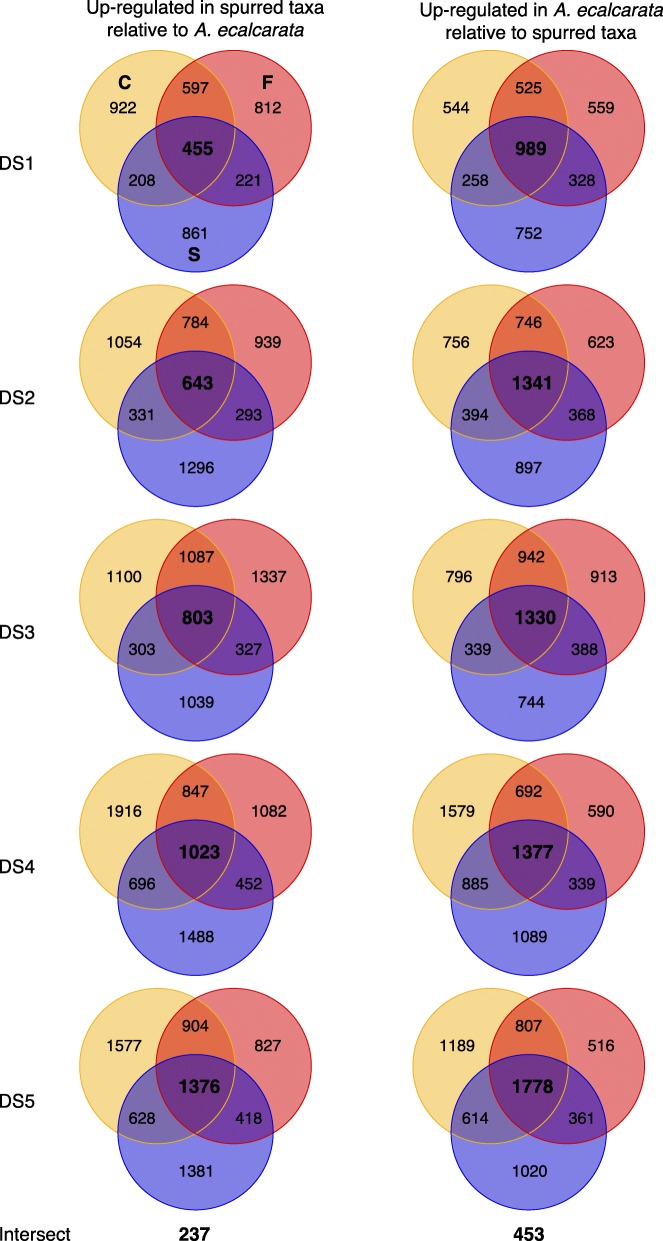
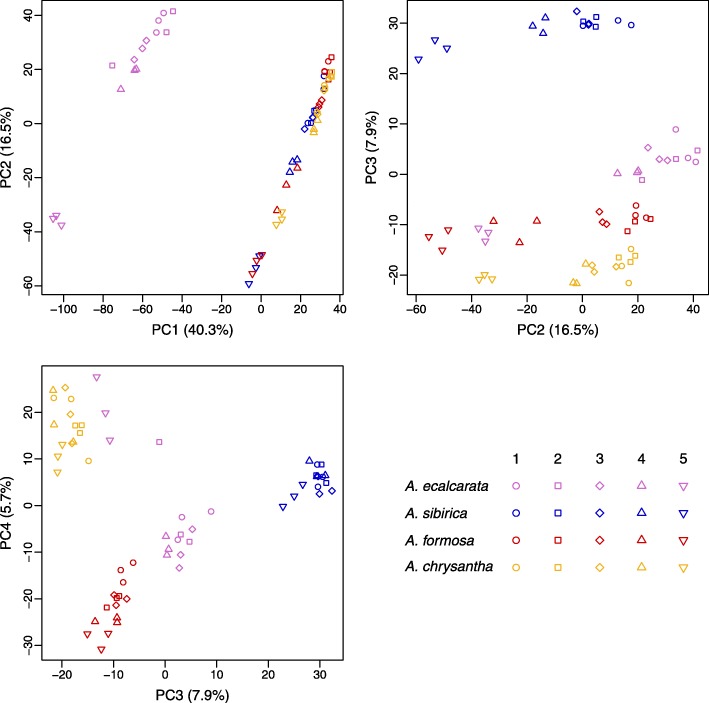
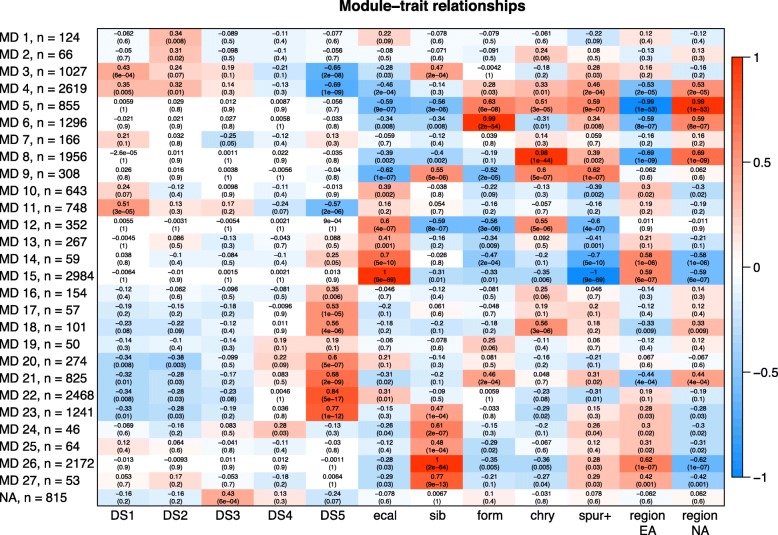
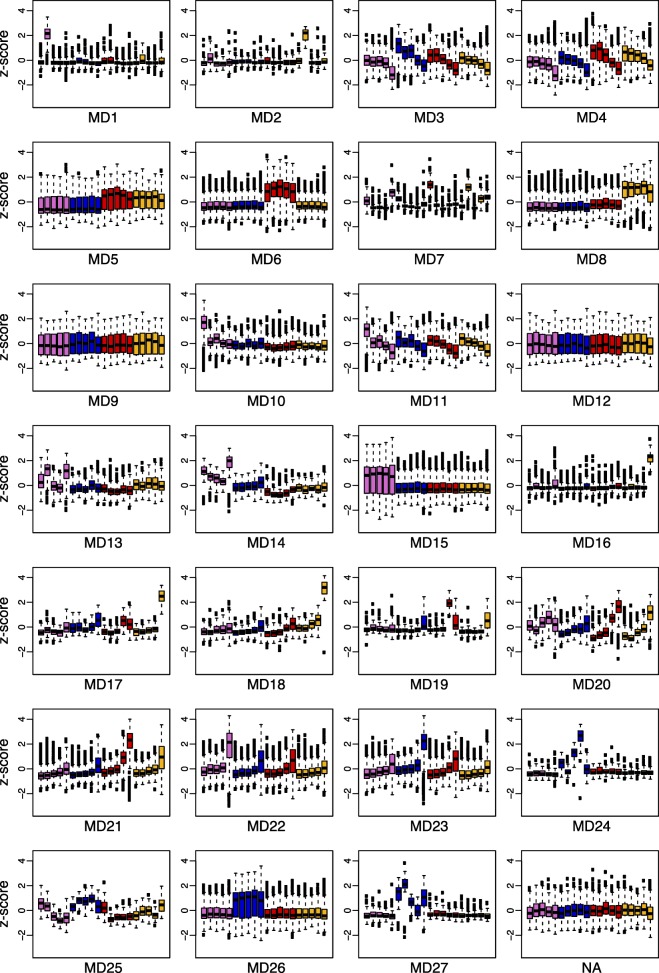
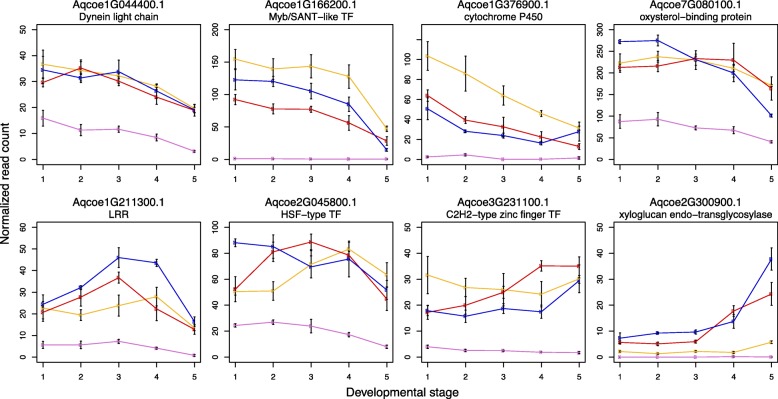
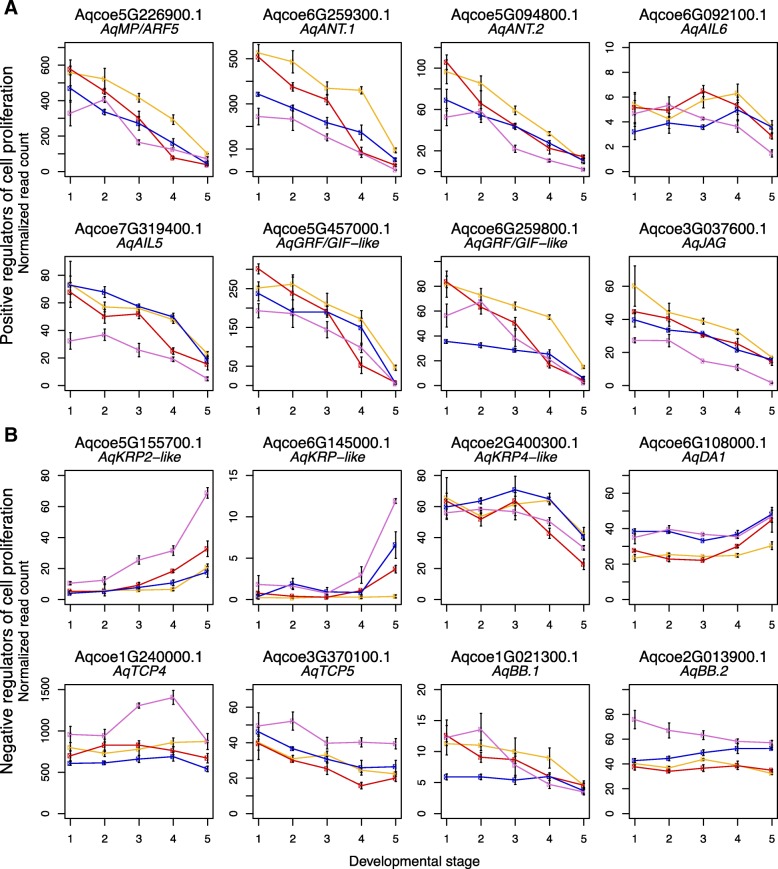
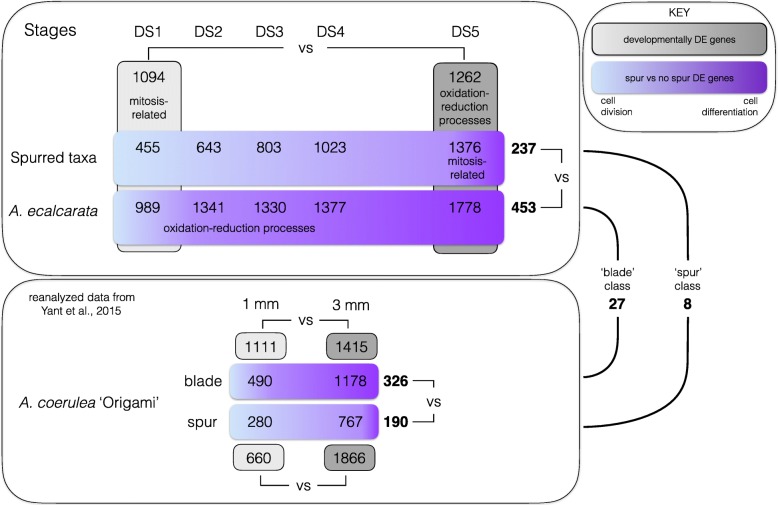
Results: Petal morphology differed increasingly between taxa across the developmental stages assessed, with petals from all four taxa being indistinguishable pre-spur formation at developmental stage 1 (DS1) and highly differentiated by developmental stage 5 (DS5). In all four taxa, genes involved in mitosis were down-regulated over the course of the assessed developmental stages, however, many genes involved in mitotic processes remained expressed at higher levels later in development in the spurred taxa. A total of 690 genes were identified that were consistently DE between the spurred taxa and A. ecalcarata at all five developmental stages. By comparing these genes with those identified as DE between spur and blade tissue in A. coerulea 'Origami', a set of only 35 genes was identified that shows consistent DE between petal samples containing spur tissue versus those without spur tissue.

Conclusions: The results of this study suggest that expression differences in very few loci are associated with the presence and absence of spurs. In general, it appears that the spurless petals of A. ecalcarata cease cell divisions and enter the cell differentiation phase at an earlier developmental time point than those that produce spurs. This much more tractable list of 35 candidates genes will greatly facilitate targeted functional studies to assess the genetic control and evolution of petal spurs in Aquilegia.

Keywords: Aquilegia; Diversification; Evolution; Gene expression; Nectar spur; Petal development; RNAseq.


Conflict of interest statement

The authors declare that they have no competing interests.

Figures

Fig. 1
Fig. 1
Examples of floral morphological variation in Aquilegia species with different pollinators. Top: entire flowers. From left to right, A. ecalcarata, primarily pollinated by syrphid flies; A. sibirica, primarily pollinated by bees; A. formosa, primarily pollinated by hummingbirds; A. chrysantha, primarily pollinated by hawk moths. Scale bars equal to 1 cm. Bottom: a dissected petal (left) and sepal (right) from each species. The adaxial surface of the A. ecalcarata petal is in view, whereas all other petals are more-or-less viewed in the sagittal plane with the abaxial surface in view. The adaxial surface of all sepals is in view, however the A. sibirica sepal is partially folded longitudinally
Fig. 2
Fig. 2
Examples of petals from each species at each developmental stage assessed. For DS1, the scale bars are 0.5 mm. For DS2-DS5, the scale bars are 1 mm. Although stamens are pictured in some photographs, all stamen material was removed prior to tissue preparation for RNA extraction
Fig. 3
Fig. 3
Venn diagram and PCA of genes DE in each species between DS1 and DS5. a Venn diagram of genes up- and down-regulated (left and right, respectively) in each species between DS1 and DS5. b PCA using developmentally DE genes. PCA of the genes differentially expressed in any species between DS1 and DS5 for each sample (all species and developmental stages). PC1 can be explained by developmental stage (33.3% variance explained). PC2 can be explained by phylogenetic relatedness (12.6% variance explained). PC3 captures differences between A. ecalcarata and A. sibirica (11.6% variance explained) and PC4 captures differences between A. formosa and A. chrysantha (7.8% variance explained). Key: A. ecalcarata = lavender, A. sibirica = blue, A. formosa = red, and A. chrysantha = yellow, DS1 = circle, DS2 = square, DS3 = diamond, DS4 = traingle, DS5 = inverted triangle
Fig. 4
Fig. 4
Venn diagrams of genes DE between each spurred taxon and A. ecalcarata at each developmental stage. Genes up-regulated in each spurred taxon relative to A. ecalcarata at each DS are on the left. Genes down-regulated in each spurred taxon relative to A. ecalcarata at each DS are on the right. Blue/S =A. sibirica, red/F =A. formosa, and yellow/C =A. chrysantha
Fig. 5
Fig. 5
PCA of genes differentially expressed between spurred taxa and A. ecalcarata. PCA of the genes commonly differentially expressed between A. ecalcarata and each spurred species at any developmental time point for each sample (all species and developmental stages). Key: A. ecalcarata = lavender, A. sibirica = blue, A. formosa = red, and A. chrysantha = yellow, DS1 = circle, DS2 = square, DS3 = diamond, DS4 = traingle, DS5 = inverted triangle
Fig. 6
Fig. 6
WGCNA module and trait associations. Rows correspond to the different modules formed by cluster analysis. Columns represent different traits, including developmental stage (DS1-DS5), species (ecal =A. ecalcarata, sib =A. sibirica, form =A. formosa, chry =A. chrysantha), the presence of spurs (spur+), and species region (EA = Eurasia, NA = North America). For each module-trait combination, the correlation coefficient (top value) and the p-value (bottom value in parentheses) of the association between the module eigengene and the trait is provided. The correlation is also color-coded, with red representing high positive correlation and blue indicating high negative correlation
Fig. 7
Fig. 7
Box plots of the average z-score of the three biological replicates per species and developmental stage for genes in each WGCNA module. From left to right for each plot: A. ecalcarata developmental stages 1-5 (lavender), A. sibirica stages 1-5 (blue), A. formosa stages 1-5 (red), and A. chrysantha stages 1-5 (yellow). Z-scores for each transcript were calculated across all samples (n=60) before calculating the average z-score for the three biological replicates of each species and developmental stage
Fig. 8
Fig. 8
Genes up-regulated in spurred taxa and in the spur cup of A. coerulea “Origami”. Mean normalized read counts across three biological replicates for each species and developmental stage. The error bars represent the standard error of the three biological replicates used to calculate the mean. Key: A. ecalcarata = lavender, A. sibirica = blue, A. formosa = red, and A. chrysantha = yellow
Fig. 9
Fig. 9
Expression of homologs of petal cell developmental regulators. a Normalized read counts of Aquilegia homologs of positive regulators of A. thaliana cell proliferation across development. b Normalized read counts of Aquilegia homologs of negative regulators of A. thaliana cell proliferation across development. For each plot, mean normalized read counts across three biological replicates for each species and developmental stage are presented. The error bars represent the standard error of the three biological replicates used to calculate the mean. Key: A. ecalcarata = lavender, A. sibirica = blue, A. formosa = red, and A. chrysantha = yellow
Fig. 10
Fig. 10
Summary of gene expression patterns. The upper panel summarizes results from the current data set and the lower panel summarizes results from Yant et al., 2015. Grey boxes show genes DE between developmental stages. Purple boxes show genes DE between samples with and without spur tissue. Upper panel: Between DS1 and DS5, more genes are commonly up-regulated late in development across all taxa (n=1262) than down-regulated (n=1094). Genes expressed early in development are enriched for GO terms related to mitosis while genes expressed later in development are enriched for GO terms related to oxidation-reduction processes (grey boxes). The number of genes DE between the three spurred taxa and A. ecalcarata increases across developmental stages (purple boxes). Late in development (DS5), genes related to mitosis are over-represented in the spurred taxa, while early in development (DS1-DS4), genes related to oxidation-reduction processes are over-represented in A. ecalcarata. More genes are commonly up-regulated in A. ecalcarata relative to the spurred taxa at all developmental stages (n=453 vs. n=237). Bottom panel: In A. coerulea ‘Origami’, between the 1 mm and 3 mm stages, more genes are up-regulated than down-regulated through development in both blade (n=1415 vs n=1111) and spur (n=1866 vs n=660) tissue (grey boxes). Between blade and spur tissue, a greater number of genes is up-regulated in blade tissue relative to spur tissue at both the 1 mm (n=490 vs n=280) and 3 mm stages (n=1178 vs n=767), and commonly across both stages (n=326 vs n=190; purple boxes). Identifying loci commonly DE across both panels, only 27 genes are commonly up-regulated in ‘blade’ class tissue and only 8 genes are commonly up-regulated in ‘spur’ class tissue

References

    1. Ballerini ES, Kramer EM. Environmental and molecular analysis of the floral transition in the lower eudicot Aquilegia. EvoDevo. 2011;2(4):1–20. - PMC - PubMed
    1. Filiault DL, Ballerini ES, Mandáková T, Aköz G, Derieg NJ, Schmutz J, Jenkins J, Grimwood J, Shu S, Hayes RD, Hellsten U, Barry K, Yan J, Mihaltcheva S, Karafiátová M, Nizhynska V, Kramer EM, Lysak MA, Hodges SA, Nordborg M. The Aquilegia genome provides insight into adaptive radiation and reveals an extraordinarily polymorphic chromosome with a unique history. eLife. 2018;7:503. doi: 10.7554/eLife.36426. - DOI - PMC - PubMed
    1. Fior S, Li M, Oxelman B, Viola R, Hodges SA, Ometto L, Varotto C. Spatiotemporal reconstruction of the Aquilegia rapid radiation through next-generation sequencing of rapidly evolving cpDNA regions. New Phytol. 2013;198(2):579–92. doi: 10.1111/nph.12163. - DOI - PubMed
    1. Hodges SA. Floral Nectar Spurs and Diversification. Int J Plant Sci. 1997;158(S6):81–8. doi: 10.1086/297508. - DOI
    1. Hodges SA, Fulton M, Yang JY, Whittall JB. Verne Grant and evolutionary studies of Aquilegia. New Phytol. 2003;161(1):113–20. doi: 10.1046/j.1469-8137.2003.00950.x. - DOI

Publication types

MeSH terms