. 2019 Aug 22;19(1):78.
doi: 10.1186/s12894-019-0506-0.

Relationship between alterations of urinary microbiota and cultured negative lower urinary tract symptoms in female type 2 diabetes patients

Affiliations

Relationship between alterations of urinary microbiota and cultured negative lower urinary tract symptoms in female type 2 diabetes patients

Jiawei Chen et al. BMC Urol. .

Abstract

Background: Lower urinary tract symptoms (LUTS) is the most common complication of diabetes. However, the underlying pathogenesis of cultured negative LUTS (cn-LUTS) in diabetic patients has not been well understood. Numerous evidence indicates that urinary dysbiosis is related to urologic disorders. We aim to study alterations of the urinary microbiota of cn-LUTS in type 2 diabetes (T2D) patients.

Methods: Female T2D patients and controls were recruited and requested to finish the American Urological Association Symptom Index. Mid-stream urine was collected for culturing and extracting DNA. Microbial diversity and composition were analyzed by targeting to 16S rDNA. Linear discriminant analysis effect size (LEfSe) was carried out to identify significantly different bacteria.

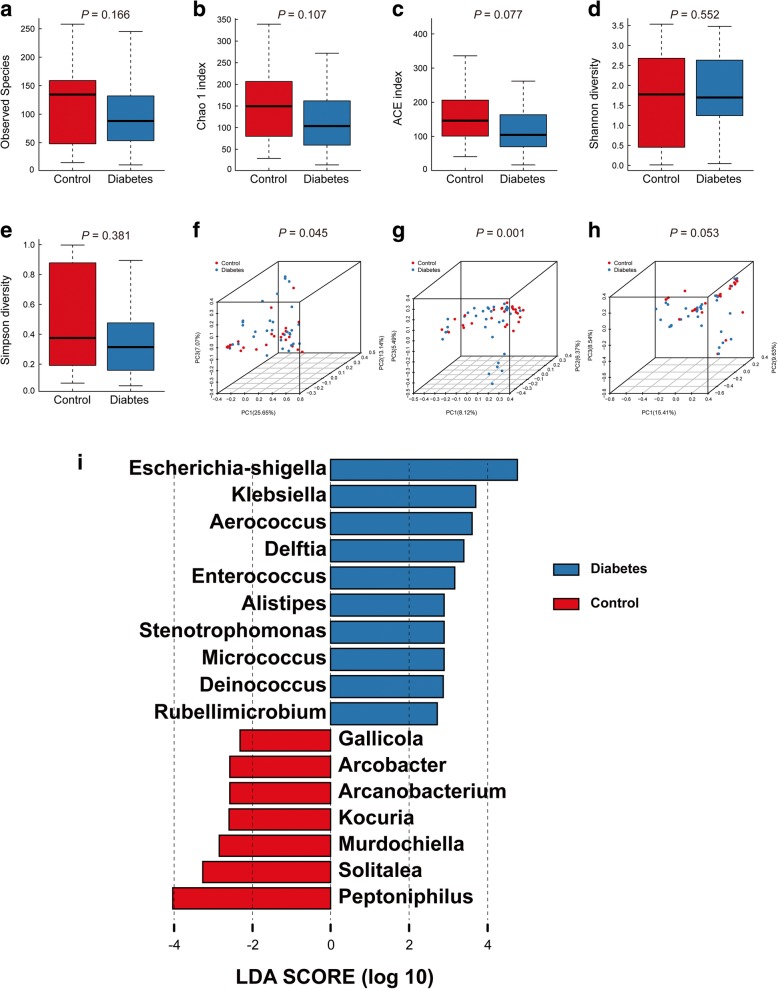
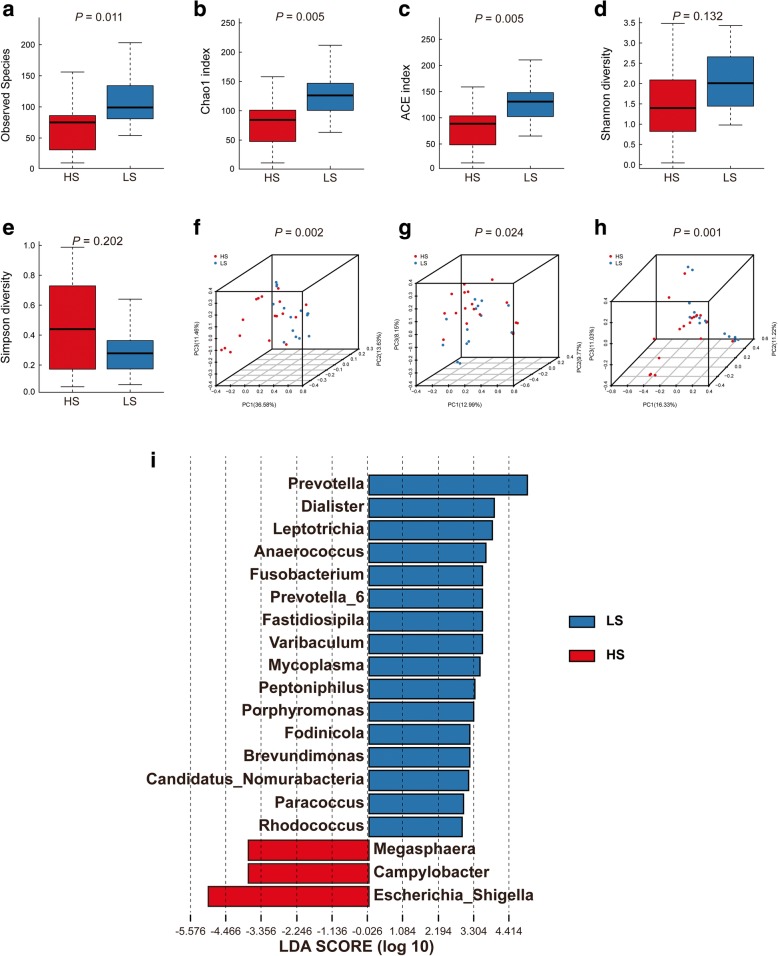
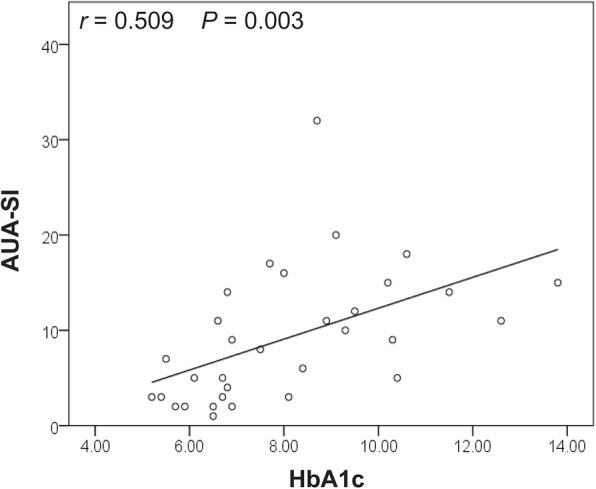
Results: 32 female T2D patients and 26 controls were enrolled. No significant differences in alpha diversity were observed between patients and controls. However, statistically decreased richness (ACE index and Chao 1 index, 85.52(13.75, 204.84) vs. 129.82(63.89, 280.30) and 83.86(11.00, 210.77) vs. 125.19(62.00, 251.77), P = 0.005; Observed Species, 76(10, 175) vs. 98(54, 234), P = 0.011) and decreased species diversity (Shannon index, 1.37(0.04, 3.48) vs. 2.09(0.98, 3.43), P = 0.033; Simpson index, 0.46 (0.06, 0.99) vs. 0.23(0.07, 0.64), P = 0.029) were shown in moderate-to-severe LUTS group and high Hemoglobin A1c group, respectively. A significant difference of beta diversity was found between T2D patients and controls and T2D patients with different severity of cn-LUTS as well as the different level of Hemoglobin A1c. LEfSe revealed that 10 genera (e.g., Escherichia-Shigella and Klebsiella) were increased and 7 genera were decreasing in T2D patients, 3 genera (e.g., Escherichia-Shigella and Campylobacter) were increased and 16 genera (e.g., Prevotella) were reduced in moderate-to-severe LUTS group, 2 genera (Escherichia-Shigella and Lactobacillus) were over-represented and 10 genera (e.g., Prevotella) were under-represented in high Hemoglobin A1c group. Finally, Hemoglobin A1c was found positively correlated with the total score of the American Urological Association Symptom Index (r = 0.509, P = 0.003).

Conclusions: Urinary dysbiosis may be related to cn-LUTS in female T2D patients. A better understanding of urinary microbiota in the development and progression of cn-LUTS in female T2D patients was necessary. The severity of cn-LUTS was correlated to hyperglycemia and chronic hyperglycemia might induce or promote cn-LUTS by influencing urinary microbiota.

Keywords: Diabetes mellitus; Hemoglobin A1c; Lower urinary tract symptoms; Urinary microbiota.


Conflict of interest statement

The authors declare that they have no competing interests.

Figures

Fig. 1
Fig. 1
Alpha diversity and principal coordinate analysis for the control group and diabetes group urinary microbiota. Observed Species (a); Chao1 index(b); ACE index (c); Shannon index (d); Simpson index (e). Principal coordinate analysis plots of the urinary microbiota based on the weighted UniFrac (f), unweighted UniFrac (g) and Bray-Curtis (h) distance metrics. Association of specific microbiota taxa with the diabetes group and control group was analyzed by LEfSe (i). Genera enriched for controls in red and enriched for patients in blue. Only genera meeting a linear discriminant analysis score threshold > 2 are shown
Fig. 2
Fig. 2
Alpha diversity and principal coordinate analysis for the HS group and LS group urinary microbiota. Observed Species (a); Chao1 index (b); ACE index (c); Shannon index (d); Simpson index (e). Principal coordinate analysis plots of the urinary microbiota based on the weighted UniFrac (f), unweighted UniFrac (g) and Bray-Curtis (h) distance metrics. Association of specific microbiota taxa with the HS group and LS group was analyzed by LEfSe (i). Genera enriched for HS in red and enriched for LS in blue. Only genera meeting a linear discriminant analysis score threshold > 2 are shown
Fig. 3
Fig. 3
A clear hierarchical clustering of HS samples was observed in the dendrogram at the genus level (left; based on Bray Curtis distance metrics). In the histogram (right), each colored box represents a bacterial taxon and each bar, a subject. The height of a colored box represents the relative abundance of each organism in the sample. Bacterial genera with a relative abundance < 0.5% and unclassified genera are grouped as “Other”
Fig. 4
Fig. 4
Alpha diversity and principal coordinate analysis for HH group and LH group urinary microbiota. Observed Species (a); Chao1 index (b); ACE index (c); Shannon index (d); Simpson index (e). Principal coordinate analysis plots of the urinary microbiota based on the weighted UniFrac (f), unweighted UniFrac (g) and Bray-Curtis (h) distance metrics. Association of specific microbiota taxa with HH group and LH group was analyzed by LEfSe (i). Genera enriched for HH in red and enriched for LH in blue. Only genera meeting a linear discriminant analysis score threshold > 2 are shown
Fig. 5
Fig. 5
Correlations between AUA-SI and Hemoglobin A1c in female type 2 diabetes patients. Higher Hemoglobin A1c positively correlated with the AUA-SI score

References

    1. Kirschner-Hermanns R, Daneshgari F, Vahabi B, Birder L, Oelke M, Chacko S. Does diabetes mellitus-induced bladder remodeling affect lower urinary tract function? ICI-RS 2011. Neurourol Urodyn. 2012;31:359–364. doi: 10.1002/nau.22228. - DOI - PubMed
    1. Golbidi S, Laher I. Bladder dysfunction in diabetes mellitus. Front Pharmacol. 2010;1:136. doi: 10.3389/fphar.2010.00136. - DOI - PMC - PubMed
    1. Daneshgari F, Liu G, Birder L, Hanna-Mitchell AT, Chacko S. Diabetic bladder dysfunction: current translational knowledge. J Urol. 2009;182(Suppl):18–26. - PMC - PubMed
    1. Young VB. The role of the microbiome in human health and disease: an introduction for clinicians. BMJ. 2017;15:j831. doi: 10.1136/bmj.j831. - DOI - PubMed
    1. Darveau RP. Periodontitis: a polymicrobial disruption of host homeostasis. Nat Rev Microbiol. 2010;8:481–490. doi: 10.1038/nrmicro2337. - DOI - PubMed