

Use of machine learning to analyse routinely collected intensive care unit data: a systematic review
- PMID: 31439010
- PMCID: PMC6704673
- DOI: 10.1186/s13054-019-2564-9
Use of machine learning to analyse routinely collected intensive care unit data: a systematic review
Abstract
Background: Intensive care units (ICUs) face financial, bed management, and staffing constraints. Detailed data covering all aspects of patients' journeys into and through intensive care are now collected and stored in electronic health records: machine learning has been used to analyse such data in order to provide decision support to clinicians.
Methods: Systematic review of the applications of machine learning to routinely collected ICU data. Web of Science and MEDLINE databases were searched to identify candidate articles: those on image processing were excluded. The study aim, the type of machine learning used, the size of dataset analysed, whether and how the model was validated, and measures of predictive accuracy were extracted.
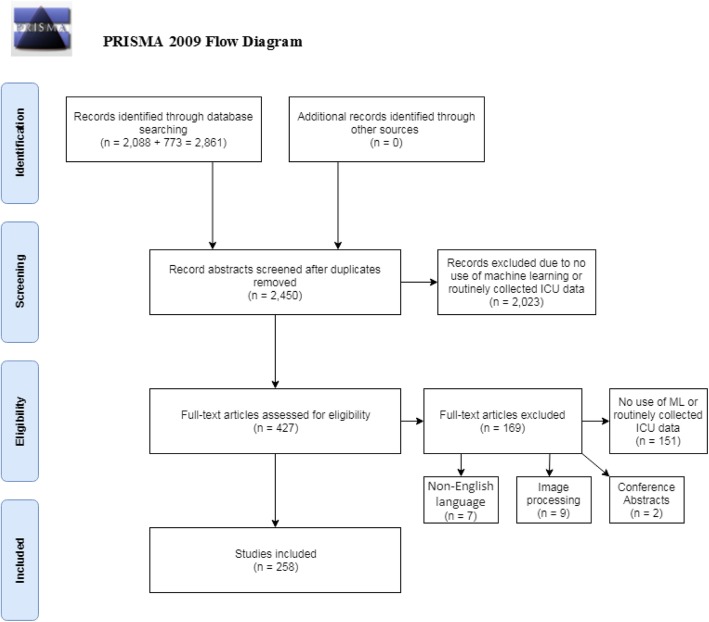
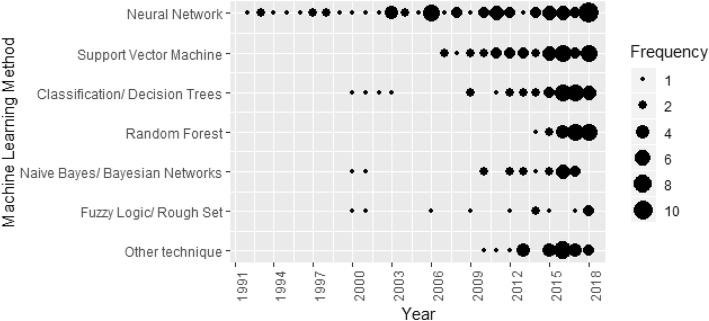
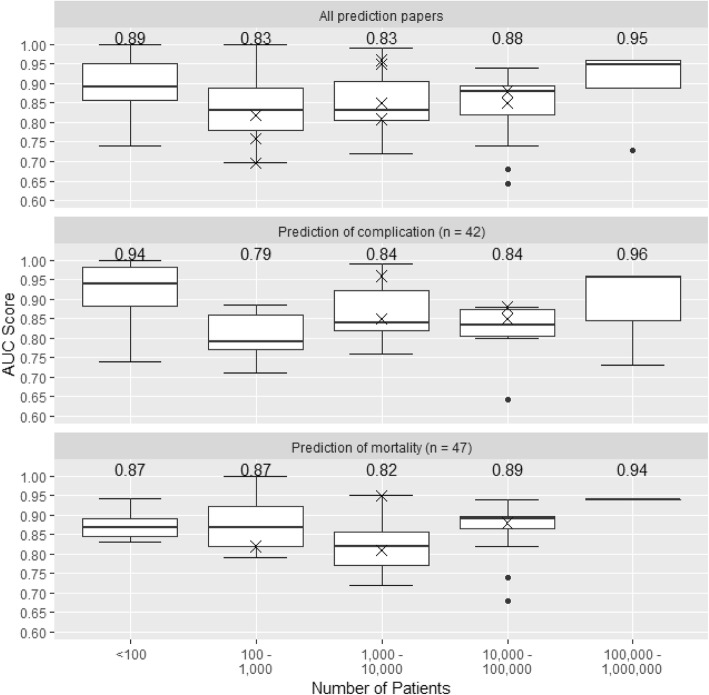
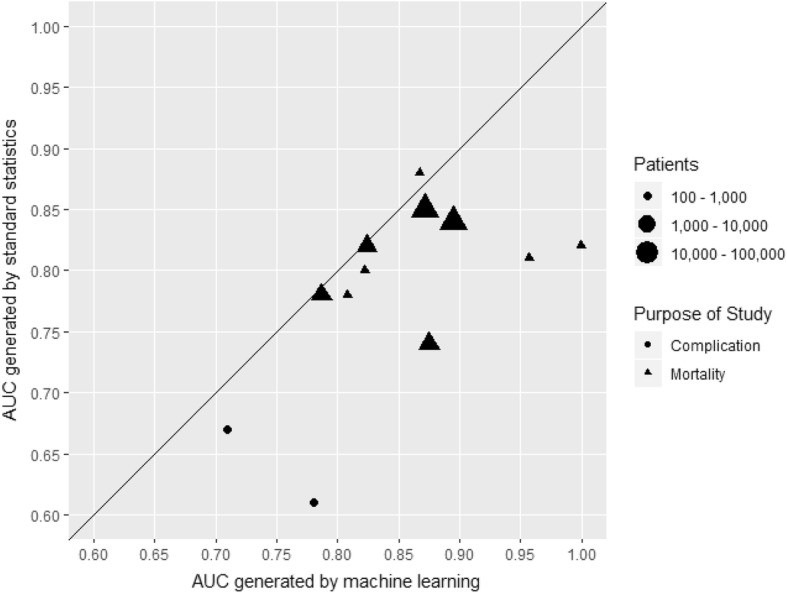
Results: Of 2450 papers identified, 258 fulfilled eligibility criteria. The most common study aims were predicting complications (77 papers [29.8% of studies]), predicting mortality (70 [27.1%]), improving prognostic models (43 [16.7%]), and classifying sub-populations (29 [11.2%]). Median sample size was 488 (IQR 108-4099): 41 studies analysed data on > 10,000 patients. Analyses focused on 169 (65.5%) papers that used machine learning to predict complications, mortality, length of stay, or improvement of health. Predictions were validated in 161 (95.2%) of these studies: the area under the ROC curve (AUC) was reported by 97 (60.2%) but only 10 (6.2%) validated predictions using independent data. The median AUC was 0.83 in studies of 1000-10,000 patients, rising to 0.94 in studies of > 100,000 patients. The most common machine learning methods were neural networks (72 studies [42.6%]), support vector machines (40 [23.7%]), and classification/decision trees (34 [20.1%]). Since 2015 (125 studies [48.4%]), the most common methods were support vector machines (37 studies [29.6%]) and random forests (29 [23.2%]).
Conclusions: The rate of publication of studies using machine learning to analyse routinely collected ICU data is increasing rapidly. The sample sizes used in many published studies are too small to exploit the potential of these methods. Methodological and reporting guidelines are needed, particularly with regard to the choice of method and validation of predictions, to increase confidence in reported findings and aid in translating findings towards routine use in clinical practice.
Keywords: Artificial intelligence; Intensive care unit; Machine learning; Routinely collected data.
Conflict of interest statement
The authors declare that they have no competing interests.
Figures

References
-
- Xu H, Wu W, Nemati S, Zha H. Patient flow prediction via discriminative learning of mutually-correcting processes. IEEE Trans Knowl Data Eng. 2017;29(1):157–171.
-
- Delahanty RJ, Kaufman D, Jones SS. Development and evaluation of an automated machine learning algorithm for in-hospital mortality risk adjustment among critical care patients. Crit Care Med. 2018;06:06. - PubMed
-
- Ltifi H, Benmohamed E, Kolski C, Ben Ayed M. Enhanced visual data mining process for dynamic decision-making. Knowl-Based Syst. 2016;112:166–181.
Publication types
MeSH terms
Grants and funding
LinkOut - more resources
Full Text Sources
Other Literature Sources
Molecular Biology Databases
