. 2019 Sep 27;294(39):14467-14481.
doi: 10.1074/jbc.RA119.010173. Epub 2019 Aug 22.

A chromatin-based mechanism controls differential regulation of the cytochrome P450 gene Cyp24a1 in renal and non-renal tissues

Affiliations

A chromatin-based mechanism controls differential regulation of the cytochrome P450 gene Cyp24a1 in renal and non-renal tissues

Mark B Meyer et al. J Biol Chem. .

Abstract

Cytochrome P450 family 27 subfamily B member 1 (CYP27B1) and CYP24A1 function to maintain physiological levels of 1,25-dihydroxyvitamin D3 (1,25(OH)2D3) in the kidney. Renal Cyp27b1 and Cyp24a1 expression levels are transcriptionally regulated in a highly reciprocal manner by parathyroid hormone (PTH), fibroblast growth factor 23 (FGF23), and 1,25(OH)2D3 In contrast, Cyp24a1 regulation in nonrenal target cells (NRTCs) is limited to induction by 1,25(OH)2D3 Herein, we used ChIP-Seq analyses of mouse tissues to identify regulatory regions within the Cyp24a1 gene locus. We found an extended region downstream of Cyp24a1 containing a cluster of sites, termed C24-DS1, binding PTH-sensitive cAMP-responsive element-binding protein (CREB) and a cluster termed C24-DS2 binding the vitamin D receptor (VDR). VDR-occupied sites were present in both the kidney and NRTCs, but pCREB sites were occupied only in the kidney. We deleted each segment in the mouse and observed that although the overt phenotypes of both cluster deletions were unremarkable, RNA analysis in the C24-DS1-deleted strain revealed a loss of basal renal Cyp24a1 expression, total resistance to FGF23 and PTH regulation, and secondary suppression of renal Cyp27b1; 1,25(OH)2D3 induction remained unaffected in all tissues. In contrast, loss of the VDR cluster in the C24-DS2-deleted strain did not affect 1,25(OH)2D3 induction of renal Cyp24a1 expression yet reduced but did not eliminate Cyp24a1 responses in NRTCs. We conclude that a chromatin-based mechanism differentially regulates Cyp24a1 in the kidney and NRTCs and is essential for the specific functions of Cyp24a1 in these two tissue types.

Keywords: 1,25(OH)2D3; CRISPR/Cas; ChIP-sequencing (ChIP-Seq); Cyp24a1; Cyp27b1; Cyp27b1-KO; FGF23; cytochrome P450; fibroblast growth factor (FGF); gene regulation; parathyroid hormone (PTH); vitamin D.


Conflict of interest statement

The authors declare that they have no conflicts of interest with the contents of this article

Figures

Figure 1.
Figure 1.
Transcriptional regulation of Cyp24a1 in kidney and nonrenal target cells. A, gene expression of Cyp24a1 after treatment in 8–9-week-old C57BL/6 WT mice with ethanol/PBS vehicle (Veh, gray, n = 6), 230 ng/g bw PTH for 1 h (PTH, blue, n = 6), 10 ng/g bw 1,25(OH)2D3 (1,25D3, black, n = 6) for 6 h, or 50 ng/g bw FGF23 for 3 h (FGF23, green, n = 6) examined in kidney, intestine, skin, calvaria, L5 vertebrae, and TPTG. Data are displayed as relative quantitation (RQ, mean ± S.E.) compared with Gapdh. *, p < 0.05 paired t test: treatment versus vehicle. B, overlaid ChIP-Seq data tracks for H3K36me3 from mouse kidney displayed as either basal or vehicle (yellow, n = 3) or treated (blue, n = 3) with 1,25(OH)2D3, FGF23, or PTH as indicated with concentrations used in A with a treatment time of 1 h. Overlapping track data appear as green. Regions of interest are highlighted in light gray boxes. Genomic location and scale are indicated (top), and maximum height of tag sequence density for each data track is indicated on the y axis (top left of each track, normalized to input and 107 tags). Gene transcriptional direction is indicated by an arrow, and exons are indicated by boxes.
Figure 2.
Figure 2.
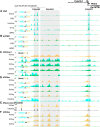
ChIP-Seq analysis displays kidney-specific regulation at the Cyp24a1 gene locus. A–D, overlaid ChIP-Seq data tracks for VDR (A), pCREB (B), H3K4me1 (C), and H3K9ac (D) from mouse kidney, bone marrow–derived mesenchymal stem cells (MSC), intestine, TPTG, or peripheral blood monocytes (pBMC) displayed as either basal or vehicle (yellow, n = 3) or treated (blue, n = 3) with PTH, forskolin (FSK), 1,25(OH)2D3, or FGF23, as indicated. E, DNase-Seq data from the ENCODE project for kidney and intestine. F, H3K9ac data in VDRKO (blue), Cyp27b1KO mice (C27B1KO, blue), or M1-IKO (blue) versus WT (yellow). Overlapping track data appear as green. Regions of interest are highlighted in light gray boxes denoted as C24-DS1, C24-DS2, and C24-PP1. Genomic location and scale are indicated (top), and maximum height of tag sequence density for each data track is indicated on the y axis (top left of each track, normalized to input and 107 tags). Gene transcriptional direction is indicated by an arrow, and exons are indicated by boxes.
Figure 3.
Figure 3.
Schematic representation of the CRISPR/Cas9 deletions in the downstream regions of the Cyp24a1 locus. VDR and pCREB ChIP-Seq data (as in Fig. 2) are shown for reference. Highlighted regions were excised using two CRISPR-guide RNAs each for Cyp24a1-DS1KO and Cyp24a1-DS2KO. Both regions shared a common guide RNA (G2).
Figure 4.
Figure 4.
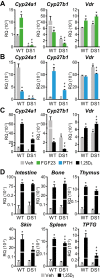
Transcriptional regulation of Cyp24a1 in Cyp24-DS1KO mice. A–C, expression of the genes indicated after treatment in 8–9-week-old Cyp24-DS1KO mice (DS1) and their WT littermates (WT) with ethanol/PBS vehicle (Veh, gray, n = 6–10), 50 ng/g bw FGF23 for 3 h (FGF23, green, n = 6), 230 ng/g bw PTH for 1 h (PTH, blue, n = 8), or 10 ng/g bw 1,25(OH)2D3 (1,25D3, black, n = 9) for 6 h was examined in kidney. D, gene expression of Cyp24a1 after treatment in 8–9-week-old DS1 mice (DS1) and their WT littermates (WT) with ethanol vehicle (Veh, gray, n = 8–9), or 10 ng/g bw 1,25(OH)2D3 (1,25D3, black, n = 9) for 6 h was examined in nonrenal tissues as indicated. Data are displayed as relative quantitation (RQ, mean ± S.E. (error bars)) compared with Gapdh. *, p < 0.05, paired t test: treatment versus vehicle. #, p < 0.05, paired t test: DS1 versus WT received the same treatment.
Figure 5.
Figure 5.
Schematic representation of Cyp24a1 expression levels correlated to vitamin D3 metabolites may help predict skeletal health. Shown is the percentage of Cyp24a1 gene expression levels (x axis) plotted against 25(OH)D3 (gray circles), 24,25(OH)2D3 (black squares), and 25(OH)D3-26,23-lactone (blue triangles) concentrations (y axis) in Cyp24a1-null (C24KO), Cyp27b1-null (C27KO), M1-IKO, M1/M21-DIKO, M21-IKO, and WT littermate control (WT) mice. Skeletal health of the animals is depicted by a green dashed line. Animals to the right of the line are “healthy,” and those to the left are in “poor” skeletal health relative to Ca and P levels as well as circulating concentrations of PTH, FGF23, and 1,25(OH)2D3 (6, 29). Error bars, S.E.
Figure 6.
Figure 6.
Transcriptional regulation of Cyp24a1 in Cyp24-DS2KO mice. A, gene expression of Cyp24a1 after treatment in 8–9-week-old Cyp24-DS2KO mice (C24-DS2) and their WT littermates (WT) with ethanol/PBS vehicle (Veh, gray, n = 4–6), 10 ng/g bw 1,25(OH)2D3 (1,25D3, black, n = 5–6) for 6 h, 50 ng/g bw FGF23 for 3 h (FGF23, green, n = 5–6), or 230 ng/g bw PTH for 1 h (PTH, blue, n = 5–6) was examined in kidney. B–D, gene expression of Cyp24a1 after treatment in 8–9-week-old Cyp24-DS2KO mice (C24-DS2) and their WT littermates (WT) with ethanol vehicle (Veh, gray, n = 4) or either the indicated amounts of 1,25(OH)2D3 (purple, n = 4–5) for 6 h (top row) or 10 ng/g bw 1,25(OH)2D3 (purple, n = 4–5) for the indicated periods of time (bottom row) was examined in kidney (B), intestine (C), or bone (D). Data are displayed as relative quantitation (RQ, mean ± S.E. (error bars)) compared with Gapdh. *, p < 0.05, paired t test: C24-DS2 versus WT received the same treatment.
Figure 7.
Figure 7.
ChIP-Seq analysis of the human kidney reveals conserved genomic occupancy at the CYP24A1 gene locus relative to the mouse. ChIP-Seq analysis of the mouse kidney (top, as in Fig. 2) was contrasted with that derived from isolated human kidney cortex. Overlaid ChIP-Seq data tracks for VDR, pCREB, H3K4me1, and H3K9ac at the Cyp24a1 gene locus from mouse kidney (top) are displayed as either basal or vehicle (yellow, n = 3) or treated for 1 h with PTH or 1,25(OH)2D3 (blue, n = 3), as indicated. Overlapping data (vehicle and treatment) appear as green. Bottom, human kidney ChIP-Seq data for pCREB, VDR, H3K4me1, and H3K27ac at the CYP24A1 gene locus are displayed in triplicate (blue, yellow, and pink; overlaps appear as brown). The DS1 and DS2 regions of interest are highlighted in light gray boxes, where the activity of DS2 in NRTCs was established previously (23). Genomic location and scale are indicated (top), and maximum height of tag sequence density for each data track is indicated on the y axis (top left of each track, normalized to input and 107 tags). The direction of transcription is indicated by the arrow, and exons are indicated by boxes.
Figure 8.
Figure 8.
Vitamin D metabolism in the kidney and nonrenal tissues. Schematic diagram for the regulation of vitamin D metabolism and serum calcium and phosphate homeostasis in the kidney (top) and nonrenal target cells (NRTCs, bottom). Our genetic models (black) and previously existing models (gray) are overlaid on or near the pathways they disrupt. This figure was derived from our earlier publication (7).

References

    1. Jones G., Prosser D. E., and Kaufmann M. (2014) Cytochrome P450-mediated metabolism of vitamin D. J. Lipid Res. 55, 13–31 10.1194/jlr.R031534 - DOI - PMC - PubMed
    1. Veldurthy V., Wei R., Campbell M., Lupicki K., Dhawan P., and Christakos S. (2016) 25-Hydroxyvitamin D3 24-hydroxylase: a key regulator of 1,25(OH)2D3 catabolism and calcium homeostasis. Vitam. Horm. 100, 137–150 10.1016/bs.vh.2015.10.005 - DOI - PubMed
    1. Veldurthy V., Wei R., Oz L., Dhawan P., Jeon Y. H., and Christakos S. (2016) Vitamin D, calcium homeostasis and aging. Bone Res. 4, 16041 10.1038/boneres.2016.41 - DOI - PMC - PubMed
    1. Jones G., and Tenenhouse H. S. (2002) 1,25(OH)2D, the preferred substrate for CYP24. J. Bone Miner. Res. 17, 179–181 10.1359/jbmr.2002.17.1.179 - DOI - PubMed
    1. Jones G., Prosser D. E., and Kaufmann M. (2012) 25-Hydroxyvitamin D-24-hydroxylase (CYP24A1): its important role in the degradation of vitamin D. Arch. Biochem. Biophys. 523, 9–18 10.1016/j.abb.2011.11.003 - DOI - PubMed

Publication types