. 2019 Oct;31(10):2370-2385.
doi: 10.1105/tpc.18.00577. Epub 2019 Aug 22.

Variation in Expression of the HECT E3 Ligase UPL3 Modulates LEC2 Levels, Seed Size, and Crop Yields in Brassica napus

Affiliations

Variation in Expression of the HECT E3 Ligase UPL3 Modulates LEC2 Levels, Seed Size, and Crop Yields in Brassica napus

Charlotte Miller et al. Plant Cell. 2019 Oct.

Abstract

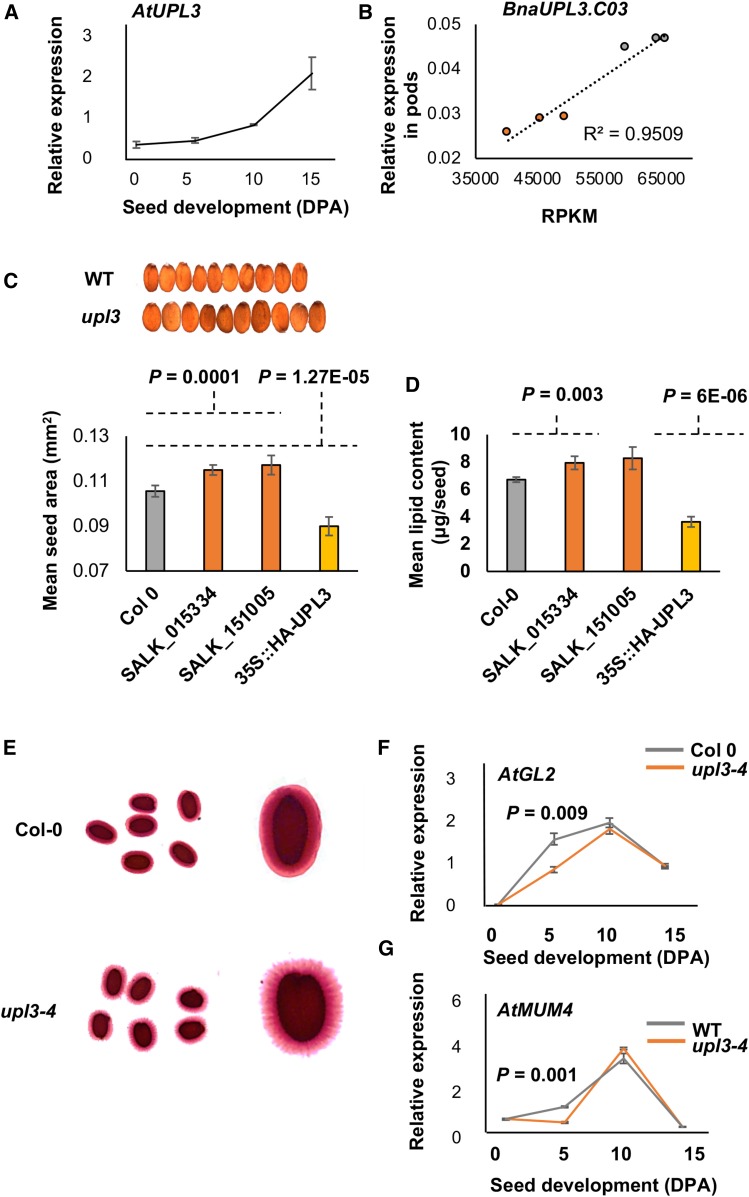
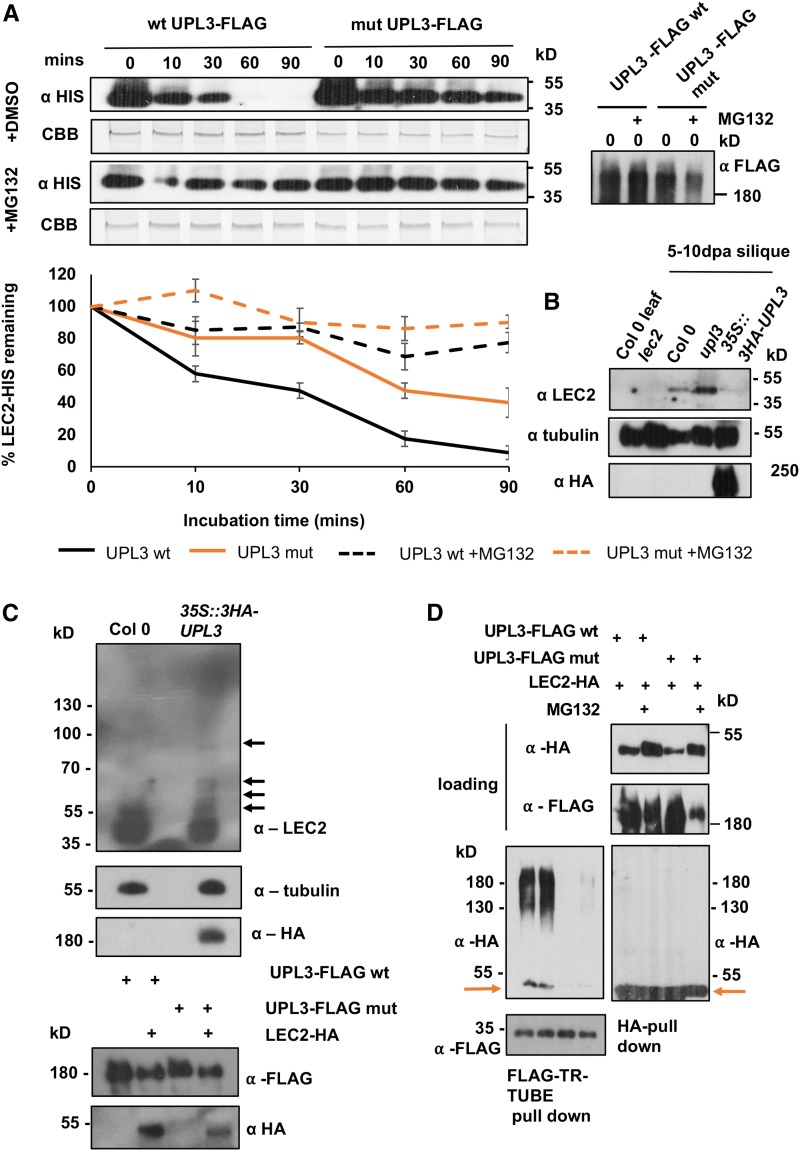
Identifying genetic variation that increases crop yields is a primary objective in plant breeding. We used association analyses of oilseed rape/canola (Brassica napus) accessions to identify genetic variation that influences seed size, lipid content, and final crop yield. Variation in the promoter region of the HECT E3 ligase gene BnaUPL3 C03 made a major contribution to variation in seed weight per pod, with accessions exhibiting high seed weight per pod having lower levels of BnaUPL3 C03 expression. We defined a mechanism in which UPL3 mediated the proteasomal degradation of LEC2, a master transcriptional regulator of seed maturation. Accessions with reduced UPL3 expression had increased LEC2 protein levels, larger seeds, and prolonged expression of lipid biosynthetic genes during seed maturation. Natural variation in BnaUPL3 C03 expression appears not to have been exploited in current B napus breeding lines and could therefore be used as a new approach to maximize future yields in this important oil crop.


Figures

Figure 1.
Figure 1.
Association of Variation in SWPP with SNPs and Differential Expression of BnaUPL3.C03 in a Panel of 94 B. napus Accessions. (A) Associations between SNPs on chromosomes A08/C03 and SWPP. The dotted gray lines outline the genomic location of peaks of SNP associations with SWPP. Markers are plotted in pseudomolecule order and associations as −log10 P values. The colored regions under the pseudochromosome represent the regions of sequence similarity to Arabidopsis chromosomes, as described in Harper et al. (2012). The dashed horizontal red line indicates the Bonferroni-corrected significance threshold. (B) Normal distribution of the SWPP trait in the set of B. napus accessions, showing the data were suitable for MLM analyses. (C) Segregation of SWPP trait means with the most highly associating marker (JCVI_5587:125) show a marker effect of ∼20%. Data are given as mean ± se. P values were determined by Student’s t test. (D) Differential expression of a single C genome assigned unigene C_EX097784 on chromosome C03 was associated with SWPP variation. This unigene is an ortholog of Arabidopsis UPL3, and is termed BnaUPL3.C03. The association exceeded the adjusted P value calculated by the Benjamini-Hochberg method (Q = 0.026). (E) Correlation of BnaUPL3.C03 expression in seedling leaves measured by RPKM and RT-qPCR in six B. napus GWAS accessions (Supplemental Table 2) exhibiting maximal variation in C-EX097784 expression. Measurements of RT-qPCR of BnaUPL3.C03 expression in seedlings were expressed relative to BnaUBC10 expression levels. Lines with high SWPP are shown by orange data points, and lines with low SWPP are shown by gray data points. (F) Correlation of BnaUPL3.C03 transcript abundance in seedlings, measured using RT-qPCR in six B. napus GWAS accession exhibiting maximal variation in SWPP, with variation in SWPP. Lines with high SWPP are shown by orange data points, and lines with low SWPP are shown by gray data points. (G) A subset of 10 GWAS accessions with maximal variation in SWPP (Supplemental Table 2) were grown in replicated plots in field conditions between March and August and mean plot yields measured after combining. Plot yields are shown as mean ± se. P values were determined by Student’s t test.
Figure 2.
Figure 2.
A Loss-of-Function Mutation in Arabidopsis UPL3 Has Increased Seed Size and Altered Seed Storage and Seed Coat Phenotypes. (A) UPL3 expression increases during seed development in Arabidopsis. AtUPL3 expression, measured by RT-qPCR, during seed development in wild-type Col-0. Expression levels are relative to EF1ALPHA expression. Data are given as mean ± se; n = 3 biological replicates. (B) BnaUPL3.C03 expression in developing pods of B. napus accessions described in Figure 1E was correlated with expression in leaves. BnaACTIN2 was used as an internal RT-qPCR control. RT-qPCR analyses used three biological replicates. Lines with high SWPP are represented by orange data points, and lines with low SWPP are shown as gray data points. (C) Loss-of-function mutants of AtUPL3 have enlarged seeds, while AtUPL3 expression from the 35S promoter in Col-0 plants reduced seed size. Areas of Arabidopsis seeds from Col-0, a representative transformant, and two independent upl3 T-DNA loss-of-function mutants. Data are given as mean ± se; n = six biological replicates per genotype using 100 seeds per replicate. P values were determined by Student’s t test. WT, wild type. (D) Loss-of-function mutants of AtUPL3 has elevated seed lipid content, while AtUPL3 expression from the 35S promoter in Col-0 plants reduced lipid content. Lipid content of Arabidopsis seeds from Col-0, two upl3 T-DNA mutants, and a representative 35S:3HA-UPL3 transformant was measured using near-infrared spectroscopy. Data are given as mean ± se; n = 6 biological replicates per genotype using 100 seeds per replicate. P values were determined by Student’s t test. (E) Altered mucilage extrusion of imbibed Arabidopsis seeds in the upl3-4 mutant, visualized by Ruthenium Red staining. (F) Altered expression of the regulatory transcription factor GL2 during early stages of seed development in Atupl3-4 mutant seeds. RNA from whole siliques harvested at 5 to 10 DPA was used. Expression levels are relative to EF1ALPHA expression. Data are given as means ± se; n = 3 biological replicates. P values were determined by Student’s t test. (G) Altered expression of the regulatory transcription factor MUM4 during early stages of seed development in upl3-4 mutant seeds. RNA from whole siliques harvested at 5 to 10 DPA was used. Expression levels are relative to EF1ALPHA expression. Data are given as means ± se; n = 3 biological replicates. P values were determined by Student’s t test. WT, wild type.
Figure 3.
Figure 3.
UPL3 Reduces LEC2-Mediated Gene Expression. Altered expression of Arabidopsis seed maturation genes in the upl3-4 mutant. RT-qPCR was used to measure gene expression during seed development in Col-0 and upl3-4. RNA from whole siliques was used, harvested at the times indicated on the x axis. Expression levels are relative to EF1ALPHA gene expression. Data are given as means ± se n = 3 biological replicates. P values were determined by Student’s t test. (A) AP2 expression. (B) LEC2 expression. (C) LEC1 expression. (D) MYB118 expression. (E) WRI1 expression. (F) RT-qPCR measurement of OLE1 in 10 DPA Col-0 and upl3-4 mutant Arabidopsis plants. RNA from whole siliques was used. Expression levels are relative to EF1ALPHA gene expression. Data are given as means ± se; n = 3 biological replicates. P values were determined by Student’s t test. (G) AtUPL3 reduces LEC2-mediated activation of the OLE1 promoter. Transient expression of the LEC2- regulated OLE1 promoter:fLUC reporter gene in Arabidopsis upl3-4 mutant leaf protoplasts. 35S:Renilla LUC vector was cotransfected in all treatments as a control, and the ratio of Firefly/Renilla LUC activity was used to determine OLE1:fLUC gene expression levels. 35S:3HA-LEC2 and 35S:3FLAG-UPL3 were cotransfected as shown. Data are presented as means ± se; n = 3 independent transfections. P values were determined by Student’s t test.
Figure 4.
Figure 4.
UPL3 Mediates the Proteasomal Degradation of LEC2-HIS and Mediates the Formation of Higher MW Forms of LEC2 in Plants. (A) Cell-free degradation of LEC2-HIS protein. Purified LEC2-HIS expressed in E. coli was incubated at 22°C for the times indicated in total protein extracts from upl3-4 mutant seedlings, with either wild-type– or mutant–purified UPL3-3FLAG added (left), with and without 50 μM of MG132. Immunoblots of reactions were probed with anti-HIS antibodies. “CBB” shows a portion of the reaction stained with Colloidal Coomassie Blue as a loading control. The graph shows results of four independent cell-free reactions using the same batch of purified LEC2-HIS protein. P values were determined by Student’s t test. wt, wild type; mut, mutant. (B) Immunoblots of protein samples from leaf or 10 to 15 DPA siliques of Col-0, lec2 mutant, upl3-4 mutant, and 35S:3HA-UPL3 plants electrophoresed on SDS-PAGE gels and probed with anti-LEC2, anti-HA, or anti-tubulin antibodies as a loading control. TUBULIN levels are to compare protein loading. (C) Expression of 3HA-UPL3 increases higher MW forms of LEC2 in developing siliques. Immunoblots of protein samples from pooled 5 to 10 DPA siliques of Col-0 or 35S:3HA-UPL3 plants were electrophoresed on 4% to 20% SDS-PAGE gels and probed with anti-LEC2. Higher MW forms of LEC2 protein seen in the 35S:3HA-UPL3 sample are indicated by arrows. The bottom shows that both wild-type and mutant UPL3-3FLAG interact with LEC2-HA during transient co-expression in N. benthamiana leaves. wt, wild type; mut, mutant. (D) Purification of ubiquitylated forms of LEC2-HA from transiently expressed 35S:LEC2-HA and 35S:UPL3-3FLAG (wild type and mutant) vectors in N. benthamiana leaves. Protein samples were extracted and samples taken to assess protein expression levels using immunoblotting (loading panels). The remaining samples were split in two and ∼20 μg of FLAG-TR-TUBE was added to one set (lower loading panel). This fraction was purified on FLAG-MA beads and the other purified using HA-MA beads. Affinity-purified proteins were subjected to immunoblotting using anti-HA-HRP antibodies. The bottom right was exposed for longer than the bottom left. The red arrow indicates the position of LEC2-HA protein. Higher MW forms of LEC2-HA detected in the FLAG TR-TUBE pull-down were dependent on the activity of UPL3-3FLAG. wt, wild type; mut, mutant.
Figure 5.
Figure 5.
Variation in BnaUPL3.C03 Promoter Activities from High- and Low-SWPP B. napus Accessions Is Sufficient To Generate Variation in Final Seed Yield. (A) The diagram shows fusions of 2-kb BnaUPL3.C03 promoter and 5′UTR regions from the B. napus lines Dimension (DIM; High SWPP) and Coriander (COR; Low SWPP) to the Luciferase coding sequence. The diagrams are not to scale. (B) Differential expression of the Luciferase reporter gene by the DIM and COR promoter and 5′UTR region. The Dimension (DIM) and Coriander (COR) promoters described in (A) fused to a fLUC reporter gene were transfected into Arabidopsis upl3-4 mutant protoplasts. The activities of each promoter are shown relative to co-expressed 35S:Renilla luciferase. Data are given as means ± se, n = 3. P values were determined by Student’s t test. (C) Differential expression of the Arabidopsis UPL3 coding region by the Coriander (COR) and Dimension (DIM) promoter and 5′UTR regions. BnaUPL3.C03 promoter and 5′UTR regions from the B. napus lines DIM and COR were used to express the coding region of Arabidopsis UPL3 fused to 3HA at its amino-terminus in upl3-4 mutant Arabidopsis. RT-qPCR of UPL3 expression in leaves of wild-type and transgenic Arabidopsis lines were measured and are shown relative to the AtEIF1ALPHA gene. Data are given as means ± se; n = at least three biological replicates of three independent transformants. P values were determined by Student’s t test. (D) The Coriander (COR) and Dimension (DIM) promoters show differential complementation of Arabidopsis upl3-4 seed size. Seed area was quantified in wild type, upl3-4 mutant, COR:3HA-AtUPL3, and DIM:3HA-AtUPL3 independent transgenic lines. Data shown are means ± se based on seed area measurements across at least 100 seeds per genotype and with at least three biological replicates of three independent transformants. P values were determined by Student’s t test. (Lower) Immunoblots show 3HA-UPL3 protein levels in 10 to 15 DPA seeds and tubulin levels for comparison.
Figure 6.
Figure 6.
Relationships between BnaUPL3.C03 Expression Levels in High- and Low-SWPP B. napus Accessions to Seed Size, Seed LEC2 Protein Levels, and Seed Lipid Content. (A) Comparison of BnaUPL3.C03 expression levels in 45-DPA seeds in B. napus Dimension (DIM) with high SWPP, and Coriander (COR) accessions with low SWPP, measured by RT-qPCR. Expression levels are relative to the BnaACTIN2 gene. Data are presented as means ± se; n = 3 for each genotype. P values were determined by Student’s t test. (B) Seed sizes in the low-expressing BnaUPL3.C03 Line Dimension and the high-expressing BnaUPL3.C03 Line Coriander. (C) Thousand seed weights of low-expressing BnaUPL3.C03 line Dimension and the high-expressing BnaUPL3.C03 line Coriander. Data are shown as means ± se. Seeds were weighed in batches of 100 seed and thousand seed weight calculated based on these values. n = 3 batches for each genotype assayed. P values were determined by Student’s t test. (D) LEC2 protein levels in 45-DPA seeds were detectable in three low BnaUPL3.C03 expressing lines, and undetectable in three high BnaUPL3.C03 expressing accessions (Supplemental Table 2). Immunoblots of seed protein extract were probed with anti-LEC2 (top) and with anti-tubulin (bottom) as a protein loading control. (E) Elevated expression of the LEC2-regulated gene BnaOLE1 in the low-expressing BnaUPL3.C03 (Dimension) line. BnaOLE1 expression was quantified by RT-qPCR in low-expressing BnaUPL3.C03 (Dimension) and high-expressing BnaUPL3.C03 (Coriander) accessions. Expression levels were relative to that of BnaACTIN2. n = 3 for each genotype. Primers were designed to measure expression of both BnaC01g17050D and BnaA01g14480D BnaOLE1. P values were determined by Student’s t test. (F) Increased seed lipid content in the low-expressing BnaUPL3.C03 (Dimension) line. Lipid content of mature seeds of low-expressing BnaUPL3.C03 (Dimension) and high-expressing BnaUPL3.C03 (Coriander) accessions. P values were determined by Student’s t test.
Figure 7.
Figure 7.
Selection for Low BnaUPL3.C03 Expression Levels Has Not Yet Been Exploited in Elite Breeding Lines. BnaUPL3.C03 expression levels in 45-DPA seeds of seven current elite commercial cultivars of oilseed rape were measured using RT-qPCR and compared with expression levels of BnaUPL3.C03 from GWAS accessions Samurai and Licrown × Express, which exhibit high and low BnaUPL3.C03 expression levels, and low and high SWPP phenotypes, respectively. BnaACTIN2 expression was used for comparison using RT-qPCR control. Data are presented as means ± se; n = 3 for each genotype. P values estimated by Student’s t test show the significance of BnaUPL3.C03 expression levels as compared with the low-expressing accession Licrown × Express.

Comment in

References

    1. Andrianov V., Borisjuk N., Pogrebnyak N., Brinker A., Dixon J., Spitsin S., Flynn J., Matyszczuk P., Andryszak K., Laurelli M., Golovkin M., Koprowski H. (2010). Tobacco as a production platform for biofuel: Overexpression of Arabidopsis DGAT and LEC2 genes increases accumulation and shifts the composition of lipids in green biomass. Plant Biotechnol. J. 8: 277–287. - PubMed
    1. Badouin H., et al. (2017). The sunflower genome provides insights into oil metabolism, flowering and Asterid evolution. Nature 546: 148–152. - PubMed
    1. Bai X., Huang Y., Hu Y., Liu H., Zhang B., Smaczniak C., Hu G., Han Z., Xing Y. (2017). Duplication of an upstream silencer of FZP increases grain yield in rice. Nat. Plants 3: 885–893. - PubMed
    1. Barthole G., To A., Marchive C., Brunaud V., Soubigou-Taconnat L., Berger N., Dubreucq B., Lepiniec L., Baud S. (2014). MYB118 represses endosperm maturation in seeds of Arabidopsis. Plant Cell 26: 3519–3537. - PMC - PubMed
    1. Baud S., et al. (2016). Deciphering the molecular mechanisms underpinning the transcriptional control of gene expression by master transcriptional regulators in Arabidopsis seed. Plant Physiol. 171: 1099–1112. - PMC - PubMed

Publication types

MeSH terms

LinkOut - more resources