. 2019 Aug 22;10(1):3778.
doi: 10.1038/s41467-019-11378-4.

The Eleanor ncRNAs activate the topological domain of the ESR1 locus to balance against apoptosis

Affiliations

The Eleanor ncRNAs activate the topological domain of the ESR1 locus to balance against apoptosis

Mohamed Osama Ali Abdalla et al. Nat Commun. .

Abstract

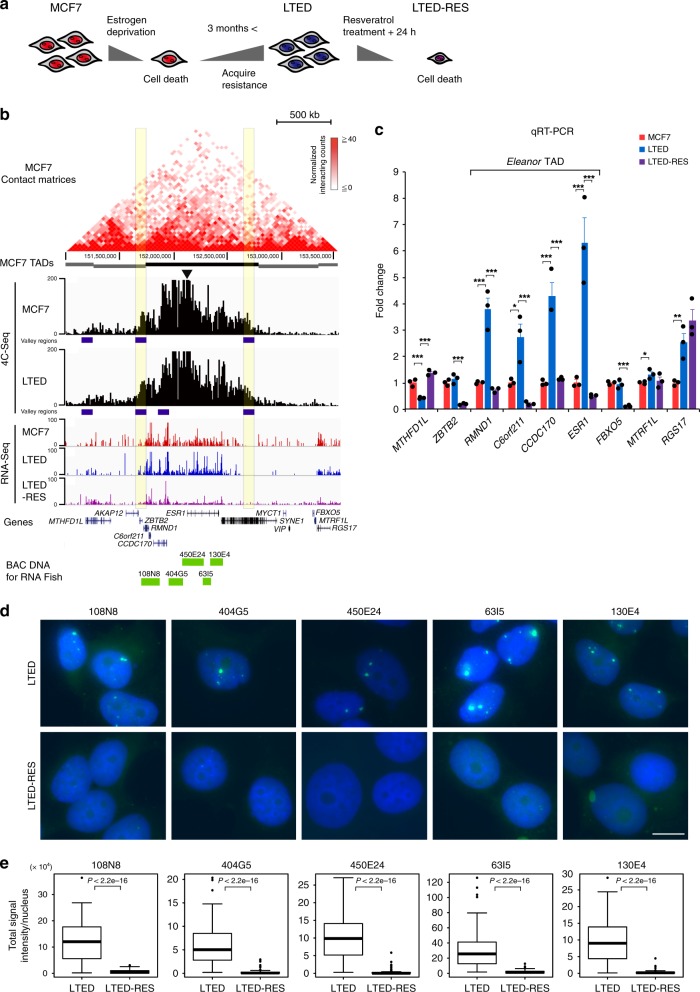
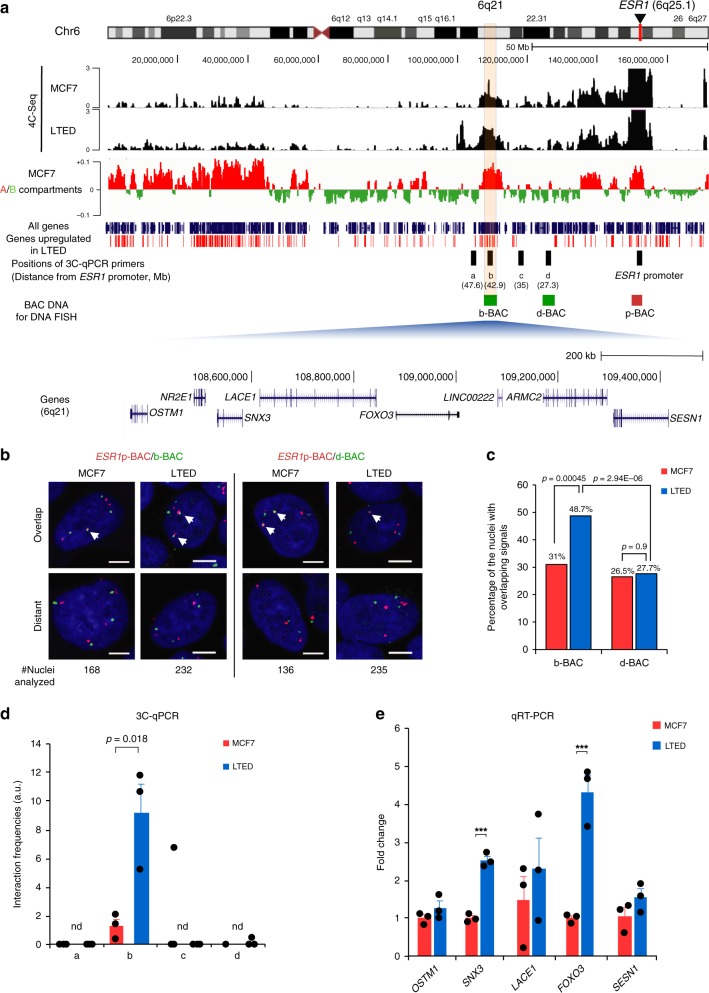
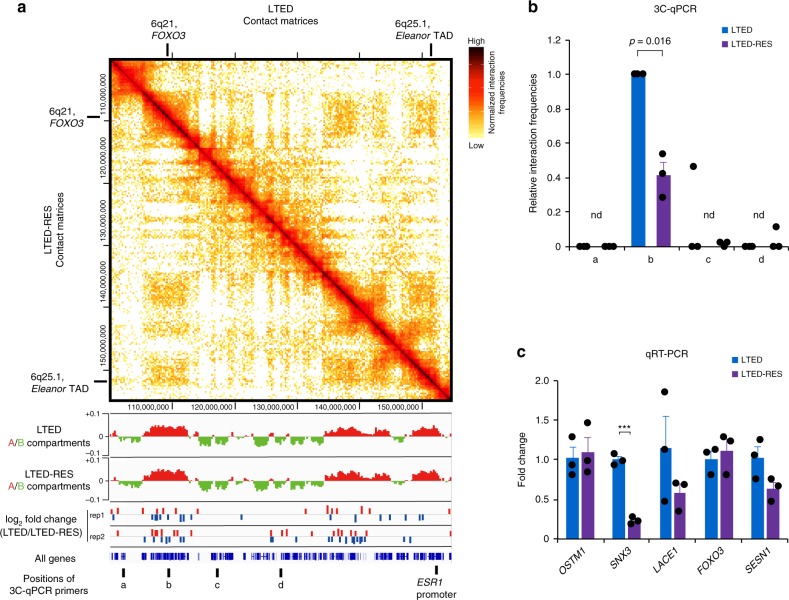
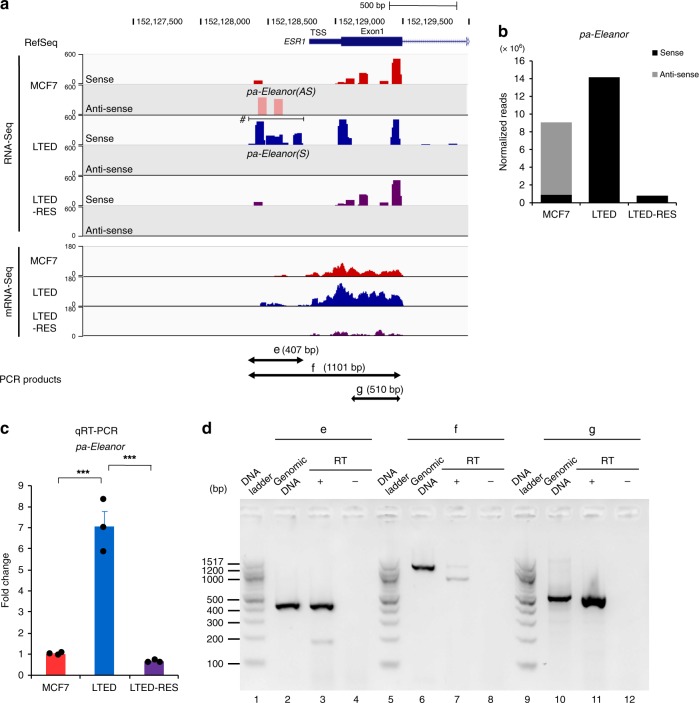
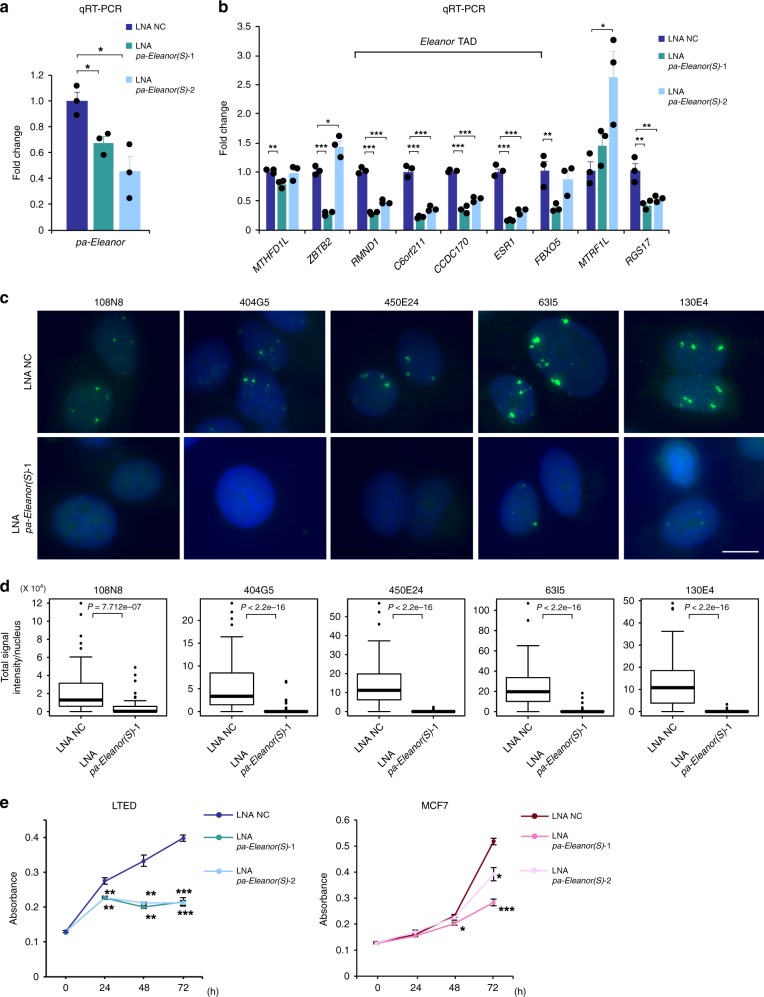
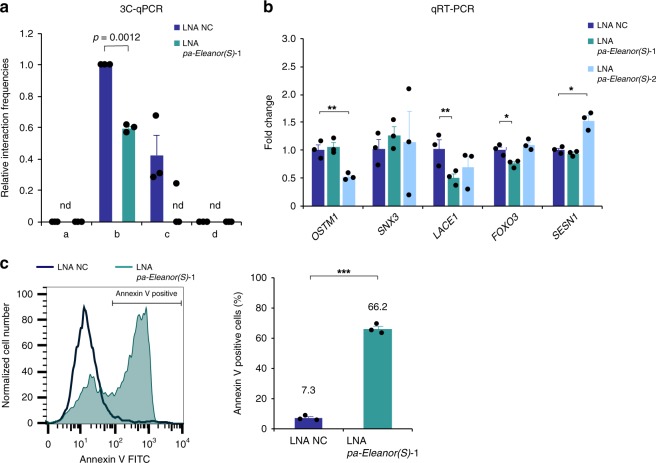
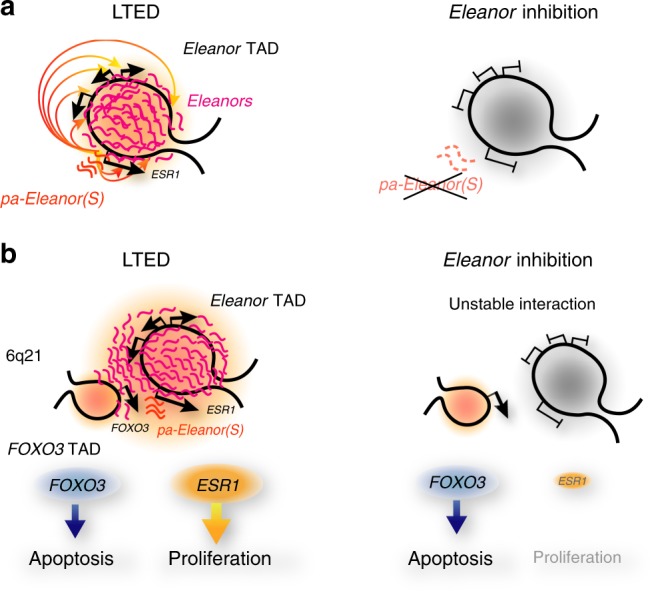
MCF7 cells acquire estrogen-independent proliferation after long-term estrogen deprivation (LTED), which recapitulates endocrine therapy resistance. LTED cells can become primed for apoptosis, but the underlying mechanism is largely unknown. We previously reported that Eleanor non-coding RNAs (ncRNAs) upregulate the ESR1 gene in LTED cells. Here, we show that Eleanors delineate the topologically associating domain (TAD) of the ESR1 locus in the active nuclear compartment of LTED cells. The TAD interacts with another transcriptionally active TAD, which is 42.9 Mb away from ESR1 and contains a gene encoding the apoptotic transcription factor FOXO3. Inhibition of a promoter-associated Eleanor suppresses all genes inside the Eleanor TAD and the long-range interaction between the two TADs, but keeps FOXO3 active to facilitate apoptosis in LTED cells. These data indicate a role of ncRNAs in chromatin domain regulation, which may underlie the apoptosis-prone nature of therapy-resistant breast cancer cells and could be good therapeutic targets.


Conflict of interest statement

The authors declare no competing interests.

Figures

Fig. 1
Fig. 1
Eleanor topologically associating domain (TAD) corresponds to the Eleanor-expressing chromatin domain. a Cells used in this study: MCF7, long-term estrogen deprivation (LTED), and LTED-RES cells. MCF7 cells were cultured in estrogen-deprived medium for >3 months to establish LTED cells, which was then treated with 100 μM resveratrol for 24 h (LTED-RES cells). Cell death occurs early during estrogen deprivation and after resveratrol treatment. b Alignment of TADs and 4C-Seq (chromosome conformation capture combined with high-throughput sequencing) profiles in the region, including the ESR1 gene on human chromosome 6 (6q25.1). Top: Hi-C contact matrix and predicted TAD positions (gray and black bars). Middle: 4C-Seq (this study) and RNA-Seq profiles of the indicated cells. The arrowhead indicates the position of the 4 C bait, and the dark blue bars indicate the valley regions of the 4C peaks (Supplementary Fig. 2a). Bottom: positions of RefSeq genes and BAC clones (green bars) used as probes for RNA fluorescence in situ hybridization (FISH) in this study. The black bar TAD with yellow highlights delineates the position of the Eleanor TAD. c Quantitative reverse transcription polymerase chain reaction analysis for the expression levels of genes inside and outside the Eleanor TAD. Genes inside the Eleanor TAD were cooperatively activated in LTED cells and were downregulated by resveratrol treatment (LTED-RES). The value of MCF7 expression level was set to 1. Data are representative of three independent experiments (mean ± s.e.m.). P values were calculated using unpaired, two-tailed, Student’s t test (*P < 0.05, **P < 0.01, ***P < 0.001). d RNA FISH analysis along the Eleanor TAD. BAC clones used as probes are indicated above each panel. Eleanor RNA foci were diminished with resveratrol treatment (LTED-RES). Scale bar, 10 µm. e Quantification of RNA FISH. n = 50–100 nuclei per sample. Boxplots shown are center line, median; box limits, upper and lower quartiles; whiskers, 1.5× interquartile range; points, outliers. P values were calculated using two-tailed, Mann–Whitney U test
Fig. 2
Fig. 2
4C-Seq (chromosome conformation capture combined with high-throughput sequencing) analysis revealed a long-range interaction between ESR1 and FOXO3 genes in long-term estrogen deprivation (LTED) cells. a Alignment of 4C-Seq and A/B compartment profiles along the entirety of human chromosome 6 (UCSC genome browser, hg19 assembly). Top: 4C-Seq data showing intra-chromosomal interactions with the ESR1 promoter used as bait (arrowhead). Middle: Distribution of A (red) and B (green) compartments in MCF7 cells. Note the positive correlation relationship between black peaks from 4C-Seq and red peaks representing A compartments. Bottom: distribution of all genes (blue) and genes upregulated in LTED cells (red). Thick blue bars represent the positions of 3C-qPCR (chromosome conformation capture–quantitative polymerase chain reaction) primers (a–d and the ESR1 promoter) used in this study. Green and red bars represent BAC DNA used as DNA fluorescence in situ hybridization (FISH) probes in b, c. Bottom: RefSeq genes at the b site. It should be noted that the 4C-Seq profiles showed interaction peaks between b site at 6q21 and the ESR1 promoter (bait for 4C). b Representative DNA FISH images of the ESR1 locus (red, using ESR1p-BAC probe) and b and d sites (green, using b-BAC and d-BAC probes, respectively). The position of each probe is shown in a (green and red bars). Scale bar, 5 µm. c Quantification of the DNA FISH analysis in b. Nuclei with overlapping signals at the ESR1-b site or ESR1-d site were measured. The frequencies of interaction between the ESR1 and b site increased in LTED cells. P values were calculated using two-tailed Fisher’s exact test. d 3Cq-PCR analysis shows interaction frequencies between the ESR1 promoter and a–d sites in MCF7 and LTED cells. Positions of sites a–d are shown in a (blue bars). e Relative expression levels of genes at 6q21 in MCF7 and LTED cells. The MCF7 expression level was set to 1. Data presented in d, e are representative of three independent experiments (mean ± s.e.m.). P values were calculated using unpaired, two-tailed, Student’s t test (***P < 0.001, n.d. = not detected in at least one experiment)
Fig. 3
Fig. 3
Resveratrol treatment reduced the interaction between ESR1 and FOXO3 but maintained the FOXO3 gene activity. a The resveratrol treatment affected the interaction between the Eleanor topologically associating domain and other A compartments. Top: Contact matrices from Hi-C, binned at 250-kb resolution. The normalized interaction frequencies of long-term estrogen deprivation (LTED) and LTED-RES cells are shown above and below the diagonal line, respectively. Middle: A/B compartments and fold changes in the contact frequencies. Positions of gained (red) and reduced (blue) contacts with the ESR1 promoter are shown. Bottom: Positions of all genes and 3C-qPCR (chromosome conformation capture–quantitative polymerase chain reaction) primers, as in Fig. 2a. b 3C-qPCR shows the relative interaction frequencies of the b site decreased by resveratrol treatment. c Relative expression levels of genes at 6q21 in LTED and LTED-RES cells. The LTED expression level was set to 1. Data presented in b, c are representative of three independent experiments (mean ± s.e.m.). P values were calculated using unpaired, two-tailed, Student’s t test (***P < 0.001, n.d. = not detected in at least one experiment)
Fig. 4
Fig. 4
The ESR1 promoter is transcribed differentially in MCF7 and long-term estrogen deprivation (LTED) cells. a Alignment of RNA-Seq and mRNA-Seq of the human ESR1 promoter-proximal region in the indicated cells. Peaks in RNA-Seq indicate transcripts with sense (dark colors) and antisense (pale colors) orientation relative to the ESR1 gene. In MCF7 cells, antisense transcription was detected at the transcription start site (TSS), which then switched to opposite direction to produce pa-Eleanor(S) (denoted by the horizontal bar with hash (#)) in LTED cells. Positions of the PCR products (e–g) in d are shown at the bottom. b Number of sequencing reads mapped at the TSS of the ESR1 gene. Numbers corresponding to sense and antisense RNA were counted and normalized according to the total number of mapped reads. c Expression levels of pa-Eleanor in the indicated cells determined with quantitative reverse transcription polymerase chain reaction (qRT-PCR). Values in MCF7 cells were set to 1. Data are representative of three independent experiments (mean ± s.e.m.). P values were calculated using unpaired, two-tailed, Student’s t test (***P < 0.001). d Local expression of pa-Eleanor(S) at site e in LTED cells. RT-PCR to amplify predicted transcripts as shown in a (e–g) resulted in successful detection of the e-fragment (pa-Eleanor, lane 3) and g-fragment (exon1 of ESR1, lane 11) by electrophoresis but not the f-fragment (lane 7). These results indicate that pa-Eleanor(S) is not contiguous with the ESR1 mRNA. All primers and amplification conditions were validated with PCR in parallel with genomic DNA as a template and RT-PCR with and without reverse transcription (RT+ and −)
Fig. 5
Fig. 5
pa-Eleanor(S) plays a role in Eleanor topologically associating domain (TAD) formation and long-term estrogen deprivation (LTED) cell proliferation. a Quantitative reverse transcription polymerase chain reaction showed that pa-Eleanor(S) was knocked down with Antisense LNA GapmeR (LNA) in LTED cells. b Expression levels of genes in Eleanor TAD decreased upon pa-Eleanor(S) knockdown in LTED cells. Values of LNA for the negative control (LNA NC) were set to 1. c RNA fluorescence in situ hybridization (FISH) scanning analysis along the Eleanor TAD, with pa-Eleanor(S) knockdown in LTED cells. BAC clones used as FISH probes are indicated on the panels. The genomic positions covered by the BAC clones are shown in Fig. 1b (green bars). Nuclear Eleanor RNA foci were diminished with pa-Eleanor(S) knockdown. Scale bar, 10 µm. d Quantitative analysis of RNA FISH in c. Total signal intensities per nucleus in LTED cells were measured (n > 40 nuclei per sample). Boxplots shown are center line, median; box limits, upper and lower quartiles; whiskers, 1.5× interquartile range; points, outliers. P values were calculated using two-tailed, Mann–Whitney U test. e Inhibition of LTED cell proliferation due to pa-Eleanor(S) knockdown. Time course analysis was performed after treatment of LTED (left) and MCF7 (right) cells with LNA. Data presented in a, b, e are representative of three independent experiments (mean ± s.e.m.). P values were calculated using unpaired, two-tailed, Student’s t test (*P < 0.05, **P < 0.01, ***P < 0.001)
Fig. 6
Fig. 6
Knockdown of pa-Eleanor(S) suppressed the long-range chromatin interaction without reducing FOXO3 gene activity and induced apoptosis in long-term estrogen deprivation (LTED) cells. a 3C-qPCR (chromosome conformation capture–quantitative polymerase chain reaction) analysis shows that pa-Eleanor(S) knockdown reduced interaction between ESR1 and b sites at 6q21 in LTED cells. Interaction frequencies were measured between the ESR1 promoter and indicated positions (a–d; thick blue bars in Fig. 2a). b Expression levels of genes around the Eleanor topologically associating domain with pa-Eleanor(S) knockdown in LTED cells. Quantitative reverse transcription polymerase chain reaction values of cells treated with Antisense LNA GapmeR for the negative control were set to 1. c Fluorescence-activated cell sorting (FACS) analysis of Annexin V-stained cells shows that knockdown of pa-Eleanor(S) increased apoptosis in LTED cells. A representative FACS profile is on the left. Quantification of the FACS analysis is on the right. Data presented in ac are representative of three independent experiments (mean ± s.e.m.). P values were calculated using unpaired, two-tailed, Student’s t test (*P < 0.05, **P < 0.01, ***P < 0.001, n.d. = not detected in at least one experiment)
Fig. 7
Fig. 7
Proposed model of Eleanor functions in long-term estrogen deprivation (LTED) cells. Eleanors play roles in activating genes within the Eleanor topologically associating domain (TAD) (a) and in mediating the long-range chromatin interaction (b). a In LTED cells, pa-Eleanor(S) activates the transcription of Eleanors and RNA cloud formation, thus activating the genes in the Eleanor TAD, including ESR1 (left). Eleanor inhibition represses the Eleanor TAD (right). b In LTED cells, the gene for proliferation (ESR1) and the gene for apoptosis (FOXO3) are in close proximity, as both are active in the A compartment. Upon inhibition of Eleanors by resveratrol or pa-Eleanor(S) knockdown, the long-range chromatin interaction decreased and the ESR1 gene was repressed, but the FOXO3 gene activity was maintained at a high level. These suggest a mechanism underlying the apoptosis-prone nature of LTED cells

References

    1. Ali S, Coombes RC. Endocrine-responsive breast cancer and strategies for combating resistance. Nat. Rev. Cancer. 2002;2:101–112. doi: 10.1038/nrc721. - DOI - PubMed
    1. Yager JD, Davidson NE. Estrogen carcinogenesis in breast cancer. N. Engl. J. Med. 2006;354:270–282. doi: 10.1056/NEJMra050776. - DOI - PubMed
    1. Musgrove EA, Sutherland RL. Biological determinants of endocrine resistance in breast cancer. Nat. Rev. Cancer. 2009;9:631–643. doi: 10.1038/nrc2713. - DOI - PubMed
    1. Jeng MH, et al. Estrogen receptor expression and function in long-term estrogen-deprived human breast cancer cells. Endocrinology. 1998;139:4164–4174. doi: 10.1210/endo.139.10.6229. - DOI - PubMed
    1. Katzenellenbogen BS, Kendra KL, Norman MJ, Berthois Y. Proliferation, hormonal responsiveness, and estrogen receptor content of MCF-7 human breast cancer cells grown in the short-term and long-term absence of estrogens. Cancer Res. 1987;47:4355–4360. - PubMed

Publication types

MeSH terms