. 2019 Aug 22;9(1):12286.
doi: 10.1038/s41598-019-48663-7.

Immunoevolution of mouse pancreatic organoid isografts from preinvasive to metastatic disease

Affiliations

Immunoevolution of mouse pancreatic organoid isografts from preinvasive to metastatic disease

Dea Filippini et al. Sci Rep. .

Abstract

Pancreatic ductal adenocarcinoma (PDA) has a highly immunosuppressive microenvironment, which is contributed by the complex interaction between cancer cells and a heterogeneous population of stromal cells. Therefore, facile and trackable models are needed for integrative and dynamic interrogation of cancer-stroma interaction. Here, we tracked the immunoevolution of PDA in a genetically-defined transplantable model of mouse pancreatic tumour organoids that recapitulates the progression of the disease from early preinvasive lesions to metastatic carcinomas. We demonstrated that organoid-derived isografts (ODI) can be used as a biological source of biomarkers (NT5E, TGFB1, FN1, and ITGA5) of aggressive molecular subtypes of human PDA. In ODI, infiltration from leukocytes is an early event during progression of the disease as observed for autochthonous models. Neoplastic progression was associated to accumulation of Maf+ macrophages, which inversely correlated with CD8+ T cells infiltration. Consistently, levels of MAF were enriched in human PDA subtypes characterized by abundance of macrophage-related transcripts and indicated poor patients' survival. Density of MAF+ macrophages was higher in human PDA tissues compared to preinvasive lesions. Our results suggest that ODIs represent a suitable system for genotypic-immunophenotypic studies and support the hypothesis of MAF+ macrophages as a prominent immunosuppressive population in PDA.


Conflict of interest statement

The authors declare no competing interests.

Figures

Figure 1
Figure 1
Histopathological evolution of tumour organoid isografts. (a) The growth of tumour organoid isografts was monitored by high-contrast ultrasonography (top); tumours are outlined in red. Representative hematoxylin & eosin staining (middle) of tissues from a preinvasive lesion, a moderately differentiated tumour (classical), and a poorly differentiated carcinoma (PDC) obtained at 1, 3, and 5 months, respectively, from orthotopic transplantation of B6-K1 mouse organoids. Scale bars, 100 µm unless otherwise indicated. Magnification of selected areas (dashed lines) is provided in the insets. Preinvasive lesions presented an intense desmoplastic reaction compared to moderately and poorly differentiated tumours by Masson’s trichrome staining (bottom). Scale bars, 100 µm unless otherwise indicated. (b) Bar graph showing the number and type of lesions observed in the pancreas of immunocompetent mice at different times from transplantation (m, months). (c) Representative metastatic growths at the liver (left) and at the lungs (right) from a mouse bearing a poorly differentiated carcinoma (B6-K2 organoid, 3 months from transplantation). The dashed lines indicate the areas shown in the insets. Scale bar, 700 µm; insets, 100 µm. (d) Targeted sequencing of preinvasive (n = 3), classical tumours (n = 3), and poorly differentiated carcinomas (n = 3) derived from mouse B6-Ks orthotopic transplants. The status of the 4 more commonly mutated PDA genes is shown with colour key providing information on type of alteration. LOH, loss of heterozygosity. See also Supplementary Fig. S1.
Figure 2
Figure 2
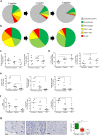
The composition of immune infiltrates in tumour organoid derived isografts. (a) Pie charts showing percentages of granulocytes (CD45+CD11b+Ly6G+), macrophages (CD45+CD11b+F4/80+), B cells (CD45+B220+), cytotoxic T cells (CD45+CD3+CD8+), and T helper lymphocytes (CD45+CD3+CD4+) in the pancreatic tissues from mice at 2 months (left), 4 months (middle) and 6 months (right) from organoid transplantation. “Unstained” denotes pancreatic epithelial cells and other stromal components. Colour key is provided. (b) Pie charts showing the immune cell populations defined in (a) as percentages of CD45+ cells. Colour key as in (a). (c) Flow cytometry analysis of the indicated CD45+ cell populations (granulocytes and macrophages) in the pancreas of preinvasive, classical tumours, or PDC from (a). (d) Flow cytometry analysis of the indicated immune cell populations (granulocytes and macrophages) in the pancreas of preinvasive, classical tumours, or PDC from (b). (e) Flow cytometry analysis of the indicated CD45+ cell populations (T cells) in the pancreas of preinvasive, classical tumours, or PDC from (a). (f) Flow cytometry analysis of the indicated immune cell populations (T cells) in the pancreas of preinvasive, classical tumours, or PDC from (b). Each dot in the graphics (cf) refers to the individual tumour samples available for cytometric evaluation. ODIs from B6-K1, B6-K2, and B6-K3 organoids are identified by circles, triangles, and squares, respectively. (g) Immunohistochemical staining for CD8 in tissue from mice bearing preinvasive lesions (B6-K2, left), classical tumours (B6-K2, middle) or poorly differentiated tumours (B6-K3, right). Scale bars, 50 µm. Quantification is provided on the left as the average number of CD8 positive cells per mm2 in preinvasive (n = 6), classical (n = 10), and poorly differentiated (PDC, n = 8) tumours. From 3 to 5 individual areas per case were examined. Statistical associations were determined by Student’s t-test. *p < 0.05; **p < 0.01; ***p < 0.001. See also Supplementary Fig. 2 for details.
Figure 3
Figure 3
Disease progression of organoid-derived isografts is associated with gene expression changes indicative of an immunosuppressive microenvironment. (a) Multiplex bead-based mouse cytokine assay for serum detection of circulating factors in mice bearing preinvasive lesions (n = 5), classical tumours (n = 6) and poorly differentiated tumours (PDC, n = 5). Mean and SEM in pg/mL are shown. See also Supplementary Fig. 3. (b) Volcano plots of differences in gene expression (NanoString platform) between classical tumours (n = 3) and preinvasive lesions (n = 3). Indicated are the genes with Log2 fold change in expression ≥ 1.5 and adjusted p < 0.05. (c) Volcano plots of differences in gene expression (NanoString platform) between poorly differentiated tumours (n = 3) and preinvasive lesions (n = 3). Indicated are the genes with Log2 fold change in expression ≥ 2 and adjusted p < 0.05. (d) Volcano plots of differences in gene expression (NanoString platform) between poorly differentiated (n = 3) and classical (n = 3) tumours. Indicated are the genes with Log2 fold change in expression ≥ 2 and adjusted p < 0.05. In (b,c, and d), red arrows indicate genes that are discussed in the text. (e,f) Box plot showing the NT5E Z-score score stratified by Bailey (e) or Moffitt subtypes (f) in the ICGC cohort. ****p ≪ 0.001; ***p < 0.001; *p < 0.05 as determined by Wilcoxon rank-sum test. (g) Kaplan–Meier analysis comparing survival of patients in the ICGC cohort having either high or low expression of NT5E. p, Log-rank (Mantel-Cox) test. (h,i) Box plot showing the C7 Z-score score stratified by Bailey (h) or Moffitt subtypes (i) in the ICGC-PDA cohort. ****p ≪ 0.001; *p < 0.01 as determined by Wilcoxon rank-sum test. (j) Kaplan–Meier analysis comparing survival of patients in the ICGC cohort having either high or low expression of C7. p, Log-rank (Mantel-Cox) test. See also Supplementary Figs 5 and 6.
Figure 4
Figure 4
MAF positive macrophages accumulate during progression of ODI. (a,b) Box plots of signature scores in organoid derived isografts stratified according to the stage of disease. p values, Wilcoxon rank-sum test. Please refer to Supplementary Table 4 for details on genes used to define the specific gene signatures. (c) Immunohistochemical staining for Maf in tissues from mice bearing preinvasive lesions (left), classical tumours (middle), or poorly differentiated tumours (right). All tissues derive from B6-K3 organoid transplants. Scale bars, 100 µm. Quantification is provided in (d) as the average number of Maf positive nuclei per mm2 in preinvasive (n = 6), classical tumours (n = 10), and PDC (n = 7). From 3 to 5 individual areas per case were examined. Statistical associations were determined by Student’s t-test. *p < 0.05; ***p < 0.001. (e) Correlation between number of MAF positive and CD8 positive cells in mouse tumours considering all stages of disease (a total of 40 individual areas of 1 mm2 were considered) (Spearman r = −0.50, p = 0.010). Shown is the curve of linear fit correlation. (f) Immunofluorescence analysis for MAF (red) and CD8 (green), in mouse classical tumour tissues indicated as red or green circles in (e). Nuclei were counterstained with DAPI (blue). Scale bar, 20 µm. TREG, regulatory T cells; CTLs. Cytotoxic T lymphocytes; M2, anti-inflammatory macrophages; AP, antigen presentation; DC, dendritic cells; gMDSC, granulocytic-myeloid derived suppressor cells.
Figure 5
Figure 5
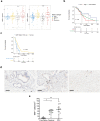
MAF is overexpressed in the aggressive subtype of PDA. (a) Box plot showing the MAF Z-score score stratified by Bailey subtypes in the ICGC-(left) and TCGA (right) cohorts. ***p < 0.001; **p < 0.01; *p < 0.05 as determined by Wilcoxon rank-sum test. (b) Kaplan–Meier analysis comparing survival of patients in the ICGC cohort having high, intermediate or low expression of MAF. p, Log-rank (Mantel-Cox) test. (c) The association between the CTL level and overall patient survival for PDA tumours with different MAF levels. For each tumour in the TCGA, the infiltration of cytotoxic T lymphocytes or Tumour-infiltrating lymphocytes (TILs) was estimated as the average expression level of GZMB, GZMA, PRF1, and CD8A. Kaplan–Meier analysis compares the survival of patients with low TILs and high expression. p, Log-rank (Mantel-Cox) test. (d) Immunohistochemical staining for MAF in human tissues distinguished in preinvasive lesions (left), classical tumours (middle), or poorly differentiated tumours (right). Scale bars, 100 µm. Quantification is provided in (e) as the average number of MAF positive nuclei per mm2 in preinvasive (n = 6), classical tumours (n = 11), and poorly differentiated carcinomas (PDC, n = 11). From 5 to 6 individual areas were examined per case. Statistical associations were determined by Student’s t-test. *p < 0.05; **p < 0.01.

References

    1. Ryan DP, Hong TS, Bardeesy N. Pancreatic adenocarcinoma. N Engl J Med. 2014;371:1039–1049. doi: 10.1056/NEJMra1404198. - DOI - PubMed
    1. Rahib L, et al. Projecting cancer incidence and deaths to 2030: the unexpected burden of thyroid, liver, and pancreas cancers in the United States. Cancer Res. 2014;74:2913–2921. doi: 10.1158/0008-5472.CAN-14-0155. - DOI - PubMed
    1. Larkin J, et al. Combined Nivolumab and Ipilimumab or Monotherapy in Untreated Melanoma. N Engl J Med. 2015;373:23–34. doi: 10.1056/NEJMoa1504030. - DOI - PMC - PubMed
    1. Topalian SL, et al. Safety, activity, and immune correlates of anti-PD-1 antibody in cancer. N Engl J Med. 2012;366:2443–2454. doi: 10.1056/NEJMoa1200690. - DOI - PMC - PubMed
    1. Sahin IH, Askan G, Hu ZI, O’Reilly EM. Immunotherapy in pancreatic ductal adenocarcinoma: an emerging entity? Ann Oncol. 2017;28:2950–2961. doi: 10.1093/annonc/mdx503. - DOI - PMC - PubMed

Publication types

MeSH terms

Substances