. 2019 Aug 22;9(1):12263.
doi: 10.1038/s41598-019-48701-4.

A biomimetic 3D model of hypoxia-driven cancer progression

Affiliations

A biomimetic 3D model of hypoxia-driven cancer progression

Chiara Liverani et al. Sci Rep. .

Abstract

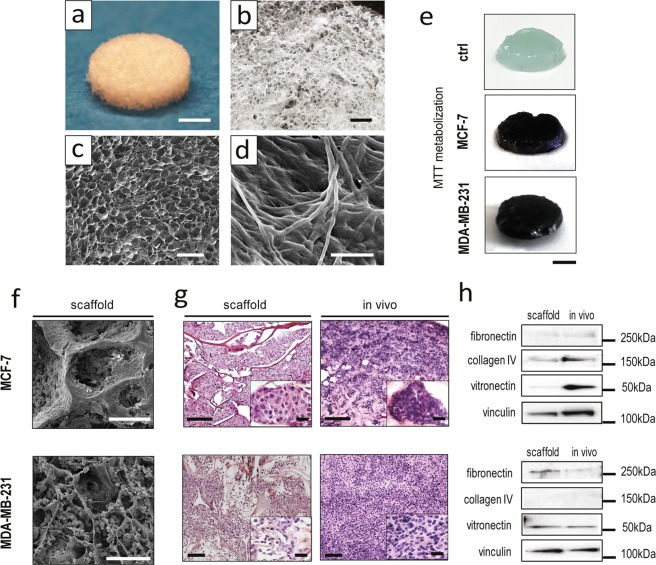
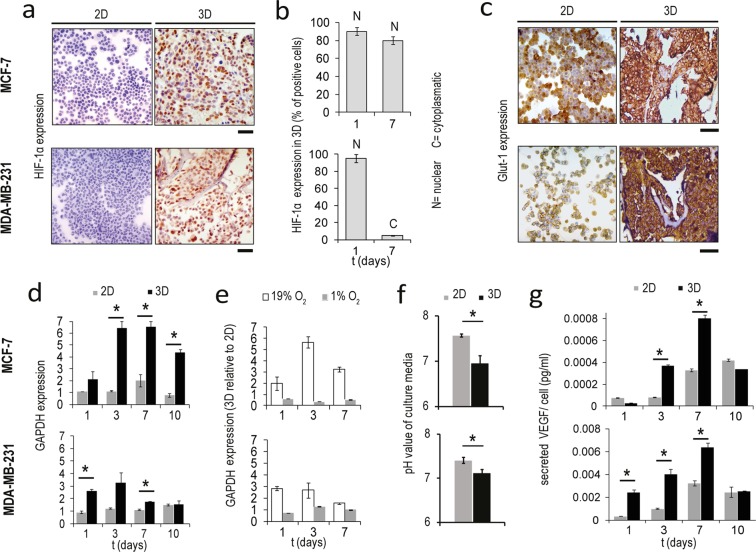
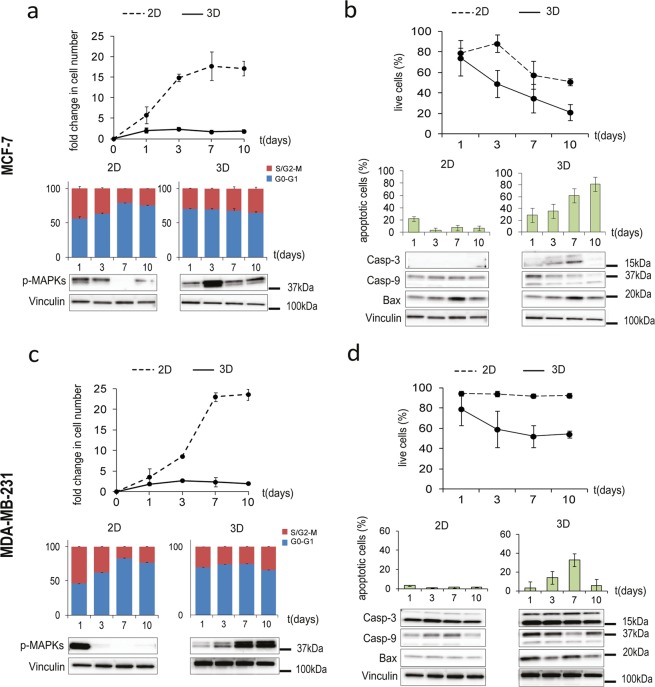
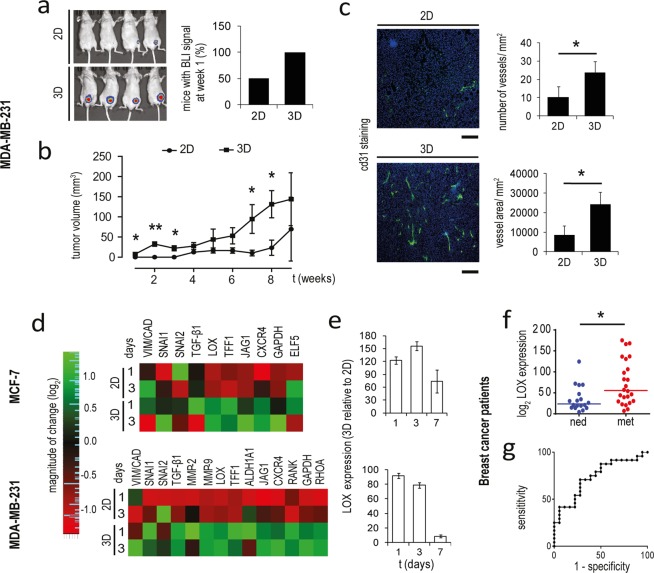
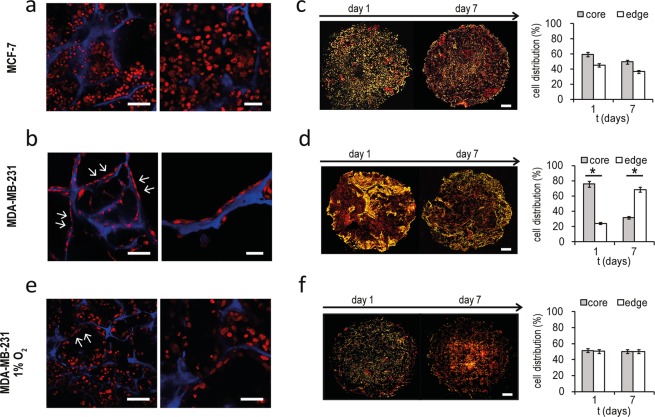
The fate of tumors depends both on the cancer cells' intrinsic characteristics and on the environmental conditions where the tumors reside and grow. Engineered in vitro models have led to significant advances in cancer research, allowing the investigation of cells in physiological environments and the study of disease mechanisms and processes with enhanced relevance. Here we present a biomimetic cancer model based on a collagen matrix synthesized through a biologically inspired process. We compared in this environment the responses of two breast tumor lineages characterized by different molecular patterns and opposite clinical behaviors: MCF-7 that belong to the luminal A subtype connected to an indolent course, and basal-like MDA-MB-231 connected to high-grade and aggressive disease. Cancer cells in the biomimetic matrix recreate a hypoxic environment that affects their growth dynamics and phenotypic features. Hypoxia induces apoptosis and the selection of aggressive cells that acquire expression signatures associated with glycolysis, angiogenesis, cell-matrix interaction, epithelial to mesenchymal transition and metastatic ability. In response to hypoxia MDA-MB-231 migrate on the collagen fibrils and undergo cellular senescence, while MCF-7 do not exhibit these behaviors. Our biomimetic model mimics the evolution of tumors with different grade of aggressiveness fostered by a hypoxic niche and provides a relevant technology to dissect the events involved in cancer progression.


Conflict of interest statement

The authors declare no competing interests.

Figures

Figure 1
Figure 1
Characterization of the 3D biomimetic cancer model. (a,b) Pictures of the collagen scaffold. For a, scale bar: 3 mm. For b, scale bar: 1 mm. (c) SEM micrograph showing the fibrous and porous surface of the scaffold, revealing its high porosity. Scale bar: 500 µm. (d) High magnification SEM micrograph showing the minute architecture of the scaffold, and type I collagen fibers displaying their typical d-bands. Scale bar: 20 µm. (e) MTT assay of MCF-7 and MDA-MB-231 cultured on the 3D scaffold, compared to an empty control scaffold (ctrl). Scale bars: 3 mm. (f) SEM micrographs of MCF-7 and MDA-MB-231 cultured on the scaffold on day 7. Scale bars: 100 µm. (g) Hematoxylin and eosin stained histological sections of MCF-7 and MDA-MB-231 cultured on the scaffold on day 7, compared to the corresponding in vivo tumors. Scale bars: 100 µm. For the insets, scale bars: 20 µm. (h) Western blot analysis of collagen IV (180 kDa), fibronectin (285 kDa), vitronectin (54 kDa) and vinculin (125 kDa) in the scaffold and in the corresponding in vivo tumors.
Figure 2
Figure 2
3D- cultured cancer cells show hypoxic and glycolytic characteristics. (a) HIF-1α expression in MCF-7 and MDA-MB-231 in monolayer culture (2D) and within the scaffold (3D) on day 1. Scale bars: 50 µm. (b) Percentage of MCF-7 and MDA-MB-231 positive to HIF-1α on days 1 and 7 in 3D culture. Data represent mean ± S.D. (n = 3). (c) Glut-1 expression in MCF-7 and MDA-MB-231 in monolayer culture and within the scaffold on day 1. Scale bars: 50 µm. (d) Relative expression levels of GAPDH in MCF-7 and MDA-MB-231 in monolayer culture and within the scaffold on days 1, 3, 7 and 10. Data represent mean ± S.D. (n = 3). *p < 0.05, two-tailed Student’s t-test. (e) Relative expression levels of GAPDH in MCF-7 and MDA-MB-231 in the scaffold versus monolayer culture on days 1, 3 and 7 in normoxic or hypoxic states (19% O2 or 1% O2 respectively). Data represent mean ± S.D. (n = 3). (f) Ph values of the culture media of MCF-7 and MDA-MB-231 in monolayer culture or within the 3D scaffold. Data represent mean ± S.D. (n = 3). *p < 0.05, two-tailed Student’s t-test. (g) Secreted VEGF levels normalized against cell number in the culture media of MCF-7 and MDA-MB-231 in monolayer culture or within the scaffold on days 1, 3, 7 and 10. Data represent mean ± S.D. (n = 3). *p < 0.05, two-tailed Student’s t-test.
Figure 3
Figure 3
Cancer cell growth dynamics in the 3D biomimetic model. (a,c) Fold changes in cell number (relative to day 0) for MCF-7 and MDA-MB-231 in monolayer culture (2D) or within the scaffold (3D) on days 1, 3,7 and 10; percentages of cells in S and G2/M phases or in G0/G1 phases; western blot for p-MAPK (44, 42 kDa). Data represent mean ± S.D. (n = 3). (b,d) Percentages of live cells for MCF-7 and MDA-MB-231 in monolayer culture (2D) or within the scaffold (3D) on days 1, 3,7 and 10; percentages of apoptotic cells; western blot for Caspase-3 (19, 17 kDa), Caspase-9 (37, 35 kDa) and Bax (20 kDa). Data represent mean ± S.D. (n = 3).
Figure 4
Figure 4
Cells cultured in the scaffold exhibit aggressive features. (a) Whole body IVIS imaging and percentage of mice with detectable tumors after 1 week from the orthotopic injection of MDA-MB-231 cultured in monolayer (2D) or in the scaffold (3D). (b) Tumor volume of mice with orthotopic injection of 2D and 3D cultured MDA-MB-231. Data represent mean ± S.E.M (n = 5) *p < 0.05. (c) Representative images of Cd31 stained histological sections, number of vessel for mm2, and vessel area for mm2 in xenograft tumors generated by orthotopic injection of 2D and 3D cultured MDA-MB-231. Cd31 positive cells (green) and nuclei stained with DAPI (blue). Scale bars: 300 µm. Data represent mean ± S.D. (n = 3). (d) Heatmap visualization of relative expression values of biomarkers related to tumor aggressiveness in MCF-7 and MDA-MB-231 in monolayer culture or within the scaffold. (e) Relative expression levels of LOX in MCF-7 and MDA-MB-231 within the scaffold versus monolayer cultures on days 1, 3 and 7. (f) Relative expression levels of LOX in breast cancer patients. *p < 0.01, two-sample Wilcoxon rank-sum test. (g) ROC curve of LOX accuracy as prognostic factor in patients with breast cancer.
Figure 5
Figure 5
MDA-MB-231 migrate at the scaffold edges over time. (a,b) Confocal microscopy images at different magnifications of MCF-7 and MDA-MB-231 within the scaffold on day 7. Cells are stained with DRAQ5 (red) and blue is the collagen scaffold autofluorescence. For the left panels, scale bars: 50 µm. For the right panels, scale bars: 20 µm. (c,d) Whole images of histological sections of scaffold cultured with MCF-7 and MDA-MB-231 on day 1 and 7, and percentages of cells in edge or core regions of the scaffold. Cells are stained with DAPI (yellow) and red is the collagen scaffold autofluorescence. Scale bars: 1 mm. Data represent mean ± S.E.M (n = 3). (e) Confocal microscopy images of MDA-MB-231 within the 3D scaffold on day 7 under hypoxic state (1% O2). Cells are stained with DRAQ5 (red) and blue is the collagen scaffold autofluorescence. For the left panel, scale bar: 50 µm. For the right panel, scale bar: 20 µm. (f) Whole images of histological sections of scaffold cultured with MDA-MB-231 on day 1 and 7 under hypoxic state, and percentages of cells in edge or core regions of the scaffold. Scale bars: 1 mm. Data represent mean ± S.E.M (n = 3). Cells are stained with DAPI (yellow) and red is the collagen scaffold autofluorescence.
Figure 6
Figure 6
Hypoxia induce senescence in MDA-MB-231. (a) Inverted fluorescent microscope images and mean cell area (µm2) of MCF-7 and MDA-MB-231 in monolayer cultures (2D) or recovered after 7 days in the scaffold (3D). Staining for F-actin (phallodin, green) and nuclei stained with DAPI (blue). Scale bars: 20 µm. (b) Bright field representative images of cells positive for β-galactosidase staining (blue) in MDA-MB-231 recovered after 7 days within the 3D scaffold at different magnification. (c) Inverted microscope images of MDA-MB-231 in monolayer cultures (2D) under hypoxic (1% O2) state; mean cell area of MDA-MB-231 in monolayer cultures under normoxic (19% O2) or hypoxic (1% O2) state. Scale bar: 20 µm. Staining for F-actin (phallodin, green) and nuclei stained with DAPI (blue). (d) Percentage of MDA-MB-231 with senescent phenotype and mean cell area after 7 days of hypoxic monolayer culture (2D 1% O2) or within the scaffold (3D). (e) Confocal microscopy images of MDA-MB-231 cultured within the scaffold on day 7 in normoxic or hypoxic states (19% O2 or 1% O2 respectively). Cells are stained with DRAQ5 (red) and blue is the collagen scaffold autofluorescence. Arrow indicate cells with enlarged dimension. Scale bars: 50 µm.

References

    1. Hanahan D, Weinberg RA. Hallmarks of cancer: the next generation. Cell. 2011;144:646–674. doi: 10.1016/j.cell.2011.02.013. - DOI - PubMed
    1. Lu P, Weaver VM, Werb Z. The extracellular matrix: a dynamic niche in cancer progression. J. Cell Biol. 2012;196:395–406. doi: 10.1083/jcb.201102147. - DOI - PMC - PubMed
    1. Bissell MJ, Radisky D. Putting tumours in context. Nat. Rev. Cancer. 2001;1:46–54. doi: 10.1038/35094059. - DOI - PMC - PubMed
    1. Dvorak HF, Weaver VM, Tlsty TD, Bergers G. Tumor microenvironment and progression. J. Surg. Oncol. 2011;103:468–474. doi: 10.1002/jso.21709. - DOI - PMC - PubMed
    1. Allen M, Jones JL. Jekyll and Hyde: the role of the microenvironment on the progression of cancer. J. Pathol. 2011;223:162–176. - PubMed