

Hypoxic Training in Obese Mice Improves Metabolic Disorder
- PMID: 31440207
- PMCID: PMC6694298
- DOI: 10.3389/fendo.2019.00527
Hypoxic Training in Obese Mice Improves Metabolic Disorder
Abstract
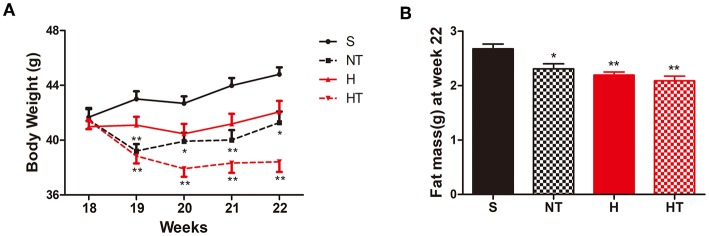
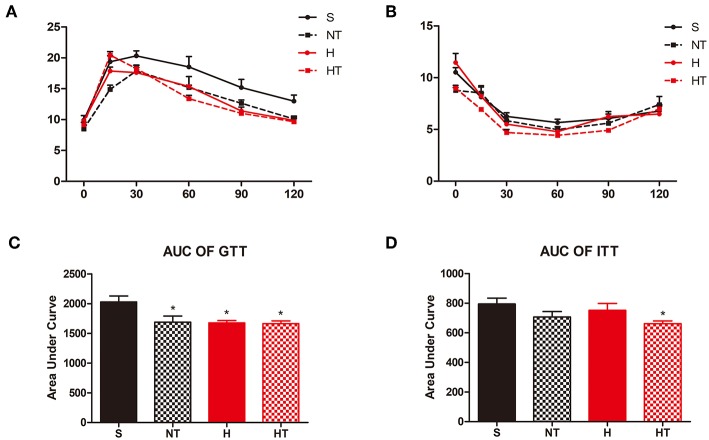
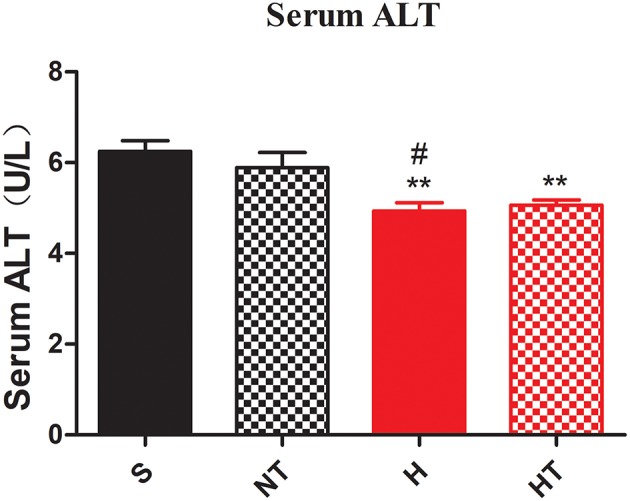
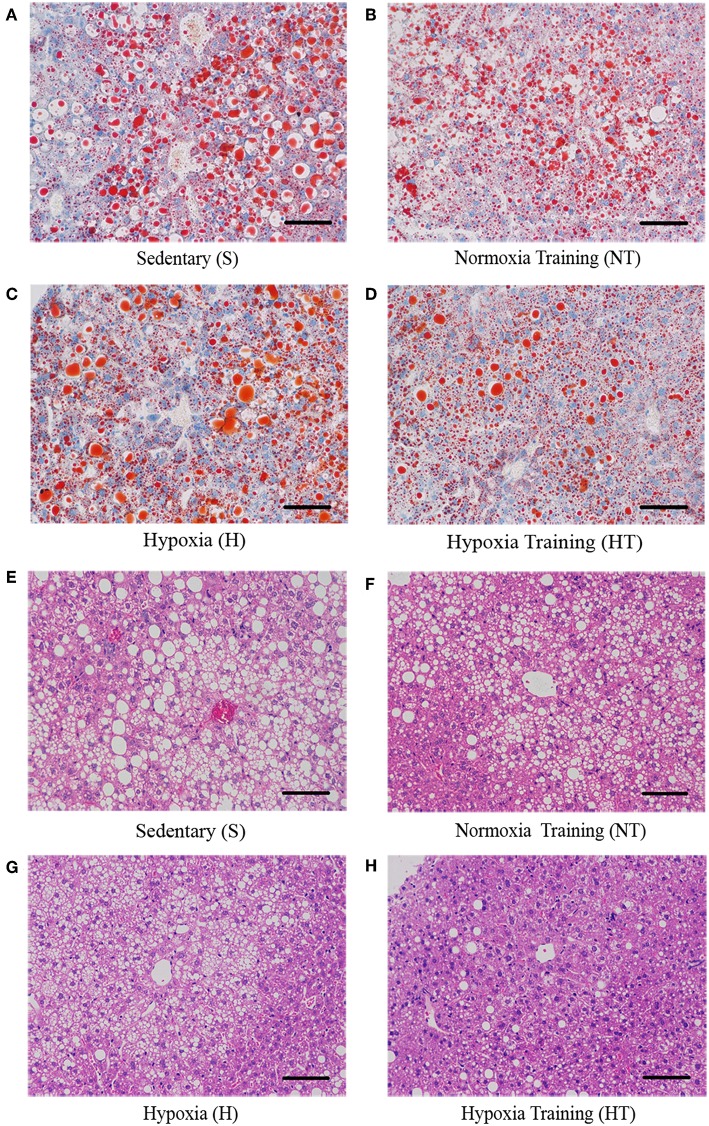
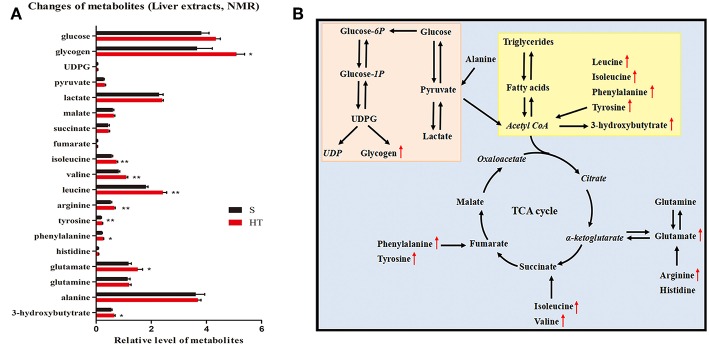
Hypoxic training has been reported to lower obesity morbidity without clear underlying mechanisms. This study investigates the effect of hypoxic training on metabolic changes, particularly, on liver metabolism of high fat diet (HFD)-induced obese mice. We compared the hypoxic training group with normoxic sedentary, normoxic training, and hypoxic sedentary groups. Body weight, fat mass, glucose tolerance and liver physiology were determined after 4 weeks intervention. In both normoxic training and hypoxic training groups, body weight was lower than the normoxic sedentary group, with less fat mass. Insulin sensitivity was improved after hypoxic training. Moreover, liver metabolomics revealed insights into the protective effect of hypoxic training on HFD-induced fatty liver. Taken together, these findings provide a molecular metabolic mechanism for hypoxic training.
Keywords: hypoxic training; liver; metabolism; metabolomics; obesity.
Figures
Similar articles
-
Exercise without dietary changes alleviates nonalcoholic fatty liver disease without weight loss benefits.Lipids Health Dis. 2018 Sep 1;17(1):207. doi: 10.1186/s12944-018-0852-z. Lipids Health Dis. 2018. PMID: 30172252 Free PMC article.
-
Effects of hypoxic living and training on gene expression in an obese rat model.Med Sci Sports Exerc. 2012 Jun;44(6):1013-20. doi: 10.1249/MSS.0b013e3182442d82. Med Sci Sports Exerc. 2012. PMID: 22143106
-
Aerobic endurance training improves nonalcoholic fatty liver disease (NAFLD) features via miR-33 dependent autophagy induction in high fat diet fed mice.Obes Res Clin Pract. 2018 Jan-Feb;12(Suppl 2):80-89. doi: 10.1016/j.orcp.2017.01.004. Epub 2017 Feb 3. Obes Res Clin Pract. 2018. PMID: 28163011
-
The effect of exercise training on glucose tolerance and skeletal muscle triacylglycerol content in rats fed with a high-fat diet.Diabetes Metab. 2001 Feb;27(1):19-23. Diabetes Metab. 2001. PMID: 11240441
-
Tea Seed Oil Prevents Obesity, Reduces Physical Fatigue, and Improves Exercise Performance in High-Fat-Diet-Induced Obese Ovariectomized Mice.Molecules. 2019 Mar 11;24(5):980. doi: 10.3390/molecules24050980. Molecules. 2019. PMID: 30862039 Free PMC article.
Cited by
-
Hypoxia as a Double-Edged Sword to Combat Obesity and Comorbidities.Cells. 2022 Nov 23;11(23):3735. doi: 10.3390/cells11233735. Cells. 2022. PMID: 36496995 Free PMC article. Review.
-
Inhibition of miR-27b Regulates Lipid Metabolism in Skeletal Muscle of Obese Rats During Hypoxic Exercise by Increasing PPARγ Expression.Front Physiol. 2020 Aug 31;11:1090. doi: 10.3389/fphys.2020.01090. eCollection 2020. Front Physiol. 2020. PMID: 32982800 Free PMC article.
-
Mimicking Gene-Environment Interaction of Higher Altitude Dwellers by Intermittent Hypoxia Training: COVID-19 Preventive Strategies.Biology (Basel). 2022 Dec 21;12(1):6. doi: 10.3390/biology12010006. Biology (Basel). 2022. PMID: 36671699 Free PMC article. Review.
-
Exposure to Various Degrees and Durations of Hypobaric Hypoxia Causes a Reduction in Body Weight of Female Adult Rats.Int J Appl Basic Med Res. 2024 Jul-Sep;14(3):151-155. doi: 10.4103/ijabmr.ijabmr_55_24. Epub 2024 Aug 24. Int J Appl Basic Med Res. 2024. PMID: 39310070 Free PMC article.
-
Plasma Metabolomics Reveals β-Glucan Improves Muscle Strength and Exercise Capacity in Athletes.Metabolites. 2022 Oct 18;12(10):988. doi: 10.3390/metabo12100988. Metabolites. 2022. PMID: 36295890 Free PMC article.
References
-
- Lopez-Pascual A, Bes-Rastrollo M, Sayón-Orea C, Perez-Cornago A, Díaz-Gutiérrez J, Pons JJ, et al. . Living at a geographically higher elevation is associated with lower risk of metabolic syndrome: prospective analysis of the SUN Cohort. Front Physiol. (2016) 7:658. 10.3389/fphys.2016.00658 - DOI - PMC - PubMed
LinkOut - more resources
Full Text Sources