

Resting Energy Expenditure, Insulin Resistance and UCP1 Expression in Human Subcutaneous and Visceral Adipose Tissue of Patients With Obesity
- PMID: 31440209
- PMCID: PMC6692889
- DOI: 10.3389/fendo.2019.00548
Resting Energy Expenditure, Insulin Resistance and UCP1 Expression in Human Subcutaneous and Visceral Adipose Tissue of Patients With Obesity
Abstract
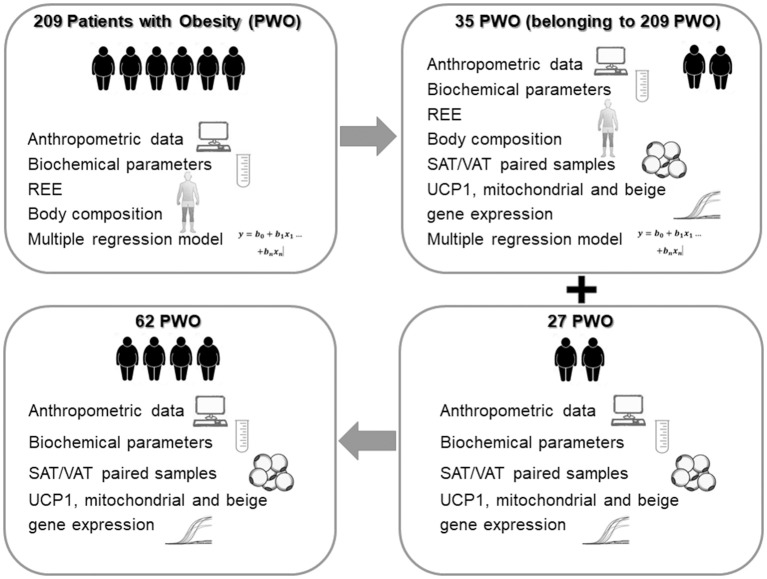
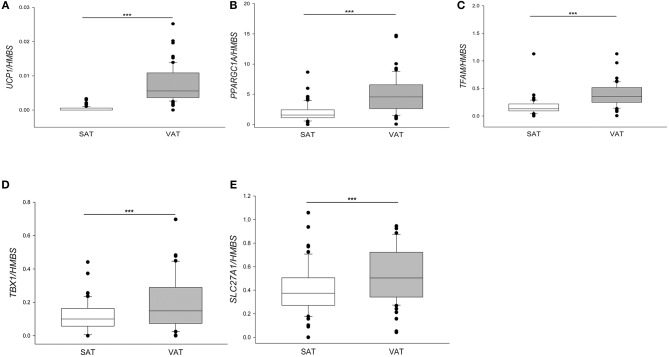
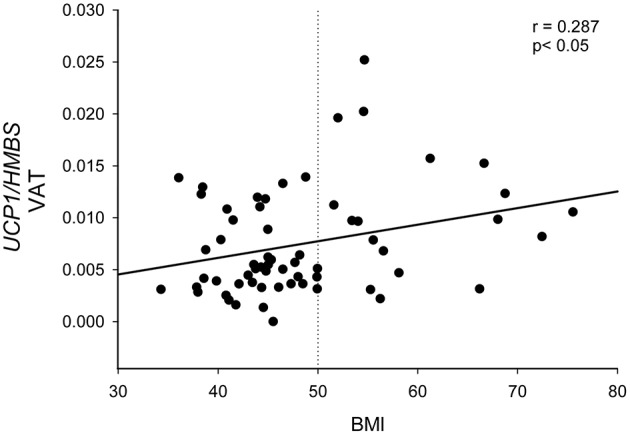
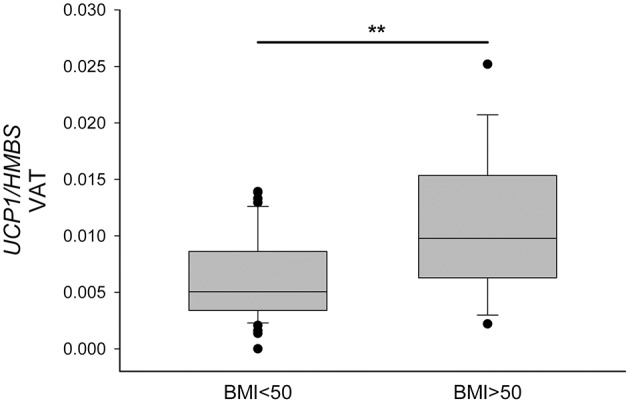
Determinants of resting energy expenditure (REE) in humans are still under investigation, especially the association with insulin resistance. Brown adipose tissue (AT) regulates energy expenditure through the activity of the uncoupling protein 1 (UCP1). White AT browning is the process by which some adipocytes within AT depots acquire properties of brown adipocytes ("brite" adipocytes) and it correlates with metabolic improvement. We analyzed determinants of REE in patients with obesity and assessed UCP1 expression as a "brite" marker in abdominal subcutaneous AT (SAT) and visceral omental AT (VAT). Clinical data, REE, free fat mass (FFM), and fat mass (FM) were determined in 209 patients with obesity. UCP1, PPARG coactivator 1 alpha (PPARGC1A), transcription factor A, mitochondrial (TFAM), T-box transcription factor 1 (TBX1), and solute carrier family 27 member 1 (SLC27A1) expression was assayed in SAT and VAT samples, obtained during sleeve gastrectomy from 62 patients with obesity. REE and body composition data were also available for a subgroup of 35 of whom. In 209 patients with obesity a multiple regression model was computed with REE as the dependent variable and sex, waist, FFM, FM, homeostasis model assessment-insulin resistance (HOMA), interleukin-6 and High Density Lipoprotein-cholesterol as the independent variables. Only FFM, FM and HOMA were independently correlated with REE (r = 0.787, AdjRsqr = 0.602). In each patient VAT displayed a higher UCP1, PPARGC1A, TFAM, TBX1, and SLC27A1 expression than SAT and UCP1 expression in VAT (UCP1-VAT) correlated with Body Mass Index (BMI) (r = 0.287, p < 0.05). Introducing UCP1-VAT in the multivariate model, we showed that FFM, HOMA, interleukin-6, High Density Lipoprotein-cholesterol, and UCP1-VAT were independent factors correlated with REE (r = 0.736, AdjRsqr = 0.612). We confirmed that REE correlates with FFM, FM and HOMA in a large cohort of patients. Our results clearly showed that UCP1-VAT expression was significantly increased in severe human obesity (BMI > 50 kg/m2) and that it behaved as an independent predictor of REE. Lastly, we suggest that an increased REE and browning in metabolically complicated severe obesity could represent an effort to counteract further weight gain.
Keywords: UCP1; adipose tissue; browning; insulin resistance; obesity; resting energy expenditure.
Figures
References
-
- Bosy-Westphal A, Wolf A, Bührens F, Hitze B, Czech N, Mönig H, et al. . Familial influences and obesity-associated metabolic risk factors contribute to the variation in resting energy expenditure: the Kiel Obesity Prevention Study. Am J Clin Nutr. (2008) 87:1695–701. 10.1093/ajcn/87.6.1695 - DOI - PubMed
LinkOut - more resources
Full Text Sources
Research Materials