

Reduction of Mitophagy-Related Oxidative Stress and Preservation of Mitochondria Function Using Melatonin Therapy in an HT22 Hippocampal Neuronal Cell Model of Glutamate-Induced Excitotoxicity
- PMID: 31440210
- PMCID: PMC6694460
- DOI: 10.3389/fendo.2019.00550
Reduction of Mitophagy-Related Oxidative Stress and Preservation of Mitochondria Function Using Melatonin Therapy in an HT22 Hippocampal Neuronal Cell Model of Glutamate-Induced Excitotoxicity
Abstract
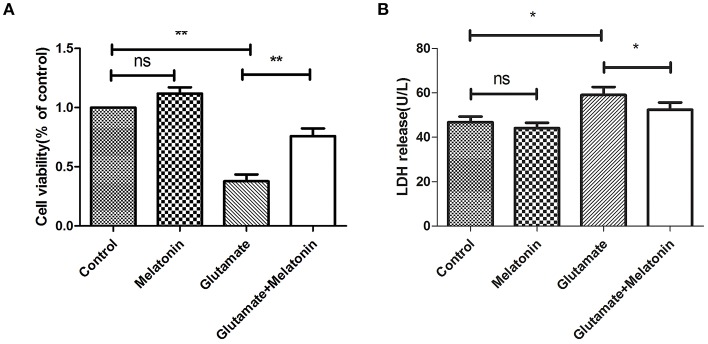
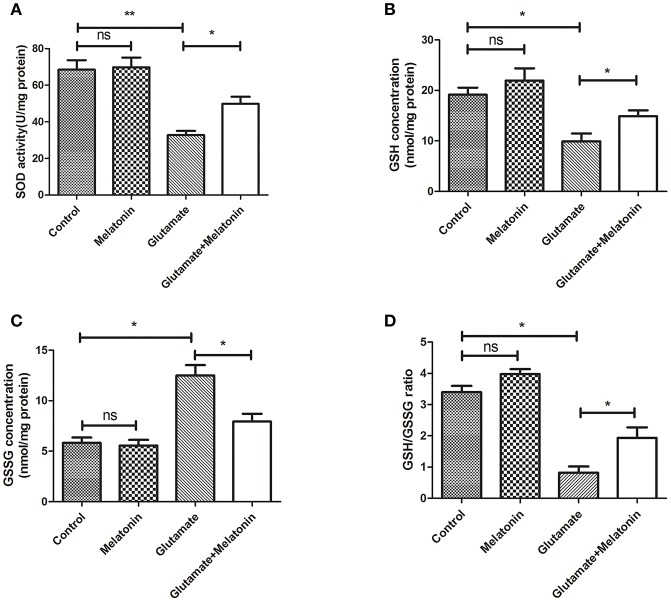
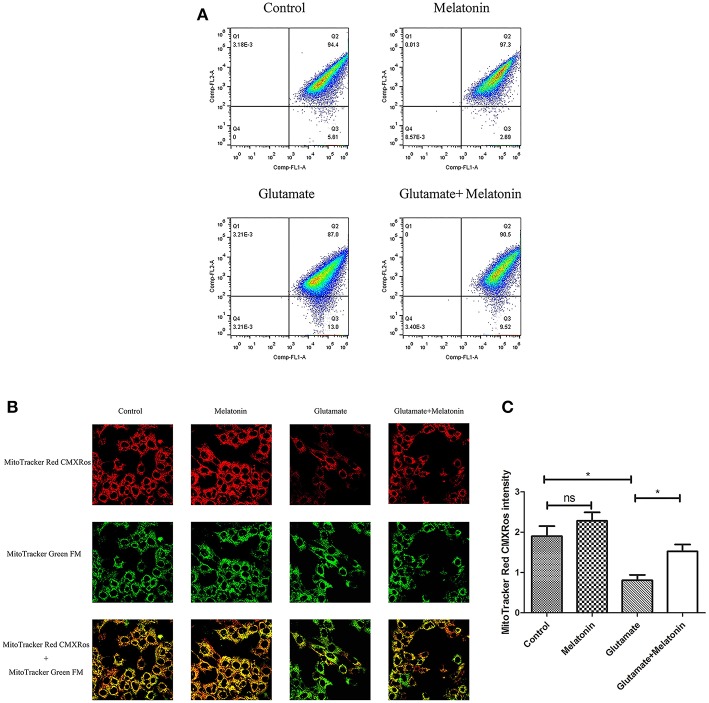
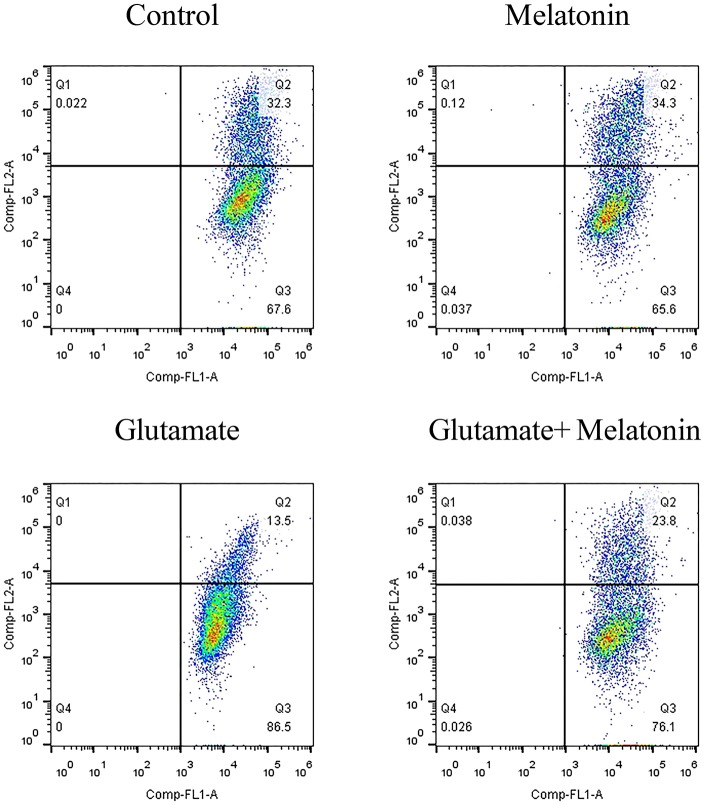
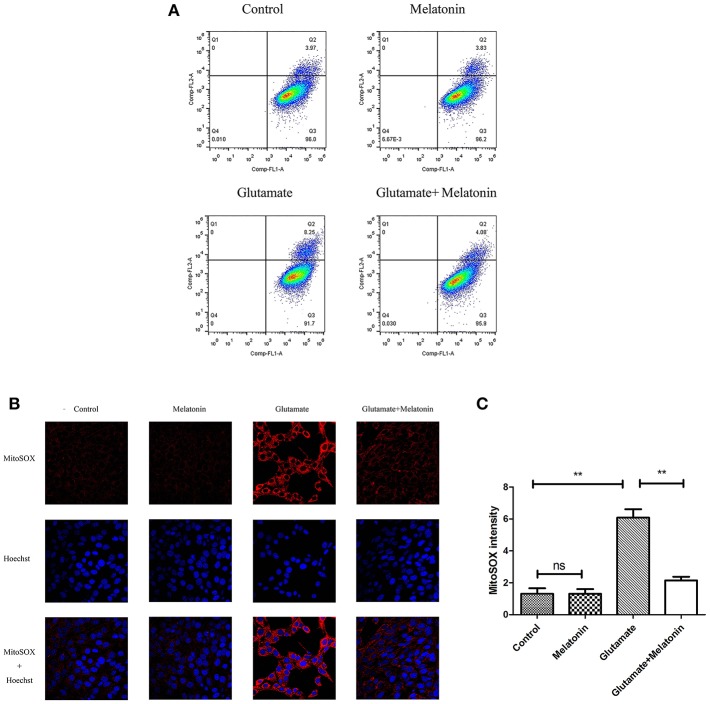
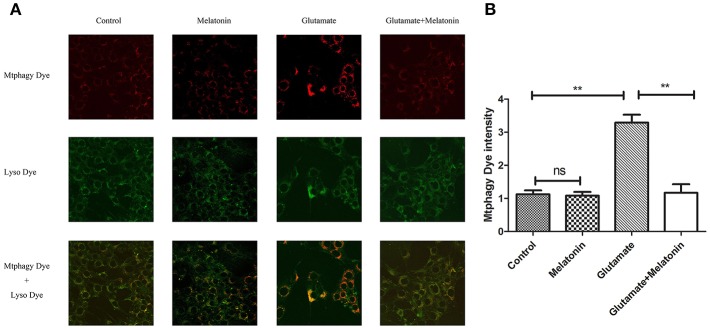
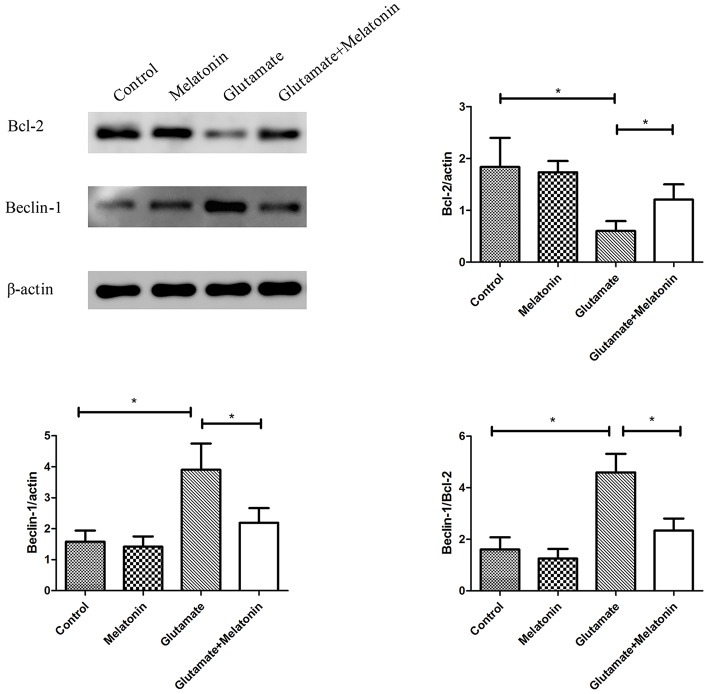
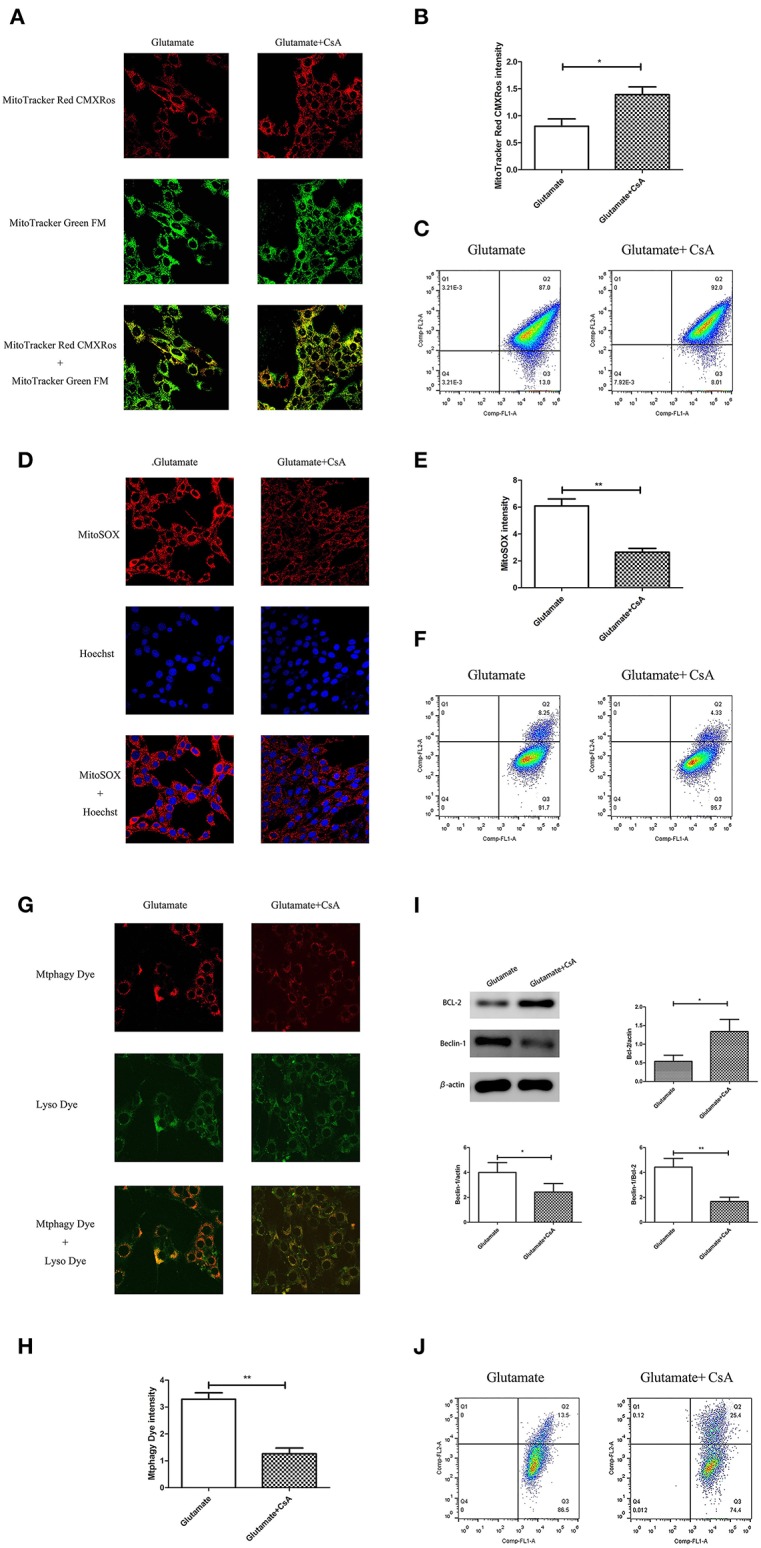
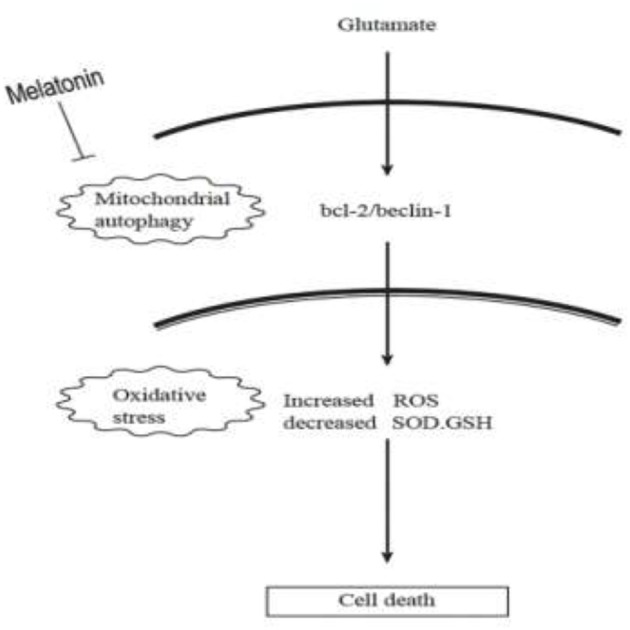
Recent evidence indicates that autophagy-mediated mitochondrial homeostasis is crucial for oxidative stress-related brain damage and repair. The highest concentration of melatonin is in the mitochondria of cells, and melatonin exhibits well-known antioxidant properties. We investigated the impact and mechanism involved in mitochondrial function and the mitochondrial oxidative stress/autophagy regulator parameters of glutamate cytotoxicity in mouse HT22 hippocampal neurons. We tested the hypothesis that melatonin confers neuroprotective effects via protecting against mitochondrial impairment and mitophagy. Cells were divided into four groups: the control group, melatonin alone group, glutamate injury group, and melatonin pretreatment group. We found that glutamate induced significant changes in mitochondrial function/oxidative stress-related parameters. Leptin administration preserved mitochondrial function, and this effect was associated with increased superoxide dismutase, glutathione (GSH), and mitochondrial membrane potential and decreased GSSG (oxidized glutathione) and mitochondrial reactive oxygen species. Melatonin significantly reduced the fluorescence intensity of mitophagy via the Beclin-1/Bcl-2 pathway, which involves Beclin-1 and Bcl-2 proteins. The mitophagy inhibitor CsA corrected these glutamate-induce changes, as measured by the fluorescence intensity of Mitophagy-Tracker Red CMXROS, mitochondrial ROS, and mitochondrial membrane potential changes. These findings indicate that melatonin exerts neuroprotective effects against glutamate-induced excitotoxicity by reducing mitophagy-related oxidative stress and maintaining mitochondrial function.
Keywords: HT22; glutamate; melatonin; mitochondria; mitophagy.
Figures

Similar articles
-
Leptin Maintained Zinc Homeostasis Against Glutamate-Induced Excitotoxicity by Preventing Mitophagy-Mediated Mitochondrial Activation in HT22 Hippocampal Neuronal Cells.Front Neurol. 2018 May 9;9:322. doi: 10.3389/fneur.2018.00322. eCollection 2018. Front Neurol. 2018. PMID: 29867731 Free PMC article.
-
Melatonin prevents glutamate-induced oxytosis in the HT22 mouse hippocampal cell line through an antioxidant effect specifically targeting mitochondria.J Neurochem. 2007 Feb;100(3):736-46. doi: 10.1111/j.1471-4159.2006.04228.x. J Neurochem. 2007. PMID: 17263795
-
Plppr5 gene inactivation causes a more severe neurological phenotype and abnormal mitochondrial homeostasis in a mouse model of juvenile seizure.Epilepsy Res. 2022 Jul;183:106944. doi: 10.1016/j.eplepsyres.2022.106944. Epub 2022 May 20. Epilepsy Res. 2022. PMID: 35617916
-
Glutamate Excitotoxicity and Oxidative Stress in Epilepsy: Modulatory Role of Melatonin.J Environ Pathol Toxicol Oncol. 2016;35(4):365-374. doi: 10.1615/JEnvironPatholToxicolOncol.2016016399. J Environ Pathol Toxicol Oncol. 2016. PMID: 27992316 Review.
-
Role of melatonin in the regulation of autophagy and mitophagy: a review.Mol Cell Endocrinol. 2012 Sep 25;361(1-2):12-23. doi: 10.1016/j.mce.2012.04.009. Epub 2012 May 1. Mol Cell Endocrinol. 2012. PMID: 22575351 Review.
Cited by
-
NMR-Based Metabolomics to Analyze the Effects of a Series of Monoamine Oxidases-B Inhibitors on U251 Cells.Biomolecules. 2023 Mar 27;13(4):600. doi: 10.3390/biom13040600. Biomolecules. 2023. PMID: 37189348 Free PMC article.
-
Investigation into Antioxidant Mechanism of Lycium barbarum Extract in Carbendazim-Induced PC12 Cell Injury Model through Transcriptomics and Metabolomics Analyses.Foods. 2024 Jul 28;13(15):2384. doi: 10.3390/foods13152384. Foods. 2024. PMID: 39123576 Free PMC article.
-
Thunbergia laurifolia Leaf Extract Inhibits Glutamate-Induced Neurotoxicity and Cell Death through Mitophagy Signaling.Antioxidants (Basel). 2021 Oct 25;10(11):1678. doi: 10.3390/antiox10111678. Antioxidants (Basel). 2021. PMID: 34829549 Free PMC article.
-
The "mitochondrial stress responses": the "Dr. Jekyll and Mr. Hyde" of neuronal disorders.Neural Regen Res. 2022 Dec;17(12):2563-2575. doi: 10.4103/1673-5374.339473. Neural Regen Res. 2022. PMID: 35662183 Free PMC article. Review.
-
miR-218 Inhibits Mitochondrial Clearance by Targeting PRKN E3 Ubiquitin Ligase.Int J Mol Sci. 2020 Jan 5;21(1):355. doi: 10.3390/ijms21010355. Int J Mol Sci. 2020. PMID: 31948106 Free PMC article.
References
LinkOut - more resources
Full Text Sources