

Perturbation of the Monocyte Compartment in Human Obesity
- PMID: 31440251
- PMCID: PMC6694869
- DOI: 10.3389/fimmu.2019.01874
Perturbation of the Monocyte Compartment in Human Obesity
Abstract
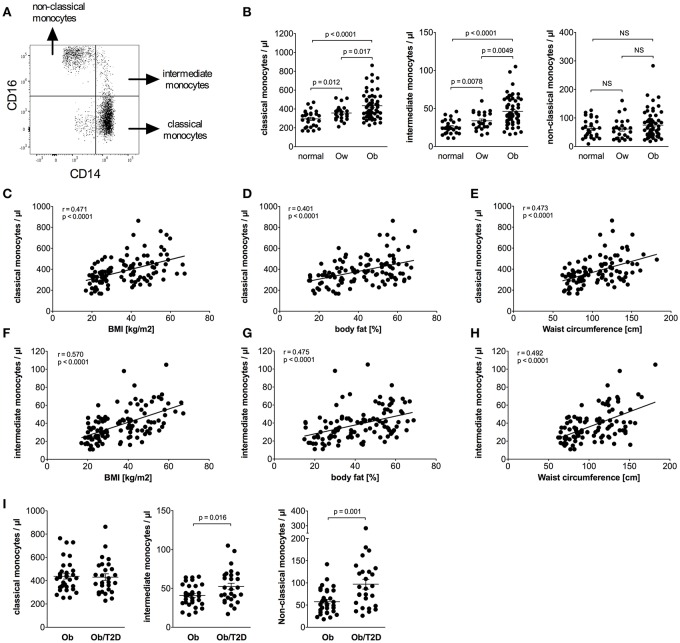
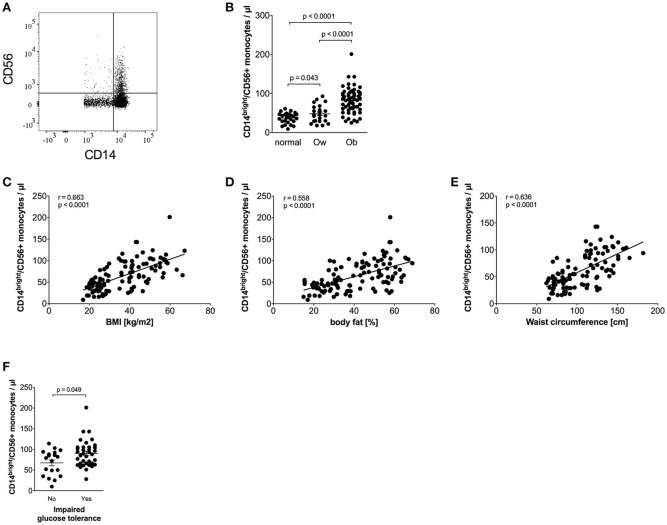
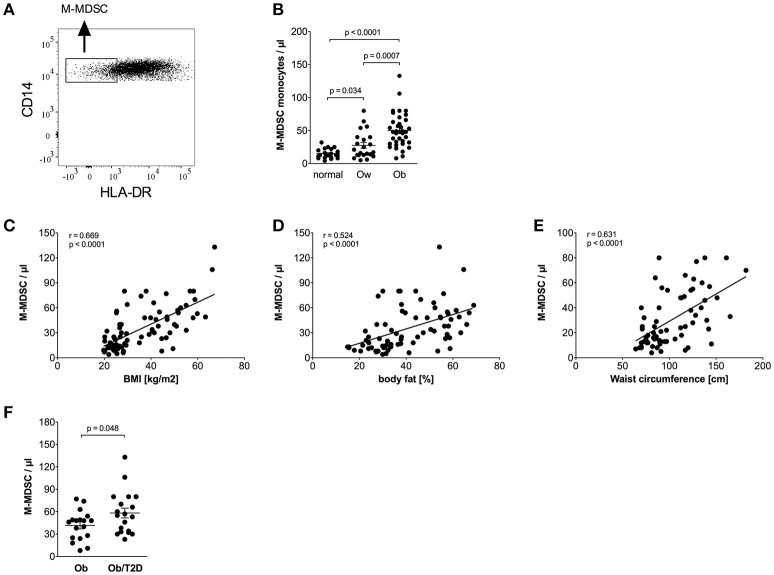
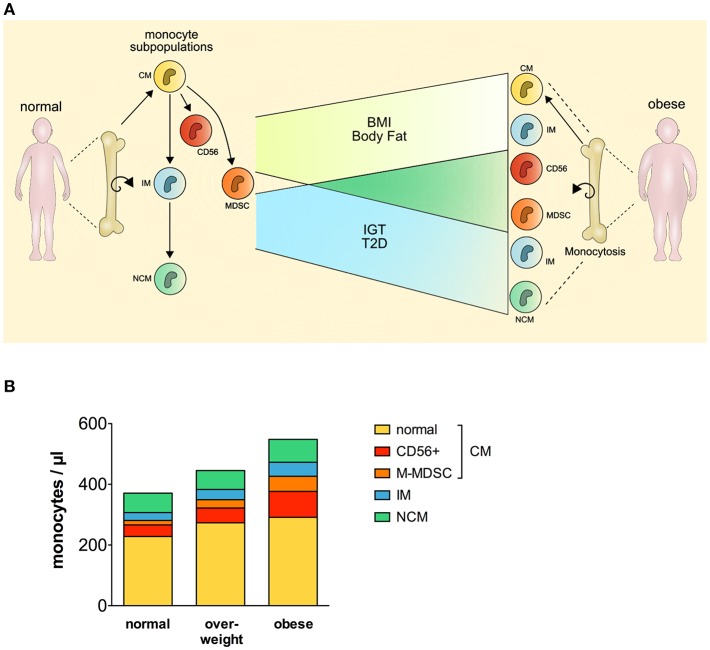
Circulating monocytes can be divided into classical (CM), intermediate (IM), and non-classical monocytes (NCM), and the classical monocytes also contain CD56+ monocytes and monocytic myeloid-derived suppressor cells (M-MDSC). The aim of the study was to evaluate the occurrence of the monocyte subpopulations in human obesity. Twenty-seven normal, 23 overweight, and 60 obese individuals (including 17 obese individuals with normal glucose tolerance and 27 with type 2 diabetes) were included into this study. Peripheral blood mononuclear cells were isolated from human blood, and surface markers to identify monocyte subpopulations were analyzed by flow cytometry. Obese individuals had higher numbers of total monocytes, CM, IM, CD56+ monocytes, and M-MDSCs. The number of CM, IM, CD56+ monocytes, and M-MDSCs, correlated positively with body mass index, body fat, waist circumference, triglycerides, C-reactive protein, and HbA1c, and negatively with high-density lipoprotein cholesterol. Individuals with obesity and type 2 diabetes had higher numbers of IM, NCM, and M-MDSCs, whereas those with obesity and impaired glucose tolerance had higher numbers of CD56+ monocytes. In summary, the comprehensive analysis of blood monocytes in human obesity revealed a shift of the monocyte compartment toward pro-inflammatory monocytes which might contribute to the development of low-grade inflammation in obesity, and immune-suppressive monocytes which might contribute to the development of cancer in obesity.
Keywords: CD16; CD56; macrophages; monocytes; myeloid suppressor cells (MDSC); obesity; subpopulation.
Figures
Similar articles
-
Profiling of the three circulating monocyte subpopulations in human obesity.J Immunol. 2015 Apr 15;194(8):3917-23. doi: 10.4049/jimmunol.1402655. Epub 2015 Mar 18. J Immunol. 2015. PMID: 25786686 Clinical Trial.
-
Standardized flow cytometry assay for identification of human monocytic heterogeneity and LRP1 expression in monocyte subpopulations: decreased expression of this receptor in nonclassical monocytes.Cytometry A. 2014 Jul;85(7):601-10. doi: 10.1002/cyto.a.22455. Epub 2014 Mar 17. Cytometry A. 2014. PMID: 24639232
-
Impaired alternative macrophage differentiation of peripheral blood mononuclear cells from obese subjects.Diab Vasc Dis Res. 2012 Jul;9(3):189-95. doi: 10.1177/1479164111430242. Epub 2011 Dec 22. Diab Vasc Dis Res. 2012. PMID: 22192929 Free PMC article.
-
Roles of Myeloid-Derived Suppressor Cell Subpopulations in Autoimmune Arthritis.Front Immunol. 2018 Dec 4;9:2849. doi: 10.3389/fimmu.2018.02849. eCollection 2018. Front Immunol. 2018. PMID: 30564242 Free PMC article. Review.
-
Plasticity of myeloid-derived suppressor cells in cancer.Curr Opin Immunol. 2018 Apr;51:76-82. doi: 10.1016/j.coi.2018.03.009. Epub 2018 Mar 14. Curr Opin Immunol. 2018. PMID: 29547768 Free PMC article. Review.
Cited by
-
Identification and verification of immune-related biomarkers and immune infiltration in diabetic heart failure.Front Cardiovasc Med. 2022 Nov 17;9:931066. doi: 10.3389/fcvm.2022.931066. eCollection 2022. Front Cardiovasc Med. 2022. PMID: 36465455 Free PMC article.
-
The long-term effect of metabolic bariatric surgery on innate immune cell phenotype and function.Int J Obes (Lond). 2025 Aug 20. doi: 10.1038/s41366-025-01886-3. Online ahead of print. Int J Obes (Lond). 2025. PMID: 40836110
-
Leukocyte Activation and Antioxidative Defense Are Interrelated and Moderately Modified by n-3 Polyunsaturated Fatty Acid-Enriched Eggs Consumption-Double-Blind Controlled Randomized Clinical Study.Nutrients. 2020 Oct 13;12(10):3122. doi: 10.3390/nu12103122. Nutrients. 2020. PMID: 33066081 Free PMC article. Clinical Trial.
-
The Influence of the Sympathetic Nervous System on Cardiometabolic Health in Response to Weight Gain or Weight Loss.Metabolites. 2025 Apr 23;15(5):286. doi: 10.3390/metabo15050286. Metabolites. 2025. PMID: 40422864 Free PMC article. Review.
-
A cross-sectional study evidences regulations of leukocytes in the colostrum of mothers with obesity.BMC Med. 2022 Nov 1;20(1):388. doi: 10.1186/s12916-022-02575-y. BMC Med. 2022. PMID: 36316769 Free PMC article.
References
Publication types
MeSH terms
Substances
LinkOut - more resources
Full Text Sources
Medical
Research Materials