. 2019 Aug 7:10:1014.
doi: 10.3389/fpls.2019.01014. eCollection 2019.

Transcriptional Reprogramming of Pea Leaves at Early Reproductive Stages

Affiliations

Transcriptional Reprogramming of Pea Leaves at Early Reproductive Stages

Karine Gallardo et al. Front Plant Sci. .

Abstract

Pea (Pisum sativum L.) is an important source of dietary proteins. Nutrient recycling from leaves contributes to the accumulation of seed proteins and is a pivotal determinant of protein yields in this grain legume. The aim of this study was to unveil the transcriptional regulations occurring in pea leaves before the sharp decrease in chlorophyll breakdown. As a prelude to this study, a time-series analysis of 15N translocation at the whole plant level was performed, which indicated that nitrogen recycling among organs was highly dynamic during this period and varied depending on nitrate availability. Leaves collected on vegetative and reproductive nodes were further analyzed by transcriptomics. The data revealed extensive transcriptome changes in leaves of reproductive nodes during early seed development (from flowering to 14 days after flowering), including an up-regulation of genes encoding transporters, and particularly of sulfate that might sustain sulfur metabolism in leaves of the reproductive part. This developmental period was also characterized by a down-regulation of cell wall-associated genes in leaves of both reproductive and vegetative nodes, reflecting a shift in cell wall structure. Later on, 27 days after flowering, genes potentially switching the metabolism of leaves toward senescence were pinpointed, some of which are related to ribosomal RNA processing, autophagy, or transport systems. Transcription factors differentially regulated in leaves between stages were identified and a gene co-expression network pointed out some of them as potential regulators of the above-mentioned biological processes. The same approach was conducted in Medicago truncatula to identify shared regulations with this wild legume species. Altogether the results give a global view of transcriptional events in leaves of legumes at early reproductive stages and provide a valuable resource of candidate genes that could be targeted by reverse genetics to improve nutrient remobilization and/or delay catabolic processes leading to senescence.

Keywords: co-expression; leaves; legumes; nitrogen remobilization; reproductive period; transcription factors; transcriptomics; transporters.


Figures

Figure 1
Figure 1
Nitrogen remobilized between plant parts during the reproductive phase in pea, with (A) or without (B) nitrate supply from flowering. Black arrows indicate that nitrogen is remobilized from a tissue, and gray arrows indicate that nitrogen is redistributed toward a tissue. In squares are mean values of nitrogen quantity in each compartment (roots, leaves of the vegetative nodes = L leaves, leaves of the reproductive nodes = U leaves, stems, pod wall, and seeds) at the last stage (14, 27, and 63 days after flowering). Data are mean values ± standard errors. In each diagram and for each tissue, stars indicate significant variations in the amount of nitrogen remobilized in response to nitrogen deprivation: *P < 0.1, **P < 0.05, ***P < 0.01 (t-test, data from 4 individual plants).
Figure 2
Figure 2
Transcriptome changes in leaves of vegetative (lower leaves) and reproductive (upper leaves) nodes during pea seed development and in response to nitrate availability. The number of genes whose expression varied (Bonferroni-corrected P-value < 0.05) between the beginning of flowering and 14 days after flowering (A, 14 DAF) and/or between 14 and 27 days after flowering (B, 27 DAF). The number of genes whose expression varied regardless of nitrate nutrition are shown in gray boxes, while the number of genes whose expression varied specifically under nitrate-supply (N+) or nitrate-deprivation (N–) are shown in red and blue boxes, respectively. The circles are proportional to the number of genes in each box. GO terms significantly enriched (Fisher P values < 0.005) in each gene list are sorted according to P values (lowest at the top).
Figure 3
Figure 3
Transporter genes differentially expressed (≥4-fold) in pea leaves between at least two stages. (A) Hierarchical clustering of expression profiles in lower and upper leaves. The color scale indicates Log2R for the comparisons 14 DAF vs. flowering (14), 27 DAF vs. 14 DAF (27), and in response to nitrate-deficiency (N–). Arrows indicate sulfate transporter (SULTR) genes. (B) Phylogenetic tree of SULTR sequences identified in the Pea RNAseq Atlas (Alves-Carvalho et al., 2015). (C) Expression (array data) of pea SULTR genes marked by an arrow in (A,B) and expression profile of the Medicago truncatula (M. truncatula) orthologs (In bold, Bonferroni-corrected P-value < 0.05). (D) Genes connected to PsCam025051/SULTR2;1 in P-REMONET.
Figure 4
Figure 4
Genes with GO terms related to TF activity (GO:0003700) and regulation of transcription (GO:0045449) differentially expressed at least 4-fold in pea leaves between two developmental stages. (A) Number of differentially expressed genes represented as a percentage (bars) of the total number of genes per TF family (pie chart). (B) Hierarchical clustering of their expression profiles in lower and upper leaves. The color scale indicates Log2R for the comparisons 14 DAF vs. flowering (14), 27 DAF vs. 14 DAF (27), and in response to nitrate-deficiency (N–), and white dots in squares indicate the highest values. MYB, myeloblastosis; NF-Y, nuclear factor Y; HSF, heat shock transcription factor; AGL, agamous-like; bHLH, basic helix-loop-helix; IAA, indoleacetic acid-induced protein; ARF, auxin response factor; Hox, Homeodomain/homeobox; DOF, DNA-binding One Zinc Finger; bZIP, Basic Leucine Zipper.
Figure 5
Figure 5
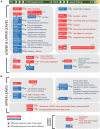
Diagram of TF-related co-expression modules in pea leaves during embryogenesis and seed filling. Red and blue rectangles correspond to TFs up- and down-regulated, respectively, during the time course of nutrient remobilization: from the beginning of flowering to 14 DAF (left panel), from 14 to 27 DAF (right panel) or throughout the time course (large panels). The arrows indicate a co-expression between TFs and biological processes (TopGO annotation, Table S8) or genes (in italic) was identified in P-REMONET (corresponding modules in gray). ⊥ and indicate negative expression correlations between genes. The colors of the TFs and related processes indicate the genes were up- (red) or down- (blue) regulated during the time course in both lower and upper leaves (A) or in specific leaf types (B). TFs in bold and underlined have shared putative targets in the co-expression networks from M. truncatula and pea. A droplet indicates significant variations in gene expression specifically in response to nitrate supply (red) or deficiency (blue).
Figure 6
Figure 6
Comparison of leaf transcriptomes and TF-related modules between pea and M. truncatula. (A) Pair-wise Pearson correlation coefficients calculated from each sample comparison expressed in log2 ratio: beginning of flowering vs. 14 DAF (14), 14 vs. 27 DAF (27), for lower (L), and upper (U) leaves, with nitrogen (N+), or without nitrogen (N–). The color scale indicates the degree of correlations between transcriptomes. All correlations were significant (P < 0.05, n = 14980 sequences) except sample comparisons indicated by ns (non-significant). Squares indicate the same samples compared between the two species. (B) NAC073#1 (PsCam037889)-related network in module M7. The connected genes were organized using the circular layout algorithm from Cytoscape. Orthologous genes connected to the NAC073#1 ortholog (MT0019_00537) in M. truncatula (data from Table 2) were encircled in yellow and annotated.

Similar articles

Cited by

References

    1. Aharoni A., Dixit S., Jetter R., Thoenes E., van Arkel G., Pereira A. (2004). The SHINE clade of AP2 domain transcription factors activates wax biosynthesis, alters cuticle properties, and confers drought tolerance when overexpressed in arabidopsis. Plant Cell 16, 2463–2480. 10.1105/tpc.104.022897 - DOI - PMC - PubMed
    1. Álvarez C., García I., Moreno I., Pérez-Pérez M. E., Crespo J. L., Romero L. C., et al. . (2012). Cysteine-generated sulfide in the cytosol negatively regulates autophagy and modulates the transcriptional profile in Arabidopsis. Plant Cell 24, 4621–4634. 10.1105/tpc.112.105403 - DOI - PMC - PubMed
    1. Alves-Carvalho S., Aubert G., Carrère S., Cruaud C., Brochot A. L., Jacquin F., et al. . (2015). Full-length de novo assembly of RNA-seq data in pea (Pisum sativum L.) provides a gene expression atlas and gives insights into root nodulation in this species. Plant J. 84, 1–19. 10.1111/tpj.12967 - DOI - PubMed
    1. Anschütz U., Becker D., Shabala S. (2014). Going beyond nutrition: regulation of potassium homoeostasis as a common denominator of plant adaptive responses to environment. J. Plant Physiol. 171, 670–687. 10.1016/j.jplph.2014.01.009 - DOI - PubMed
    1. Balazadeh S., Siddiqui H., Allu A. D., Matallana-Ramirez L. P., Caldana C., Mehrnia M., et al. . (2010). A gene regulatory network controlled by the NAC transcription factor ANAC092/AtNAC2/ORE1 during salt-promoted senescence. Plant J. 62, 250–264. 10.1111/j.1365-313X.2010.04151.x - DOI - PubMed