Maintained Properties of Aged Dental Pulp Stem Cells for Superior Periodontal Tissue Regeneration
- PMID: 31440385
- PMCID: PMC6675537
- DOI: 10.14336/AD.2018.0729
Maintained Properties of Aged Dental Pulp Stem Cells for Superior Periodontal Tissue Regeneration
Abstract
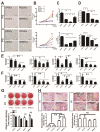
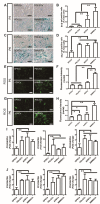
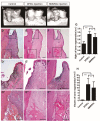
Owing to excellent therapeutic potential, mesenchymal stem cells (MSCs) are gaining increasing popularity with researchers worldwide for applications in tissue engineering, and in treatment of inflammation-related and age-related disorders. However, the senescence of MSCs over passaging has limited their clinical application owing to adverse effect on physiological function maintenance of tissues as well as disease treatment. An inflammatory microenvironment is one of the key contributors to MSC senescence, resulting in low regeneration efficiency. Therefore, MSCs with high resistance to cellular senescence would be a benefit for tissue regeneration. Toward this end, we analyzed the senescence properties of different types of stem cells during culture and under inflammation, including dental pulp stem cells (DPSCs), periodontal ligament stem cells (PDLSCs), bone marrow mesenchymal stem cells (BMMSCs), and adipose-derived stem cells (ADSCs). Overall, the DPSCs had higher proliferation rates, lower cellular senescence, and enhanced osteogenesis maintenance compared to those of non-dental MSCs cultured from passage three to six. The expression profiles of genes related to apoptosis, cell cycle, and cellular protein metabolic process (contributing to the cell self-renewal ability and metabolic processes) significantly differed between DPSCs and BMMSCs at passage three. Moreover, DPSCs were superior to BMMSCs with regards to resistance to lipopolysaccharide-induced apoptosis and senescence, with enhanced osteogenesis in vitro, and showed improved periodontal regeneration after injection in a miniature pig periodontitis model in vivo. Overall, the present study indicates that DPSCs show superior resistance to subculture and inflammation-induced senescence and would be suitable stem cells for tissue engineering with inflammation.
Keywords: inflammation; mesenchymal stem cells; periodontitis; senescence.
Figures


Similar articles
-
A comprehensive study on donor-matched comparisons of three types of mesenchymal stem cells-containing cells from human dental tissue.J Periodontal Res. 2019 Jun;54(3):286-299. doi: 10.1111/jre.12630. Epub 2018 Nov 25. J Periodontal Res. 2019. PMID: 30474138
-
An In Vitro Comparative Study of Multisource Derived Human Mesenchymal Stem Cells for Bone Tissue Engineering.Stem Cells Dev. 2018 Dec 1;27(23):1634-1645. doi: 10.1089/scd.2018.0119. Epub 2018 Oct 23. Stem Cells Dev. 2018. PMID: 30234437
-
Investigation of dental pulp stem cells isolated from discarded human teeth extracted due to aggressive periodontitis.Biomaterials. 2014 Nov;35(35):9459-72. doi: 10.1016/j.biomaterials.2014.08.003. Epub 2014 Aug 27. Biomaterials. 2014. PMID: 25172527
-
Stem cell-based tooth and periodontal regeneration.Oral Dis. 2018 Jul;24(5):696-705. doi: 10.1111/odi.12703. Epub 2017 Jul 24. Oral Dis. 2018. PMID: 28636235 Review.
-
Mesenchymal stem cell-based tissue regeneration therapies for periodontitis.Regen Ther. 2020 Jan 15;14:72-78. doi: 10.1016/j.reth.2019.12.011. eCollection 2020 Jun. Regen Ther. 2020. PMID: 31970269 Free PMC article. Review.
Cited by
-
Stem Cell-based Dental Pulp Regeneration: Insights From Signaling Pathways.Stem Cell Rev Rep. 2021 Aug;17(4):1251-1263. doi: 10.1007/s12015-020-10117-3. Epub 2021 Jan 18. Stem Cell Rev Rep. 2021. PMID: 33459973 Review.
-
mTOR is involved in LRP5-induced osteogenic differentiation of normal and aged periodontal ligament stem cells in vitro.J Mol Histol. 2022 Oct;53(5):793-804. doi: 10.1007/s10735-022-10097-3. Epub 2022 Aug 24. J Mol Histol. 2022. PMID: 36002678
-
Aging and Senescence of Dental Pulp and Hard Tissues of the Tooth.Front Cell Dev Biol. 2020 Nov 30;8:605996. doi: 10.3389/fcell.2020.605996. eCollection 2020. Front Cell Dev Biol. 2020. PMID: 33330507 Free PMC article. Review.
-
Dental pulp stem cells ameliorate D-galactose-induced cardiac ageing in rats.PeerJ. 2024 May 21;12:e17299. doi: 10.7717/peerj.17299. eCollection 2024. PeerJ. 2024. PMID: 38799055 Free PMC article.
-
DPSCs regulate epithelial-T cell interactions in oral submucous fibrosis.Stem Cell Res Ther. 2024 Apr 23;15(1):113. doi: 10.1186/s13287-024-03720-5. Stem Cell Res Ther. 2024. PMID: 38650025 Free PMC article.
References
LinkOut - more resources
Full Text Sources
