

One-Year Comparative Evaluation of iStent or iStent inject Implantation Combined with Cataract Surgery in a Single Center
- PMID: 31440981
- PMCID: PMC6822971
- DOI: 10.1007/s12325-019-01067-5
One-Year Comparative Evaluation of iStent or iStent inject Implantation Combined with Cataract Surgery in a Single Center
Abstract
Introduction: This retrospective consecutive case series assessed 12-month effectiveness and safety of iStent® or iStent inject® trabecular micro-bypass implants with cataract surgery in patients with open-angle glaucoma (OAG) in a real-world clinical setting.
Methods: Effectiveness outcomes consisted of intraocular pressure (IOP) reduction; glaucoma medication reduction; proportions of eyes achieving IOP < 18, < 15, or < 12 mmHg; and proportional analysis of medication usage. Safety outcomes included adverse events, secondary surgeries, and best-corrected visual acuity (BCVA).
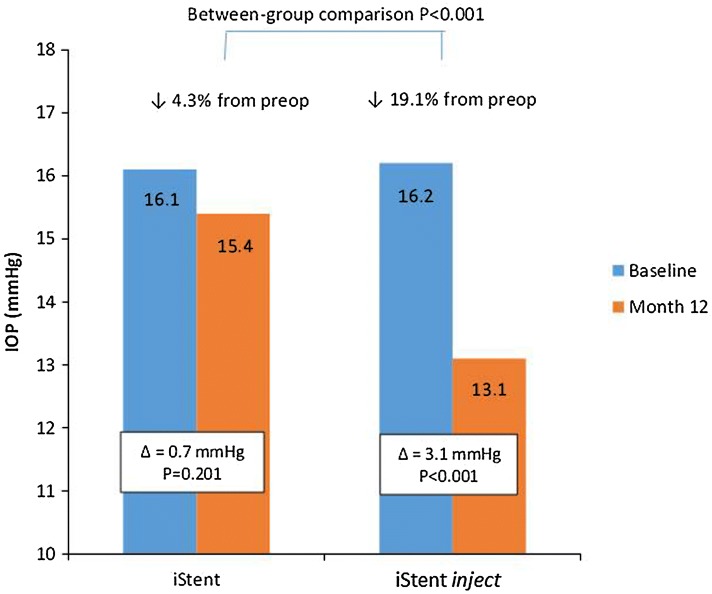
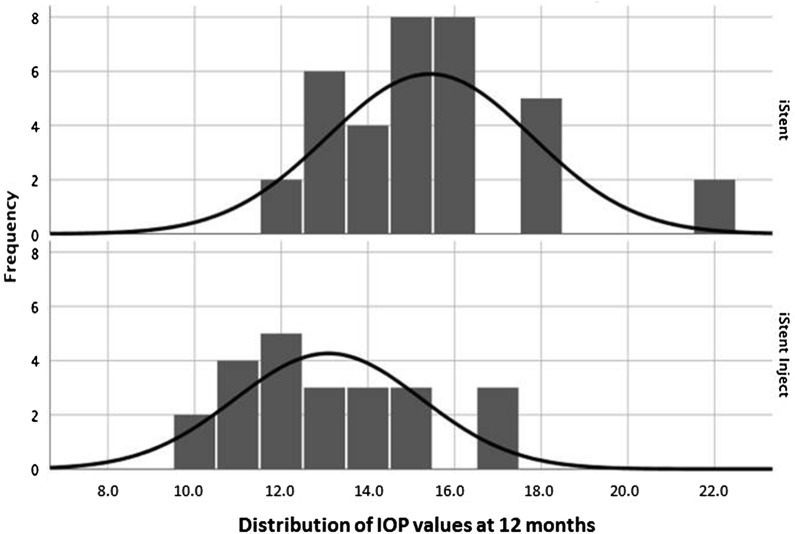
Results: This evaluation included 58 eyes with OAG (35 iStent, 23 iStent inject), with 96.6% of eyes having mild or moderate glaucoma. Diagnoses included primary open-angle glaucoma (the majority; 72.4%), pseudoexfoliative glaucoma, and pigmentary glaucoma. Baseline mean IOP and medications were statistically comparable between groups: 16.1 ± 3.6 mmHg on a mean of 1.8 ± 0.8 medications in the iStent group, and 16.2 ± 3.1 mmHg on a mean of 1.7 ± 0.8 medications in the iStent inject group. Twelve months after stent-cataract surgery, mean IOP was significantly lower in the iStent inject group than in the iStent group (13.1 mmHg vs. 15.4 mmHg, respectively; p < 0.001), and the percent reduction in IOP from baseline was significantly greater in iStent inject eyes than in iStent eyes (19.1% vs. 4.3% reduction, respectively; p < 0.001). At 12 months postoperative, significantly greater proportions of iStent inject eyes than iStent eyes achieved IOP < 18 mmHg (100% vs. 80.0% of eyes, respectively; p = 0.035), IOP < 15 mmHg (73.9% vs. 34.3% of eyes, respectively; p = 0.003), and IOP < 12 mmHg (26.1% vs. 0% of eyes, respectively; p = 0.002). Meanwhile, both groups achieved significant medication reductions at 12 months vs. baseline (94.1% reduction in iStent inject eyes, p < 0.0001; and 72.2% reduction in iStent eyes, p < 0.0001), with the percent reduction being significantly greater in iStent inject eyes than in iStent eyes (p = 0.023). At 12 months, mean number of medications was significantly lower in iStent inject eyes than iStent eyes (0.1 vs. 0.5 medications, respectively; p = 0.021), and significantly more iStent inject eyes (95.7%) than iStent eyes (71.4%) were off medications entirely (p = 0.021). A similarly high safety profile was observed in both groups.
Conclusion: iStent or iStent inject implantation with cataract surgery resulted in substantial and safe reductions in IOP and medications through 12 months postoperative. Consistent with prior observations, greater efficacy was observed with iStent inject than with iStent.
Funding: The Rapid Service Fees were funded by Glaukos Corporation.
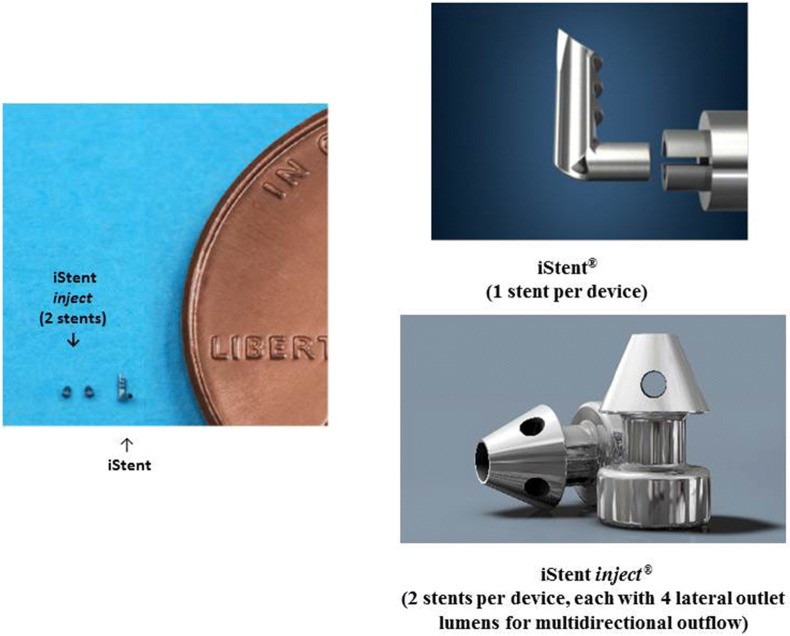
Keywords: Cataract; Glaucoma; Intraocular pressure; Medication; Microinvasive glaucoma surgery (MIGS); Safety; Second-generation; Trabecular micro-bypass; iStent; iStent inject.
Figures


Similar articles
-
Real-world Case Series of iStent or iStent inject Trabecular Micro-Bypass Stents Combined with Cataract Surgery.Ophthalmol Ther. 2019 Dec;8(4):549-561. doi: 10.1007/s40123-019-00208-x. Epub 2019 Aug 17. Ophthalmol Ther. 2019. PMID: 31422555 Free PMC article.
-
12-Month Retrospective Comparison of Kahook Dual Blade Excisional Goniotomy with Istent Trabecular Bypass Device Implantation in Glaucomatous Eyes at the Time of Cataract Surgery.Adv Ther. 2019 Sep;36(9):2515-2527. doi: 10.1007/s12325-019-01025-1. Epub 2019 Jul 17. Adv Ther. 2019. PMID: 31317390 Free PMC article.
-
Intermediate Results of iStent or iStent inject Implantation Combined with Cataract Surgery in a Real-World Setting: A Longitudinal Retrospective Study.Ophthalmol Ther. 2019 Mar;8(1):87-100. doi: 10.1007/s40123-019-0166-x. Epub 2019 Feb 5. Ophthalmol Ther. 2019. PMID: 30721523 Free PMC article.
-
Ab interno trabecular bypass surgery with Schlemm´s canal microstent (Hydrus) for open angle glaucoma.Cochrane Database Syst Rev. 2020 Mar 9;3(3):CD012740. doi: 10.1002/14651858.CD012740.pub2. Cochrane Database Syst Rev. 2020. PMID: 32147807 Free PMC article.
-
Ab interno trabecular bypass surgery with iStent for open-angle glaucoma.Cochrane Database Syst Rev. 2019 Mar 28;3(3):CD012743. doi: 10.1002/14651858.CD012743.pub2. Cochrane Database Syst Rev. 2019. PMID: 30919929 Free PMC article.
Cited by
-
Two-Year Comparative Outcomes of First- and Second-Generation Trabecular Micro-Bypass Stents with Cataract Surgery.Clin Ophthalmol. 2021 May 5;15:1861-1873. doi: 10.2147/OPTH.S302684. eCollection 2021. Clin Ophthalmol. 2021. PMID: 33981138 Free PMC article.
-
Consistency in Standalone Canaloplasty Outcomes Using the iTrack Microcatheter.Clin Ophthalmol. 2024 Jan 16;18:173-183. doi: 10.2147/OPTH.S441113. eCollection 2024. Clin Ophthalmol. 2024. PMID: 38250597 Free PMC article.
-
iStent Trabecular Micro-Bypass Stent Implantation with Cataract Surgery in a Japanese Glaucoma Population.Clin Ophthalmol. 2020 Oct 15;14:3381-3391. doi: 10.2147/OPTH.S274281. eCollection 2020. Clin Ophthalmol. 2020. PMID: 33116389 Free PMC article.
-
Prospective Interventional Cohort Study of Ocular Surface Disease Changes in Eyes After Trabecular Micro-Bypass Stent(s) Implantation (iStent or iStent inject) with Phacoemulsification.Ophthalmol Ther. 2020 Dec;9(4):941-953. doi: 10.1007/s40123-020-00290-6. Epub 2020 Aug 13. Ophthalmol Ther. 2020. PMID: 32789800 Free PMC article.
-
Two-Year Multicenter Outcomes of iStent inject Trabecular Micro-Bypass Stents Combined with Phacoemulsification in Various Types of Glaucoma and Ocular Hypertension.Clin Ophthalmol. 2020 Oct 28;14:3507-3517. doi: 10.2147/OPTH.S271646. eCollection 2020. Clin Ophthalmol. 2020. PMID: 33149544 Free PMC article.
References
-
- Kass MA, Heuer DK, Higginbotham EJ, et al. The Ocular Hypertension Treatment Study: a randomized trial determines that topical ocular hypotensive medication delays or prevents the onset of primary open-angle glaucoma. Arch Ophthalmol. 2002;120:701–713. doi: 10.1001/archopht.120.6.701. - DOI - PubMed
-
- The AGIS Investigators. The Advanced Glaucoma Intervention Study (AGIS): 7. The relationship between control of intraocular pressure and visual field deterioration. Am J Ophthalmol 2000;130:429–440. - PubMed
Publication types
MeSH terms
Associated data
LinkOut - more resources
Full Text Sources
