. 2019 Aug 22;178(5):1088-1101.e15.
doi: 10.1016/j.cell.2019.07.049.

The Bone Marrow Protects and Optimizes Immunological Memory during Dietary Restriction

Affiliations

The Bone Marrow Protects and Optimizes Immunological Memory during Dietary Restriction

Nicholas Collins et al. Cell. .

Abstract

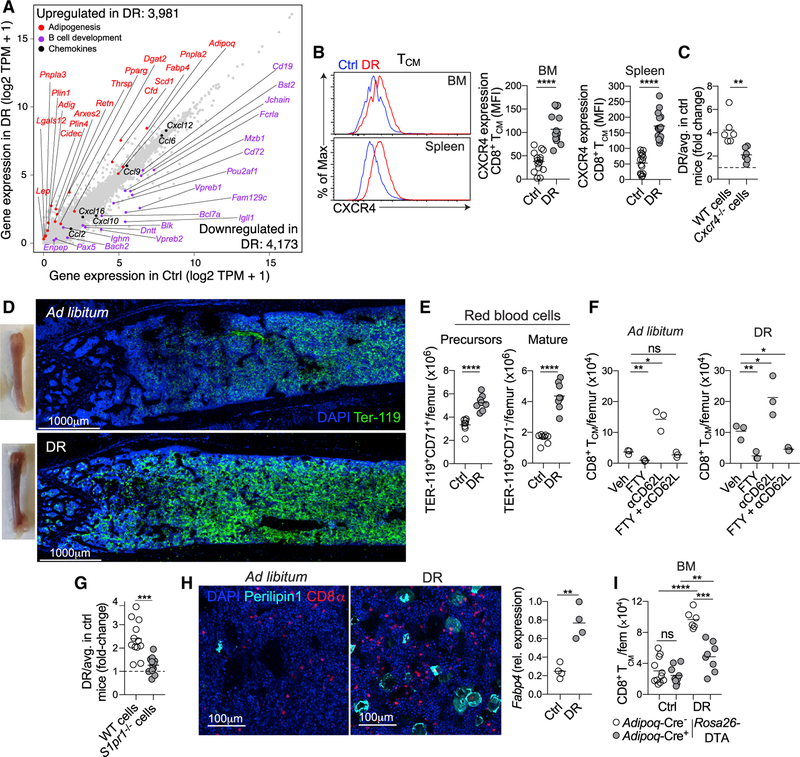
Mammals evolved in the face of fluctuating food availability. How the immune system adapts to transient nutritional stress remains poorly understood. Here, we show that memory T cells collapsed in secondary lymphoid organs in the context of dietary restriction (DR) but dramatically accumulated within the bone marrow (BM), where they adopted a state associated with energy conservation. This response was coordinated by glucocorticoids and associated with a profound remodeling of the BM compartment, which included an increase in T cell homing factors, erythropoiesis, and adipogenesis. Adipocytes, as well as CXCR4-CXCL12 and S1P-S1P1R interactions, contributed to enhanced T cell accumulation in BM during DR. Memory T cell homing to BM during DR was associated with enhanced protection against infections and tumors. Together, this work uncovers a fundamental host strategy to sustain and optimize immunological memory during nutritional challenges that involved a temporal and spatial reorganization of the memory pool within "safe haven" compartments.


Figures

Figure 1.
Figure 1.. Memory T Cells Accumulate in BM during DR
(A) Number of CD8+ CD44+ T cells in spleen (spl), cervical lymph node (cLN), blood, and gonadal adipose tissue (GAT) over time during 50% DR. (B) Number of CD8+ CD44+ T cells in femur BM of mice on DR over time. (C) Confocal microscopy of CD4+ (magenta) and CD8+ (yellow) T cells in BM after 3 weeks of DR. (D) Number of CD8+ CD44+ T cells in BM from tibia, skull, thoracic vertebrate, humerus, and ilium of mice on DR for 3–6 weeks. (E) Mice were infected and 4 weeks later put on DR for 4–6 weeks. (F and G) (F) Number of memory CD8+ T cells in GAT, spl, and BM specific for the YopE antigen of Yersinia pseudotuberculolsis or (G) the nucleoprotein antigen of influenza A virus after 4–6 weeks of DR. (legend continued on next page) (H) Number of CD8+ CD44+ T cells in BM and spl of mice fed the indicated diet ad libitum or at 50% restriction for 3 weeks. (I) Number of CD8+ CD44+ T cells in BM and spl of mice on DR for 3 weeks or on DR for 3 weeks then refed ad libitum for a further 1 or 3 week(s). Each symbol represents an individual mouse. Data show the mean representative of four (C) or pooled from two to four experiments (A, B, D, and F–I) with two to five mice per group. *p < 0.05, **p < 0.01, ***p < 0.001, ****p < 0.0001; two-tailed unpaired Student’s t test. See also Figure S1.
Figure 2.
Figure 2.. Circulating Memory T Cells Accumulate in BM during DR
(A) Number of CD8+ TCM (CD44+ CD62L+ CD69), TEM (CD44+ CD62L CD69), and TRM (CD44+ CD62L CD69+) in the indicated tissue of mice on DR for 3–4 weeks. (B) Plot showing CD62L and CD69 expression by CD8+ CD44+ cells in BM. Number of the indicated subset in BM from mice on DR for 3–4 weeks. (C) Purified CD8+ CD44+ T cells were transferred into hosts fed ad libitum or on DR. Number of transferred cells in BM and spl after 1 week is shown. (D) Congenically distinct mice were put on DR for 1 week and joined to form parabiotic pairs then maintained on DR for 3 weeks. Control pairs were fed ad libitum throughout. (E) Frequency of host-derived memory T cells in spl and BM from (D). (F) In vitro activated OT-I mTomato+ T cells (pseudocolored green) were transferred into hosts fed ad libitum or on DR for 3 weeks and skull BM was imaged 1 week later. Images show representative frames. Bottom images show track displacement length from 0–25 or more μm. (legend continued on next page) (G) Speed and track displacement length of OT-I cells in skull BM of mice on DR. Each symbol represents an individual mouse except for (F), in which each symbol represents an individual cell. Data show the mean pooled from two (A, C, and E) or three experiments (B and G) or representative of three experiments (F). **p < 0.01, ***p < 0.001, ****p < 0.0001; ns, not significant. Two-tailed unpaired Student’s t test. ND, not detected. See also Figure S2 and Video S1.
Figure 3.
Figure 3.. GCs Drive Memory T Cells into BM during DR
(A) Concentration of corticosterone in serum and theextracellular environment of BM in mice on DR for 3 weeks. (B) Frequency of DAPI+ cells in spl and BM of mice on DR for 1 week. (C) BCL-2 expression by BM TCM in mice fed ad libitum (blue) or on DR (red) for 3 weeks. (D) Mice received sham surgery or an adrenalectomy (ADX) 1 week prior to being put on DR for 1 week. Graphs show number of TCM in spl and BM. (E and F) (E) Number of TCM in spl and BM and (F) BCL-2 expression by these cells in mice fed ad libitum that were administered veh (blue) or dex (red) daily for 2 weeks. (G) WT or Nr3c1fl/fl x Lck-Cre mice (Cre; WT, Cre+; Nr3c1−/−) CD8+ CD44+ T cells were transferred into mice fed ad libitum or on DR for 3 weeks. Cells were enumerated 1 week post transfer. Graphs show transferred cells recovered in spl and BM, expressed as the fold-change in DR mice over the average number found in mice fed ad libitum. Each symbol represents an individual mouse. Data show the mean, pooled from 3 (A) or 2 (B–G) experiments. **p < 0.01, ***p < 0.001, ****p < 0.0001, ns; not significant. Two-tailed unpaired Student’s t test. See also Figure S3.
Figure 4.
Figure 4.. BM Remodeling during DR Promotes Memory T Cell Recruitment and Retention
(A) Scatterplot showing gene expression of whole-BM samples from mice fed ad libitum or on DR for 3 weeks. TPR, transcripts per million. (B) CXCR4 expression by TCM in BM and spl of mice fed ad libitum (blue) or on DR (red). (C) CD8+ T cells from Cxcr4fl/fl 3 UBC-CreERT2 (Cre; WT, Cre+; Cxcr4−/−) mice treated with tamoxifen were in vitro activated and transferred into mice fed ad libitum or on DR for 3 weeks. Analysis was performed 1 week post transfer. Graphs expressed in the same way as 3G. (D) Images of BM from mice on DR for 3 weeks, showing TEr-119 (green) and DAPI (blue). (E) Number of RBC (CD71+ precursors and CD71 mature cells) in BM of mice on DR for 3 weeks. (F) Number of CD8+ TCM in BM after 1 week of DR treated with FTY720 (FTY), an anti-CD62L antibody, or a combination of both. Treatment commenced at same time as initiation of DR. (G) CD8+ T cells from S1pr1fl/fl x UBC-CreERT2 (Cre; WT, Cre+; S1pr1−/−) mice that had been treated with tamoxifen were activated in vitro and transferred into mice fed ad libitum or on DR for 3 weeks. Graph expressed in same way as 3G. (H) Image showing BM of mice on DR for 3 weeks, staining for adipocytes by PERILIPIN-1 (cyan), CD8+ T cells (red), and DAPI (blue). Graph shows Fabp4 gene expression in whole BM as determined by qPCR. (I) Adipoq-CreERT2 3 Rosa26-DTA mice were put on DR for 2 weeks, treated with tamoxifen, and then maintained on DR for 3 weeks. Graph shows the number of CD8+ TCM in BM. Each symbol represents an individual mouse except for (A), in which each symbol represents an individual gene. Data show the mean representative of at least two (D, F, and H) or pooled from two (C, E, and I) or three (A, B, and G) experiments with three to five mice per group. *p < 0.05, **p < 0.01, ***p < 0.001, ****p < 0.0001; two-tailed unpaired Student’s t test. ns, not significant. See also Figure S4.
Figure 5.
Figure 5.. Memory T Cells Are in a State of Energy Conservation during DR
(A and B) CD8+ TCM were sorted from spl and BM of mice fed ad libitum or on DR for 3 weeks for RNA sequencing. (A) GO terms and (B) GSEA from genes upregulated in TCM from BM (blue) or spl (green) of mice on DR. (C and D) (C) OCR and (D) SRC in TCM from SLO and BM of mice on DR for 3 weeks. (E) Expression of phosphorylated mTOR2448, S6240/244, and AKT473 in TCM from spl and BM of mice on DR for 3 weeks. Each symbol represents an individual mouse except for (C), which is pooled from 10–15 mice. Data are expressed as mean, or mean ± SD, pooled from three biological replicates with five mice per group (A and B), representative of 3 (C), or pooled from three to four experiments (D and E). *p < 0.05, ***p < 0.001, ****p < 0.0001; ns, not significant. Two-tailed unpaired Student’s t test. See also Figure S5.
Figure 6.
Figure 6.. Memory T Cells Mediate Enhanced Protection against Secondary Challenges during DR
(A) Mice that were naive or previously infected with the Yptb ΔyopM orally were put on DR for 3 weeks and challenged i.v. with the more virulent WT strain of Yptb. Bacterial burden was assessed in spl 2 days after challenge. CD4+ or CD8+ T cells were depleted prior to challenge in the indicated groups. (B) Mice were infected with Yptb ΔyopM orally then 4 weeks later put on DR for 3 weeks. During DR, mice were challenged orally with WT Yptb. Bacterial burden was assessed in mesenteric lymph nodes 3 days after challenge. (C) IFNγ production following PMA/ionomycin stimulation by Yptb-specific splenic memory CD8+ T cells at day 2 after i.v. challenge with WT Yptb. (D) Mice previously infected with Yptb ΔyopM orally were put on DR for approximately 5 weeks. Two weeks into DR, mice were treated with FTY720 four times every other day followed by a 2-week period before i.v. challenge with WT Yptb. Bacterial burden was assessed in spl 2 days after challenge. (E) Mice received naive pmel cells followed by an i.v. infection with vaccinia-hgp100. 1 month later, mice were put on 50% DR for 3 weeks and inoculated with B16 cells subcutaneously (s.c.). Mice were euthanized when tumors reached 15 mm × 15 mm. (F) Circulating GCs are increased during DR, inducing memory T cell recruitment and retention in BM, a site with low levels of GCs. The BM is drasticallyremodeled during DR to contain increased adipocytes, RBCs, and CXCL12, which have the potential to maintain memory T cells in this niche. Once in BM during DR, memory T cells express optimal levels of BCL-2 and mTOR to promote survival. Upon secondary challenges, memory T cells have an enhanced ability to mediate protection during DR. Each symbol represents an individual mouse. Data show the mean pooled from at least two (A, B, and E), 4 (C), or 3 (D) experiments. *p < 0.05, **p < 0.01, ***p < 0.001, ****p < 0.0001; ns, not significant. Two-tailed unpaired Student’s t test except for (E), which was performed by a log-rank (Mantel-Cox) test. See also Figure S6.

Comment in

References

    1. Acosta-Rodríguez VA, de Groot MHM, Rijo-Ferreira F, Green CB, and Takahashi JS (2017). Mice under Caloric Restriction Self-Impose a Temporal Restriction of Food Intake as Revealed by an Automated Feeder System. Cell Metab. 26, 267–277. - PMC - PubMed
    1. Araki K, Turner AP, Shaffer VO, Gangappa S, Keller SA, Bachmann MF, Larsen CP, and Ahmed R. (2009). mTOR regulates memory CD8 T-cell differentiation. Nature 460, 108–112. - PMC - PubMed
    1. Aramburu J, Ortells MC, Tejedor S, Buxadé M, and Lόpez-Rodríguez C. (2014). Transcriptional regulation of the stress response by mTOR. Sci. Signal. 7, re2. - PubMed
    1. Arojo OA, Ouyang X, Liu D, Meng T, Kaech SM, Pereira JP, and Su B. (2018). Active mTORC2 Signaling in Naive T Cells Suppresses Bone Marrow Homing by Inhibiting CXCR4 Expression. J. Immunol. 201, 908–915. - PubMed
    1. Becker TC, Coley SM, Wherry EJ, and Ahmed R. (2005). Bone marrow is a preferred site for homeostatic proliferation of memory CD8 T cells. J. Immunol. 174, 1269–1273. - PubMed

Publication types

MeSH terms