. 2019 Aug 22;178(5):1102-1114.e17.
doi: 10.1016/j.cell.2019.07.050.

Dietary Intake Regulates the Circulating Inflammatory Monocyte Pool

Affiliations

Dietary Intake Regulates the Circulating Inflammatory Monocyte Pool

Stefan Jordan et al. Cell. .

Abstract

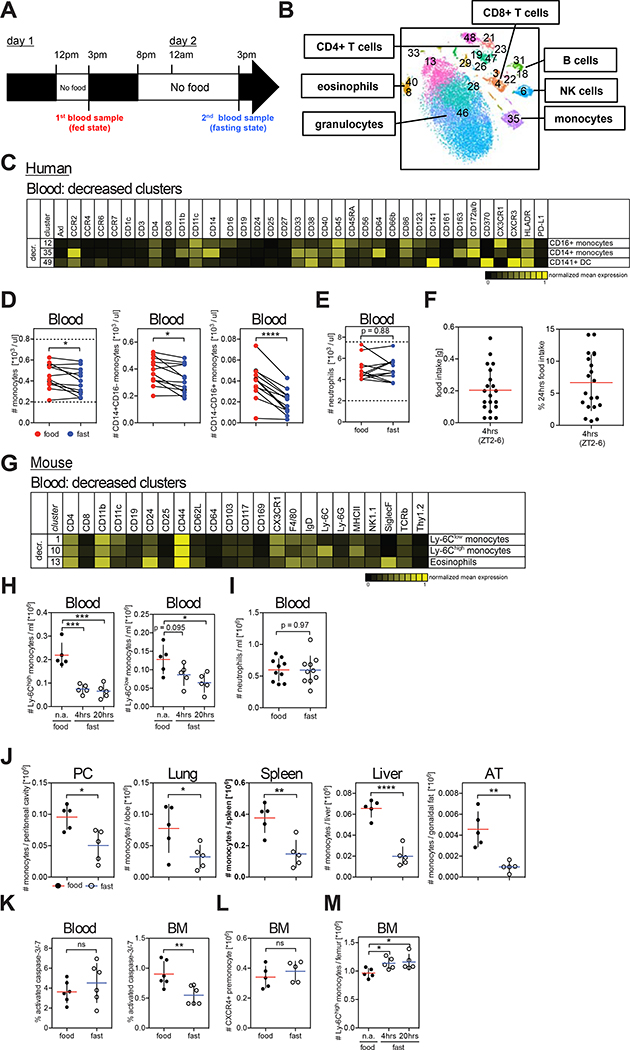
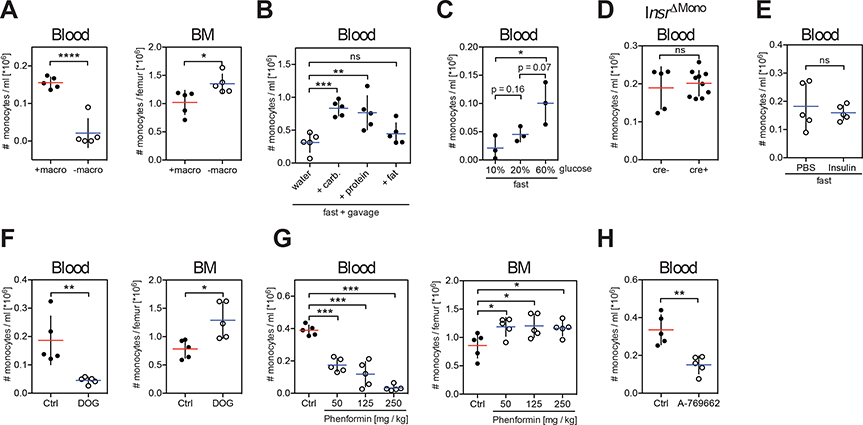
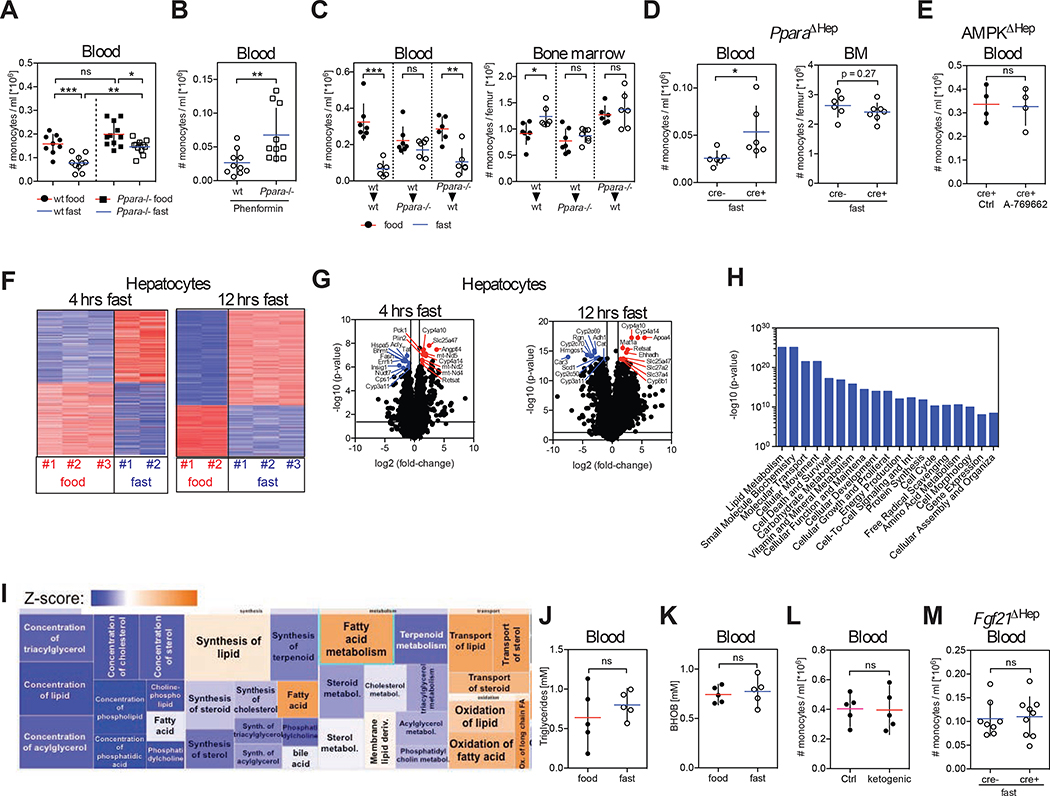
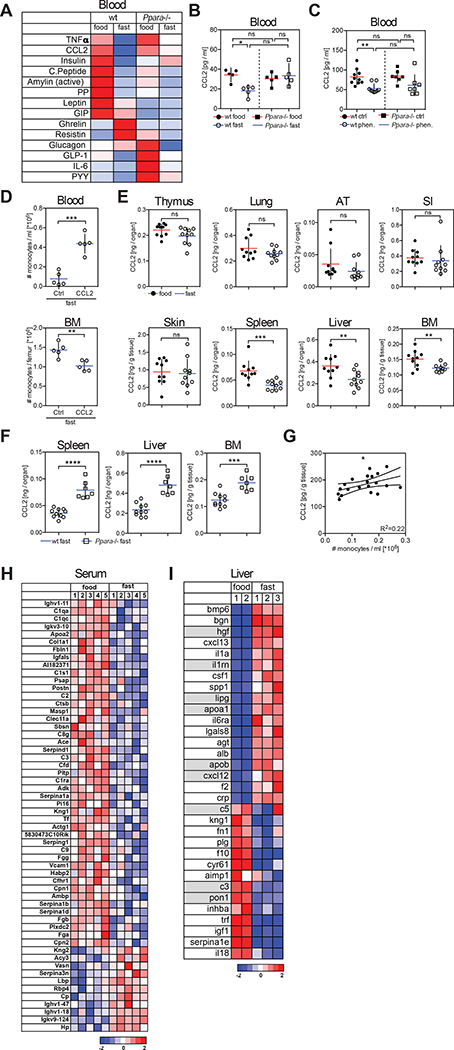
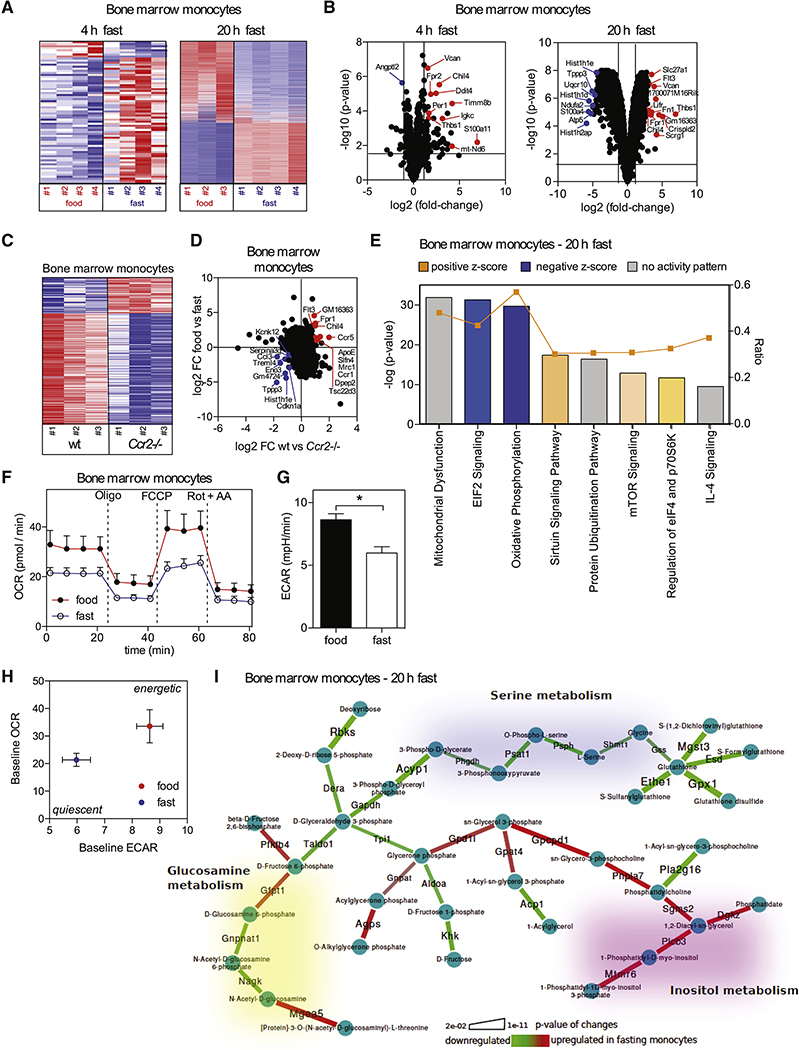
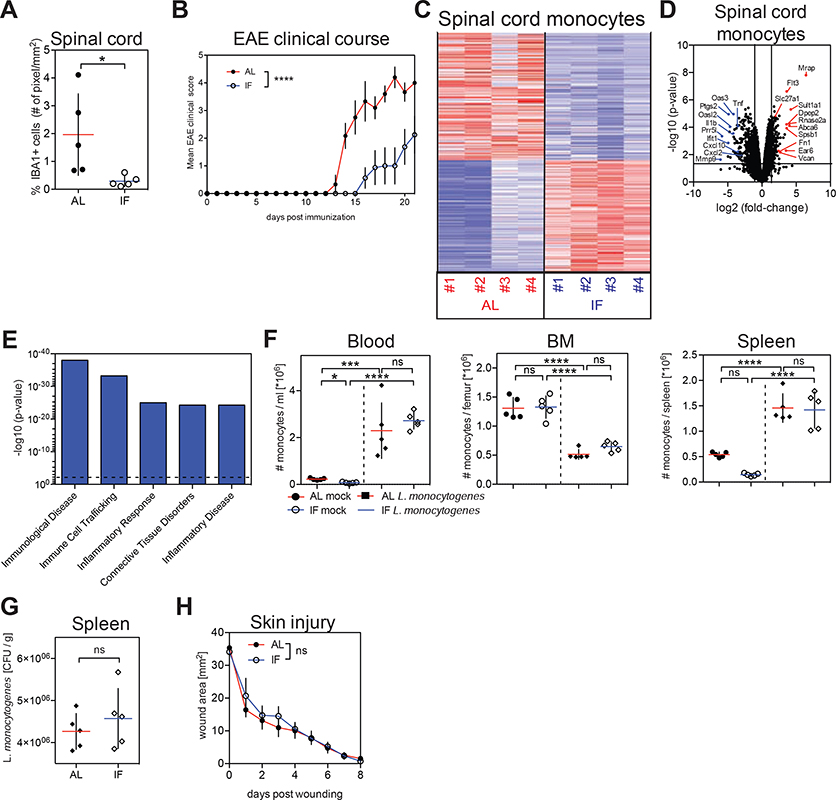
Caloric restriction is known to improve inflammatory and autoimmune diseases. However, the mechanisms by which reduced caloric intake modulates inflammation are poorly understood. Here we show that short-term fasting reduced monocyte metabolic and inflammatory activity and drastically reduced the number of circulating monocytes. Regulation of peripheral monocyte numbers was dependent on dietary glucose and protein levels. Specifically, we found that activation of the low-energy sensor 5'-AMP-activated protein kinase (AMPK) in hepatocytes and suppression of systemic CCL2 production by peroxisome proliferator-activator receptor alpha (PPARα) reduced monocyte mobilization from the bone marrow. Importantly, we show that fasting improves chronic inflammatory diseases without compromising monocyte emergency mobilization during acute infectious inflammation and tissue repair. These results reveal that caloric intake and liver energy sensors dictate the blood and tissue immune tone and link dietary habits to inflammatory disease outcome.

Keywords: AMPK; CCL2; Caloric restriction; PPARα; fasting; inflammation; inflammatory disease; liver; metabolism; monocyte.


Conflict of interest statement

DECLARATION OF INTERESTS

The authors declare no competing interests.

Figures

Figure 1.
Figure 1.. Fasting Reduces the Number of Circulating Pro-inflammatory Monocytes in Healthy Humans and in Mice
(A) Schematic representation of the fasting experimental design. (B to E) Blood was drawn from healthy individuals in the fed and in the fasting state and analyzed by CyTOF. (B) Multidimensional CyTOF data were clustered using viSNE. (C) Heatmap shows mean markers expression on cell clusters significantly reduced during fasting. (D and E) Paired analysis of (D) total monocytes, CD14+CD16− monocytes, and CD14−CD16+ monocytes, and (E) neutrophils in human blood during the fed and the fasted state. Dotted lines indicate physiologic range. (F) Food intake of individual mice during 4 hrs between ZT2 and ZT6, and percentage of food intake between ZT2 and ZT6 with regard to 24 hr food intake. (G) CyTOF analysis of blood cells from mice that were fed or fasted for 4 hrs. Heatmap shows mean marker expression of clusters significantly reduced by short-term fasting. (H) Absolute numbers of Ly-6Chigh and Ly-6Clow monocytes in the blood of mice that were fed or fasted for the indicated time. (I) Absolute numbers of neutrophils in the blood of mice that were fed or fasted for 20 hrs. (J) Absolute numbers of Ly-6Chigh monocytes in the peritoneal cavity (PC), lung, spleen, liver and adipose tissue (AT) of mice that were fed or fasted for 20 hrs. (K) Percentage of caspase-3/7+ cells among Ly-6Chigh monocytes in the blood and bone marrow (BM) of mice that were fed or fasted for 4 hrs. (L) Numbers of bone marrow CXCR4+ pre-monocytes in mice that were fed or fasted for 20 hrs. (M) Absolute numbers of bone marrow Ly-6Chigh monocytes in mice that were fed or fasted for the indicated time. (F, H to M) Every dot represents one individual animal. Horizontal bar = mean. Vertical bar = SD. Student’s t test (D, E, I to L) or one-way analysis of variance (ANOVA) with Dunnett’s multiple comparison test (H, M) were performed. Statistical significance is indicated by *P < 0.05, **P < 0.01, ***P < 0.001, ****P < 0.0001. ns = not significant. See also Figure S1.
Figure 2.
Figure 2.. The Energy-sensor AMP-activated Protein Kinase (AMPK) Controls Blood Monocyte Homeostasis
(A to H) Absolute numbers of Ly-6Chigh monocytes (A) in the blood and bone marrow (BM) of mice fed with a diet with (+macro) or without (−macro) macronutrients, (B) in the blood of fasting mice gavaged with water, isocaloric amounts of carbohydrates, protein or fat for 4 hrs, (C) in the blood of mice fasted for 16 hrs and gavaged with glucose solutions at the indicated concentrations, (D) in the blood of fed mice in which the insulin receptor has been deleted from monocytes (InsrΔMono), (E) in the blood of mice that were fasted for 4 hrs and injected with insulin 30 minutes prior to analysis, (F) in the blood and bone marrow of mice that were gavaged with water (Ctrl) or 2-deoxyglucose (DOG) once every hour for 4 hrs, (G) in the blood and bone marrow of mice that received water (Ctrl) or a single dose of phenformin 4 hrs before assessment, (H) in blood of mice that were gavaged with AMPK activator A-769662 4 hrs before analysis. (A to H) Every dot represents one individual animal. Horizontal bar = mean. Vertical bar = SD. One-way analysis of variance (ANOVA) with Tukey’s multiple comparison test (C) or Dunnett’s test (B, G), or Student’s t test (A, D to F, H) were performed. Statistical significance is indicated by *P < 0.05, **P < 0.01, ***P < 0.001, ****P < 0.0001. ns = not significant. See also Figure S2.
Figure 3.
Figure 3.. Liver Fasting Metabolism Regulator PPARα Controls Peripheral Monocyte Numbers in the Steady State
(A and B) Absolute numbers of Ly-6Chigh monocytes were measured (A) in the blood of wild-type and Ppara−/− mice that were fed or fasted for 4 hrs, and (B) in the blood of wild-type and Ppara−/− mice gavaged with phenformin 4 hrs prior to analysis. (C). Bone marrow chimeric mice were generated so that wild-type mice (wt) were reconstituted with wt or Ppara−/− bone marrow cells, and Ppara−/− mice were reconstituted with wt bone marrow cells. Seven weeks after reconstitution half of the mice from each group were fasted for 20 hrs and the absolute numbers of Ly-6Chigh monocytes in the blood and bone marrow of each bone marrow chimeric group were measured. (D) Albcre/cre mice were crossed to Pparafl/fl mice to delete PPARα from hepatocytes (PparaΔHep) in cre+ mice. Graph shows absolute numbers of Ly-6Chigh monocytes in the blood circulation and bone marrow of cre− and cre+ mice after 20 hrs of fasting. (E) Albcre/cre mice were crossed to Prkaa1fl/fl mice to delete AMPK from hepatocytes (AMPKΔHep). Numbers of Ly-6Chigh monocytes in blood of cre+ mice that were gavaged with control solvent or A-769662 4 hrs before analysis are shown. (F) Heatmap shows z-scores of differentially expressed genes in hepatocytes after 4 hrs and 12 hrs of fasting. (G) Volcano plot identifies 10 most up- and downregulated transcripts in hepatocytes after 4 hrs and 12 hrs of fasting. (H and I) Ingenuity Pathway Analysis (IPA) of differential expressed genes in hepatocytes after 4 hrs of fasting. (H) Bar chart shows most significantly altered cellular functions. (I) Detailed view of molecular functions within lipid metabolism that are affected during fasting. (J and K) Levels of (J) triglycerides and (K) β-hydroxybutyrate (BHOB) in the blood of mice that were fed or fasted for 4 hrs. (L) Ly-6Chigh monocytes in blood of mice that were fed with ketogenic or control diet for 3 weeks. (M) Albcre/cre mice were crossed to Fgf21fl/fl mice to delete Fgf21 from hepatocytes (Fgf21ΔHep) and cre− or cre+ mice were fasted for 4 hrs. Graph shows absolute numbers of Ly-6Chigh monocytes in the blood. (A) Data were pooled from two experiments. (A to E, J to M) Every dot represents one individual animal. Horizontal bar = mean. Vertical bar = SD. One-way analysis of variance (ANOVA) with Bonferroni’s test (A), or Student’s t test (B to E, J to M) were performed. Statistical significance is indicated by *P < 0.05, **P < 0.01, ***P < 0.001. ns = not significant. See also Figure S3.
Figure 4.
Figure 4.. PPARα Controls Tissue CCL2 Levels in the Steady-State
(A) Multiplex analysis for metabolic hormones in the blood of mice that were fed or fasted for 4 hrs. (B) CCL2 levels in blood of wild-type (wt) and Ppara−/− mice that were fed or fasted for 4 hrs. (C) CCL2 levels in blood of wild-type (wt) and Ppara−/− mice that were gavaged with water (Ctrl) or with a single dose of phenformin 4 hrs before analysis. Data were pooled from two experiments. (D) Mice were fasted for 20 hrs before injection of PBS or recombinant CCL2 and were analyzed 3 hrs after injection. Graphs show the absolute numbers of Ly-6Chigh monocytes in the blood and bone marrow. (E) CCL2 protein in indicated tissues from wt mice that were fed or fasted for 4 hrs. AT = adipose tissue, SI = small intestine. (F) CCL2 protein in the indicated tissues in wt and Ppara−/− mice that were fasted for 4 hrs. (G) Plot shows CCL2 production in BM vs. monocyte numbers in blood. (H) Heatmap shows z-scores of significantly changing serum protein levels in mice that were fed or fasted for 20 hrs. (I) Differentially expressed genes in liver after 20 hrs of fasting were filtered using the IPA database. Heatmap shows z-scores of genes coding proteins that are annotated to be secreted to the extracellular space and to regulate CCL2. Genes annotated to be regulated by PPARα are shaded. (B to G) Every dot represents one individual animal. Horizontal bar = mean. Vertical bar = SD. One-way analysis of variance (ANOVA) with Tukey’s post test (B) or Bonferroni’s post test (C), or Student’s t test (D to F) were performed. Statistical significance is indicated by *P < 0.05, **P < 0.01, ***P < 0.001, ****P < 0.0001. ns = not significant. See also Figure S4.
Figure 5.
Figure 5.. Fasting Modifies Monocyte Metabolic Activity
(A) Heatmaps display z-scores for differentially expressed genes in monocytes purified from the bone marrow of mice that were fed or fasted for the indicated time. (B) Volcano plots show top up- and down-regulated transcripts in monocytes from mice that were fasted for the indicated time compared to monocytes from fed mice. (C) Heatmap displays z-scores for differentially expressed genes in monocytes from bone marrow of wt and Ccr2−/− mice. (D) Differentially expressed genes in monocytes between wt and Ccr2−/− mice were mapped on differentially expressed genes from monocytes between mice that were fed or fasted for 20 hrs. (E) Ingenuity Pathway Analysis (IPA) of differentially expressed genes in monocytes between mice that were fed and fasted for 20 hrs. (F) Oxygen consumption rate (OCR) of bone marrow monocytes from mice that were fed or fasted for 20 hrs. Oligo = oligomycin, inhibits ATP-synthase; FCCP = carbonyl cyanide-4 (trifluoromethoxy)phenylhydrazone, mitochondrial uncoupler; Rot + AA = rotenone + antimycin A, CI and CIII inhibitors, respectively. Vertical bars = SEM. (G) Basal extracellular acidification rate (ECAR) of bone marrow monocytes from mice that were fed or fasted for 20 hrs. Vertical bars = SEM. (H) Basal OCR vs. basal ECAR (mean +/− SEM for both parameters). (I) Integrated metabolic network analysis of the transcriptional differences in monocytes between mice that were fed or fasted for 20 hrs. Graphical representation of the regulated metabolic subnetwork.
Figure 6.
Figure 6.. Fasting Improves Chronic Inflammatory Disease Outcome Without Compromising Monocyte Emergency Mobilization During Acute Inflammation
(A and B) Mice were fed ad libitum (AL) or subjected to intermittent fasting in 24 hr cycles (IF) for 4 weeks before EAE induction and during disease development. (A) Proportion of IBA1+ myeloid cells in spinal cords and (B) and EAE clinical course. (C, D, E) Monocytes were purified from spinal cords of mice that were induced with EAE and were fed ad libitum (AL) or subjected to intermittent fasting in 24 hr cycles (IF) for 4 weeks before EAE induction and during disease development. (C) Heatmap displays z-scores for differentially expressed genes. (D) Volcano plots show top up- and down-regulated transcripts. (E) Differentially expressed genes were analyzed using Ingenuity Pathway Analysis (IPA). Bar graph shows p-values of most significantly regulated gene modules. Dotted line = threshold. (F, G) Mice were fed ad libitum (AL) or subjected to intermittent fasting in 24 hr cycles (IF) for 6 weeks prior to infection with L. monocytogenes. (F) Absolute numbers of Ly-6Chigh monocytes in in the indicated tissues. (G) L. monocytogenes colony-forming units (CFU) in the spleen. (H) Wound healing kinetics in mice that were fed ad libitum (AL) or subjected to intermittent fasting in 24 hr cycles (IF) for 4 weeks prior to wounding. (A, F, G) Every dot represents one individual animal. Horizontal bar = mean. Vertical bar = SD. Two-way analysis of variance (ANOVA) (B, H) or One-way ANOVA with Bonferroni’s post test (F) or Student’s t test (A, G) were performed. Statistical significance is indicated by *P < 0.05, ***P < 0.001, ****P < 0.0001. ns = not significant. See also Figure S6.

Comment in

References

    1. Ajami B, Bennett JL, Krieger C, McNagny KM, and Rossi FM (2011). Infiltrating monocytes trigger EAE progression, but do not contribute to the resident microglia pool. Nat Neurosci 14, 1142–1149. - PubMed
    1. Aksungar FB, Topkaya AE, and Akyildiz M (2007). Interleukin-6, C-reactive protein and biochemical parameters during prolonged intermittent fasting. Ann Nutr Metab 51, 88–95. - PubMed
    1. Boniakowski AE, Kimball AS, Joshi A, Schaller M, Davis FM, denDekker A, Obi AT, Moore BB, Kunkel SL, and Gallagher KA (2018). Murine macrophage chemokine receptor CCR2 plays a crucial role in macrophage recruitment and regulated inflammation in wound healing. European journal of immunology 48, 1445–1455. - PMC - PubMed
    1. Brandhorst S, Wei M, Hwang S, Morgan TE, and Longo VD (2013). Short-term calorie and protein restriction provide partial protection from chemotoxicity but do not delay glioma progression. Exp Gerontol 48, 1120–1128. - PMC - PubMed
    1. Brocker CN, Yue J, Kim D, Qu A, Bonzo JA, and Gonzalez FJ (2017). Hepatocyte-specific PPARA expression exclusively promotes agonist-induced cell proliferation without influence from nonparenchymal cells. American journal of physiology Gastrointestinal and liver physiology 312, G283–G299. - PMC - PubMed

Publication types

MeSH terms