. 2019 Aug 22;178(5):1115-1131.e15.
doi: 10.1016/j.cell.2019.07.048.

Ketone Body Signaling Mediates Intestinal Stem Cell Homeostasis and Adaptation to Diet

Affiliations

Ketone Body Signaling Mediates Intestinal Stem Cell Homeostasis and Adaptation to Diet

Chia-Wei Cheng et al. Cell. .

Abstract

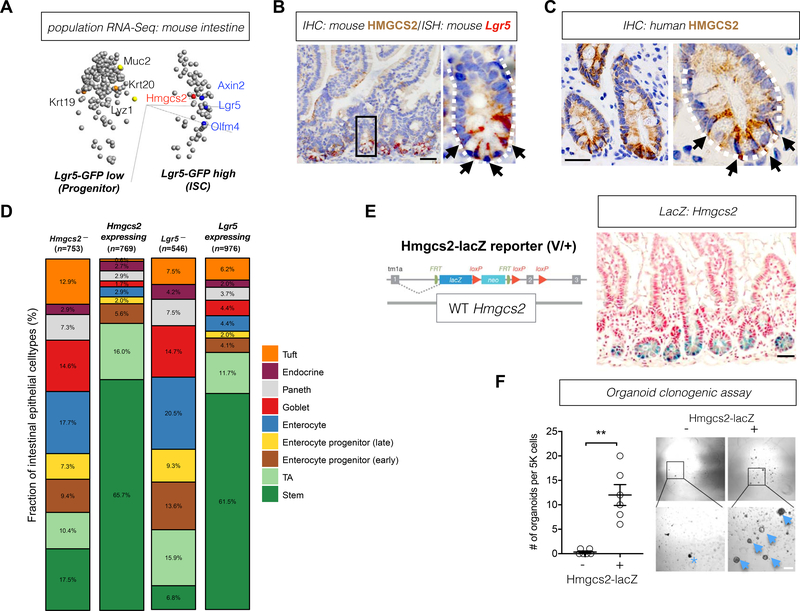
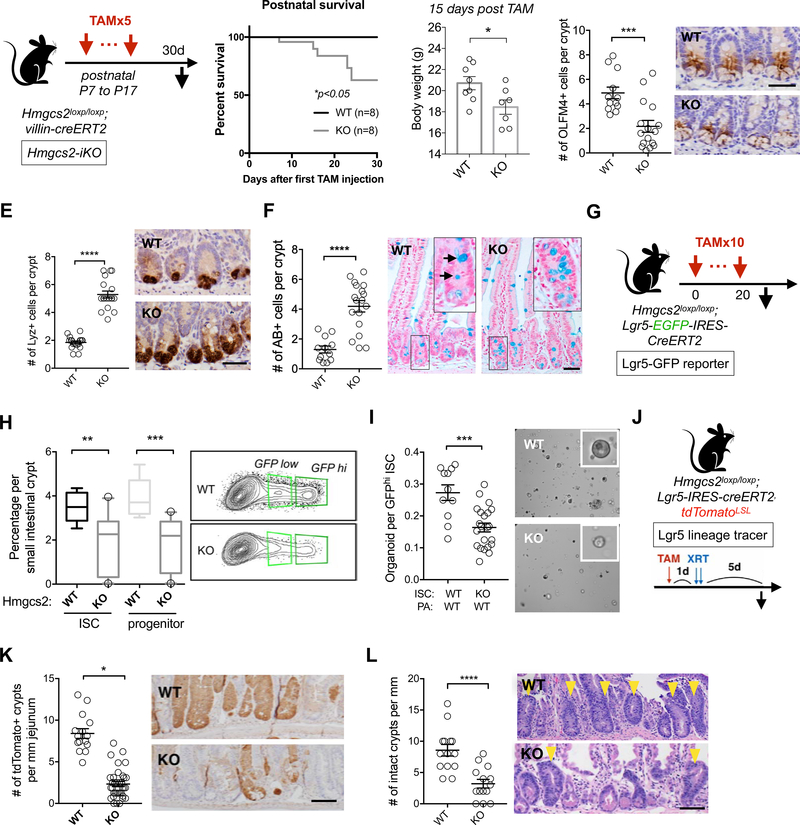
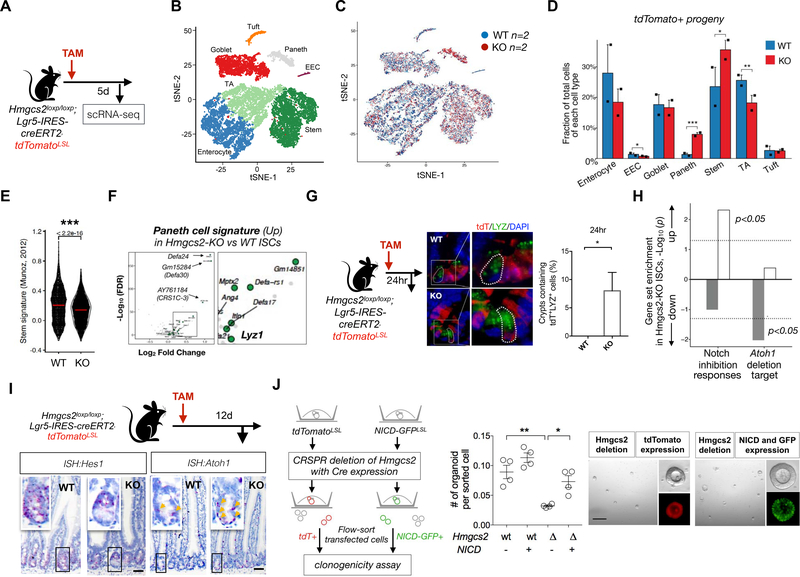
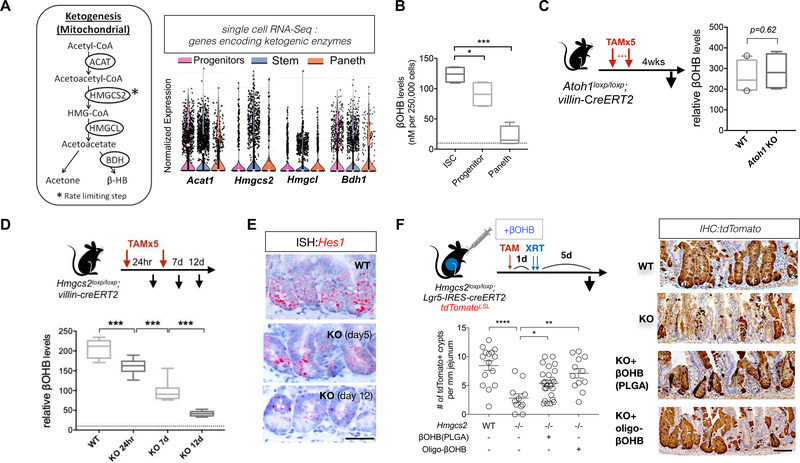
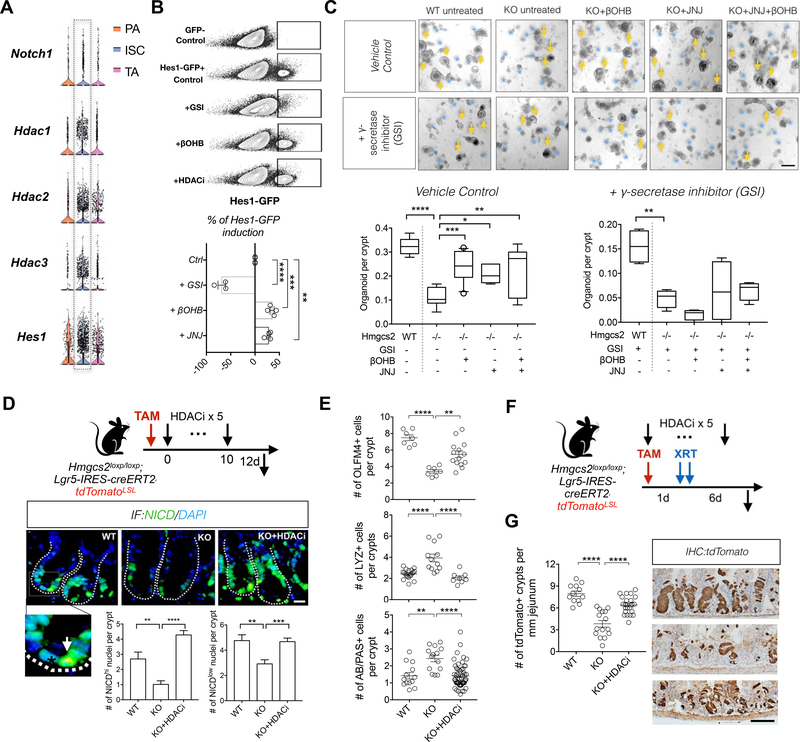
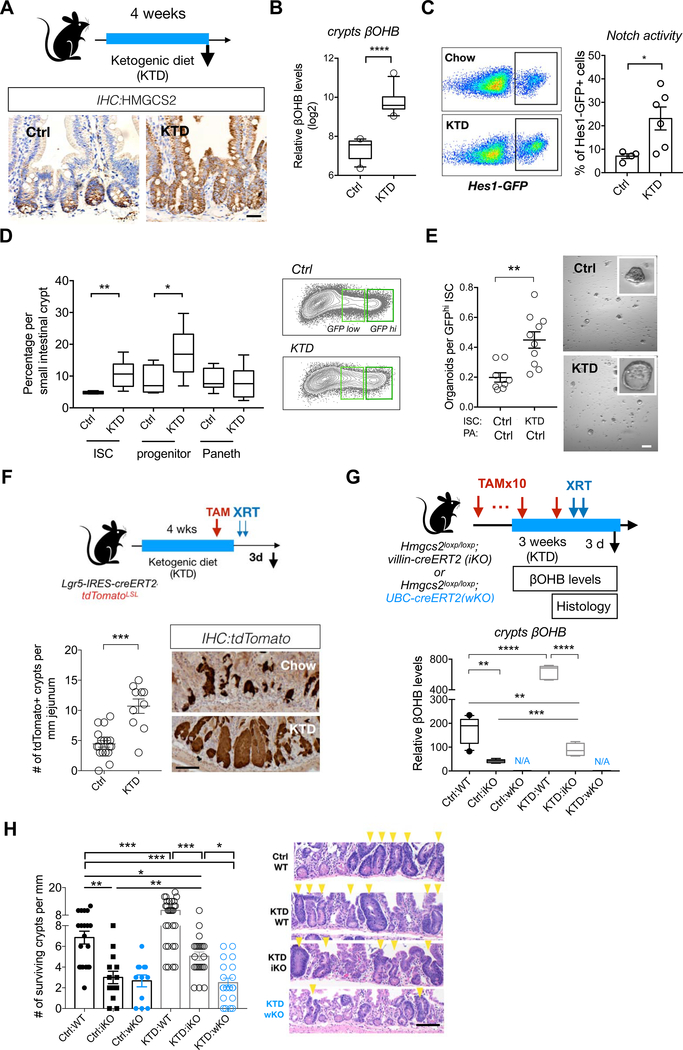
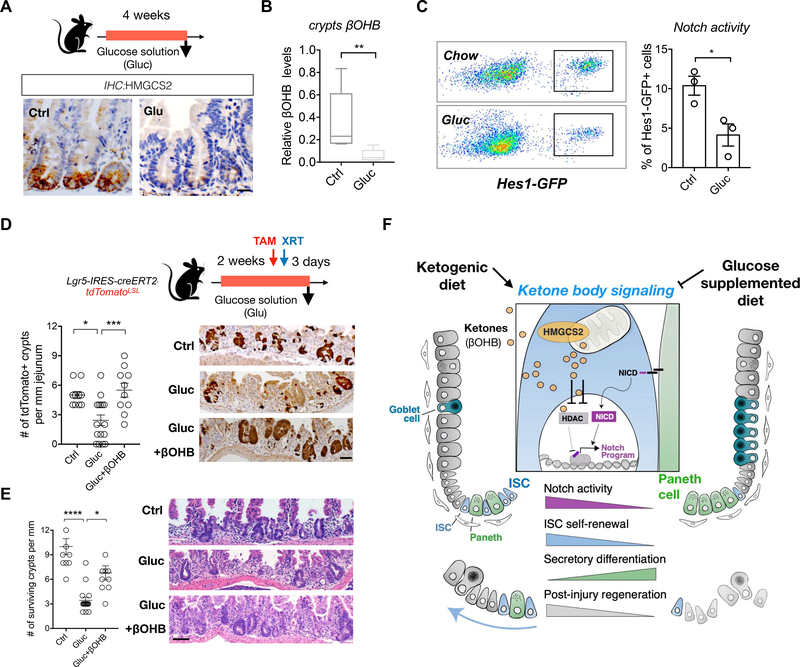
Little is known about how metabolites couple tissue-specific stem cell function with physiology. Here we show that, in the mammalian small intestine, the expression of Hmgcs2 (3-hydroxy-3-methylglutaryl-CoA synthetase 2), the gene encoding the rate-limiting enzyme in the production of ketone bodies, including beta-hydroxybutyrate (βOHB), distinguishes self-renewing Lgr5+ stem cells (ISCs) from differentiated cell types. Hmgcs2 loss depletes βOHB levels in Lgr5+ ISCs and skews their differentiation toward secretory cell fates, which can be rescued by exogenous βOHB and class I histone deacetylase (HDAC) inhibitor treatment. Mechanistically, βOHB acts by inhibiting HDACs to reinforce Notch signaling, instructing ISC self-renewal and lineage decisions. Notably, although a high-fat ketogenic diet elevates ISC function and post-injury regeneration through βOHB-mediated Notch signaling, a glucose-supplemented diet has the opposite effects. These findings reveal how control of βOHB-activated signaling in ISCs by diet helps to fine-tune stem cell adaptation in homeostasis and injury.

Keywords: HDAC; Hmgcs2; Intestinal stem cell; Notch; beta-hydroxybutyrate; ketogenic diet; ketone bodies.


Figures

Figure 1.
Figure 1.. HMGCS2 enriches for Lgr5+ intestinal stem cells (ISCs).
A, Principal component analysis (PCA) for genes differentially expressed in Lgr5-GFPlow progenitors versus Lgr5-GFPhi ISCs. Variance filtered by (ρ/ρmax)=5e-4; p=0.14, q=0.28; plot/total:25¾5578 variables. Axin2, axin-like protein 2; Hmgcs2, 3-Hydroxy-3-Methylglutaryl-CoA Synthase 2; Lgr5, Leucine-rich repeat-containing G-protein coupled receptor 5; Olfm4, Olfactomedin 4; n=4 mice. (see also Table S1). B, Mouse HMGCS2 protein expression by immunohistochemistry (IHC, brown) and Lgr5 expression by ISH (red). White-dashed line defines the intestinal crypt and black arrows indicate HMGCS2+ cells. The image represents one of 3 biological replicates. Scale bar, 50um. C, Human HMGCS2 protein expression by immunohistochemistry (IHC, brown). White-dashed line defines the intestinal crypt and black arrows indicate HMGCS2+ cells. The image represents one of 10 biological replicates. Scale bar, 50um. D, Stacked barplots show cell composition (%) of Hmgcs2-, Hmgcs2-expressing, Lgr5- and Lgr5-expressing intestinal epithelial cells. Numbers in parenthesis indicate the total number (n) of the noted cell populations. E, Hmgcs2-lacZ reporter construct where the lacZ-tagged allele reflects endogenous Hmgcs2 expression (left). Hmgcs2-lacZ expression (blue) in the small intestine (right). The image represents one of 3 biological replicates. Scale bar, 50um. F, Organoid-forming potential of flow-sorted Hmgcs2-lacZ and Hmgcs2-lacZ+ crypt epithelial cells (7AAD-EpCAM+). 5,000 cells from each population was flow-sorted into matrigel with crypt culture media. Arrows indicate organoids and asterisk indicates aborted organoid debris. The numbers of organoids formed from plated cells were quantified at 5 day in culture. Data represent mean+/−s.e.m. **p<0.01. n=6 samples from 3 mice. Scale bar: 20 μm.
Figure 2.
Figure 2.. Loss of Hmgcs2 compromises ISC self-renewal and differentiation.
A, Schematic of intestinal Hmgcs2 deletion in postnatal mice with Villin-CreERT2 (iKO) including the timeline for tamoxifen (TAM) injections and tissue collection. B, Kaplan–Meier survival curves of the WT and Hmgcs2-iKO mice starting the first day of tamoxifen injection. C, Body weights of WT and Hmgcs2-iKO mice. 15 days after first TAM injection. D-F, Quantification (left) and representative images (right) of Olfactomedin 4+ (OLFM4+) stem cells by IHC (D), Lysozyme + (LYZ+) Paneth cells by IHC and (E), Mucin+ goblet cells by Alcian Blue (AB) (F) in proximal jejunal crypts. n>5 mice per group. For D-F, mice were analyzed at the age of 37 days. For D-F, Scale bars, 100um. G, Schematic of Hmgcs2 deletion with Lgr5-EGFP-IRES-CreERT2 (Lgr5-GFP reporter) including the timeline for tamoxifen (TAM) injections and tissue collection.1 day after last TAM injection (Day 21), ISCs and Paneth cells from WT or conditional Hmgcs2-null (KO) intestinal crypts were isolated using flow cytometry. H, Frequency of 7AAD-/Epcam+/CD24-/Lgr5-GFPhi ISCs and Lgr5-GFPlow progenitors in crypt cells from WT and KO mice by flow cytometry. n>10 mice per group. I, Organoid-forming assay for sorted WT and KO ISCs co-cultured with WT Paneth cells. Representative images: day 5 organoids. n>10 mice per group. Scale bar: 100um. J, Schematic of the Lgr5 lineage tracing including timeline of TAM injection, irradiation (XRT, 7.5Gy x 2) and tissue collection. K-L, Quantification and representative images of tdTomato+ Lgr5+ ISC-derived progeny labeled by IHC for tdTomato (K) and number of surviving crypts assessed by the microcolony assay (L). Scale bar:100 μm. n>25 crypts per measurement, n>5 measurements per mouse and n>3 mice per group. For box- and-whisker plots (H), the data are expressed as 10 to 90 percentiles. For dot plots (C-F,I,K and L), the data are expressed as mean+/−s.e.m. *p<0.05, **p<0.01, ***p<0.005, ****p<0.001. n>25 crypts per measurement, n>3 measurements per mouse and n>5 mice per group.
Figure 3.
Figure 3.. HMGCS2 regulates stemness and secretory differentiation through NOTCH signaling.
A, Schematic of the mouse model including the timeline of tamoxifen (TAM) injection and tissue collection for single-cell RNA-seq (scRNA-seq). 5 days after TAM injection, intestinal crypts were isolated from WT and Hmgcs2-KO mice and the Lgr5+ ISC-derived tdTomato+ progeny were flow-sorted for scRNA-seq. B, Cell-type clusters. We used t-SNE to visualize the clustering (color coding) of 17,162 single cells (Hmgcs2-KO; n=2 mice; 7793 cells, vs WT; n=2 mice; 9369 cells), based on the expression of known marker genes(Haber et al., 2017). See also Figures S3B. EEC, enteroendocrine cells; TA, transit amplifying (progenitor) cells. C, Merged t-SNE plot of Tdtomato+ progeny derived from WT (blue) and Hmgcs2-KO (red) ISCs. D, Fraction of total cells per cell type. Error bars, s.e.m.; * FDR < 0.25, ** FDR < 0.1, *** FDR < 0.01; χ2 test (Methods and Table S2). E, Violin plot showing the distribution of the mean expression of the stem cell signature genes (Munoz et al., 2012a) in WT and Hmgcs2-KO ISCs. ***FDR < 0.0001; Mann–Whitney U test. F, Volcano plot displaying differential expressed (DE) genes in Hmgcs2-KO ISCs vs. WT ISCs. 20 of 194 significantly up-regulated genes in Hmgcs2-KO ISCs are Paneth cell markers (green dots)((Haber et al., 2017)). p<0.0001. n=2151 WT ISCs and n=2754 KO ISCs. G, Representative image and quantification at 24hr after TAM injection by immunofluorescence (IF) staining: tdTomato for progeny of Lgr5+ ISCs and Lysozyme (LYZ) as Paneth cell marker. n>25 crypts per measurement, n>3 measurements per mouse and n>5 mice per group. H, Gene set enrichment analysis of Notch-inhibition response genes (left) and Atoh1 deletion target genes (right)(Kim et al., 2014). Bar plot of the -Log10 (p-value) indicates the gene sets up- (white) or down-regulated (gray) in Hmgcs2-KO ISCs compared to WT ISCs. I, Hes Family BHLH Transcription Factor 1 (Hes1) and Atonal BHLH Transcription Factor 1(Atoh1) mRNA expression in intestinal crypts by ISH. Image represents one of 5 biological replicates per group. Yellow arrows indicate Atoh1 transcript positive cells. Scale bar: 50um. J, Schematic for assessing organoid-forming ability of genetically-engineered organoid cells with the CRISPR/CAS9 mediated loss of Hmgcs2 (left) and the constitutive Notch activation by Cre-induced NICD expression (right) or both. Transfected cells were flow-sorted based on the fluorescent markers and plated onto matrigel (Methods). Organoids were quantified and imaged after 5 days of culture (n=4 measurements from 2 independent experiments). Scale bar:200 μm. Data in the dot plot are expressed as mean+/−s.e.m. *p<0.05 and **p<0.01.
Figure 4.
Figure 4.. Beta-hydroxybutyrate (βOHB) compensates for Hmgcs2 loss in ISCs.
A, Relative expression of genes encoding enzymes for ketogenesis in ISCs, progenitors and Paneth cells: ACAT, acetyl-CoA acetyltransferase; BDH, 3-hydroxybutyrate dehydrogenase; HMGL, HMG-CoA lyase, visualized by violin plots for scRNA-Seq data. n=6 mice. B, Relative β-Hydroxybutyrate (βOHB) levels in flow-sorted Lgr5-GFPhi ISCs, Lgr5-GFPlow progenitors and Paneth cells. 250,000 cells of each cell population were directly sorted into the assay buffer and immediately processed for βOHB measurement. Dashed line indicates the detection limit of the colorimetric assay. n=8 samples per population from 4 mice. C, Schematic for Atoh1 deletion. 4 weeks after 5th (last) tamoxifen (TAM) injection, intestinal tissues were harvested for histology. Intestinal crypts were isolated for βOHB measurement. Quantification of βOHB levels in intestinal crypts from WT and Atoh1-KO mice. Levels of βOHB were normalized to total protein of crypt cells. n= 16 samples from 8 mice per group. D, Schematic of the mouse model of Hmgcs2 loss. After tamoxifen (TAM) injection, intestinal tissues were harvested for histology and intestinal crypts were isolated for βOHB measurement at the indicated time points (i.e. 24hr, 7d and 12 d after first TAM injection). E, Hes1 mRNA expression in intestinal crypts by ISH at indicated timepoints after inducing Hmgcs2 loss. Image represents one of 5 biological replicates per group. F, Schematic (top) of the mouse model including the timeline of tamoxifen (TAM) injection, oral administration of nanoparticle PLGA encapsulated βOHB or βOHB oligomers, irradiation (XRT, 7.5Gy x 2) and tissue collection. Quantification (bottom) and representative images (right) of tdTomato+ Lgr5+ ISC-derived lineage (cell progenies) by IHC. Scale bar:100 μm. n>25 crypts per measurement, n>5 measurements per mouse and n>3 mice per group. For box-and-whisker plots (B-D), data were expressed as box-and-whisker 10 to 90 percentiles. Data in dot plots were expressed as mean+/−s.e.m. *p<0.05, **p<0.01, ***p<0.005.
Figure 5.
Figure 5.. βOHB-mediated HDAC inhibition enhances NOTCH signaling.
A, Violin plots of genes related to Figure S5A: Notch receptor Notch1, Class I HDAC genes: HDAC1/2/3 and Notch target Hes1, based on a previously published scRNA-Seq data (Haber et al., 2017). B, Representative flow cytometry plots (top) and quantification of GFP expressiopn (bottom) Hes1-GFP+ primary organoids exposed to γ-secretase inhibitor (GSI, 10uM), βOHB (50uM) and HDAC inhibitor (JNJ-26481585, 0.2nM), compared to control condition. n=6 samples per treatment from n=3 mice. C, Organoid-forming assay for intestinal crypts isolated from WT and Hmgcs2-KO mice, with combinations of HDAC inhibitor JNJ-26481585 (JNJ) or βOHB treatments or Notch receptor inhibitor (GSI, gamma secretase inhibitor). Quantification and representative images: day-5-to-7 organoids. n=4 mice. Scale bar:500 μm. Arrows indicate organoids and asterisks indicate aborted crypts. D, Schematic (top) of the mouse model including the timeline of tamoxifen (TAM) and HDACi (JNJ) injection and tissue collection. Nuclear NICD, a measure of Notch activation, by immunofluorescence (IF). Inset: arrow illustrates NICDhigh nucleus and asterisk indicates NICDlow nucleus. Data (bottom) represents n>25 crypts per measurement, n>3 measurements per mouse and n>3 mice per gourp. Scale bar:20 μm. E, Quantification of OLFM4+ stem cells, LYZ+ Paneth cells and AB/PAS+ goblet cells in proximal jejunal crypts by IHC. F, Schematic of the mouse model including timeline of TAM and HDACi (JNJ) injection, irradiation (XRT, 7.5Gy × 2) and tissue collection. G, Quantification and representative images of tdTomato+ Lgr5+ ISC-derived lineage (cell progenies) by IHC. Scale bar:100 μm. n>25 crypts per measurement, n>3 measurements per mouse and n>5 mice per group. For box-and-whisker plots (C) data were expressed as box-and-whisker 10 to 90 percentiles, Data in bar graph (D) and dot plot (E and G) are expressed as mean+/−s.e.m. *p<0.05, **p<0.01, ***p<0.005, ****p<0.0001.
Figure 6.
Figure 6.. Ketogenic diet enhances ISC self-renewal in an HMGCS2-dependent manner.
A, Schematic (top) of the mouse model including the timeline of ketogenic diet (KTD) and tissue collection. After 3–4 weeks of the diet, intestinal tissues of KTD-fed or chow-fed (Ctrl) mice were harvested for histology, crypts culture or sorted by flow cytometry for cell frequency analysis. n>5 mice per group. HMGCS2 expression (bottom) by IHC. The image represents one of 5 biological replicates. Scale bars: 50 μm. B, βOHB levels in intestinal crypts from KTD- and Chow-fed mice. Levels of βOHB were normalized to total protein of crypt cells. n= 12 samples from 6 mice per group. C, Hes1GFP expression, a measure of Notch activation by flow cytometry, of crypt cells from KTD- and Chow-fed mice. D, Frequencies of Lgr5-GFPhi ISCs, Lgr5-GFPlow progenitors and CD24+c-Kit+ Paneth cells in crypts from KTD- and Chow-fed mice. n=6 mice per group. E, Organoid-forming assay for sorted ISCs from KTD and Chow mice, co-cultured with Paneth cells from Chow mice. n=6 mice per group. representative images: day 5 organoids. Scale bar: 100um. F, Schematic (top) of the Lgr5 lineage tracing including timeline of TAM injection, irradiation (XRT, 7.5Gy × 2) and tissue collection. Intestinal tissues were harvested for histology and intestinal crypts were isolated for βOHB measurement at the indicated time points. Quantification and representative images (bottom) of tdTomato+ Lgr5+ ISC-derived progeny labeled by IHC for tdTomato. For G-H, Schematic (top) of intestinal Hmgcs2-deletion (iKO) and whole-body Hmgcs2-deletion (wKO) mice on KTD, including timeline of TAM injection, irradiation (XRT, 7.5Gy × 2) and tissue collection. βOHB levels (bottom) in intestinal crypts isolated from the indicated groups (G), number of surviving crypts assessed by the microcolony assay (H). For F and H, Scale bar:100 μm. n>25 crypts per measurement, n>5 measurements per mouse and n>3 mice per group. Data in dot plots (C,E and F) are expressed as mean+/−s.e.m. For (B,D and G), Box-and-whisker 10 to 90 percentiles. *p<0.05, **p<0.01, ****p<0.001.
Figure 7.
Figure 7.. Dietary glucose dampens intestinal ketogenesis and stemness.
A, Schematic (top) of the mouse model including the timeline of glucose supplementation (Gluc) and tissue collection. After 3–4 weeks of the diet, intestinal tissues of Gluc and Ctrl mice were harvested for histology, crypts culture or sorted by flow cytometry for cell frequency analysis. n>5 mice per group. HMGCS2 expression (bottom) by IHC. The image represents one of 5 biological replicates. Scale bars: 50 μm. B, βOHB levels in intestinal crypts from Gluc and Ctrl mice. Levels of βOHB were normalized to total protein of crypt cells. n= 12 samples from 6 mice per group. C, Hes1-GFP expression, a measure of Notch activation by flow cytometry, of crypt cells from Gluc and Ctrl mice. D-E, Schematic (top) of the Lgr5 lineage tracing including timeline of TAM injection, irradiation (XRT, 7.5Gy × 2) and tissue collection. Quantification and representative images (bottom) of tdTomato+ Lgr5+ ISC-derived progeny labeled by IHC for tdTomato (D) and number of surviving crypts assessed by the microcolony assay (E). Scale bar:100 μm. n>25 crypts per measurement, n>5 measurements per mouse and n>3 mice per group. F, Model of how ketone body (βOHB) signaling dynamically regulates intestinal stemness in homeostasis and in response to diet. In normal dietary states, mitochondrial HMGSCS2-derived βOHB enforces NOTCH signaling through HDAC, class 1 inhibition. Genetic ablation of Hmgcs2 reduces ISC βOHB levels, thereby increasing HDAC-mediated suppression of the NOTCH transcriptional program, which diminishes ISC numbers, function and skews differentiation towards the secretory lineage. Ketogenic diets (KTD) enhance both systemic and stem cell produced βOHB levels in ISCs, leading to higher NOTCH activity, ISC function, and post-injury regeneration. In contrast, glucose supplemented diets suppress ketogenesis and have the opposite effects on intestinal stemness. Thus, we propose that dynamic control of ISC βOHB levels enables it to serve as a metabolic messenger to execute intestinal remodeling in response to diverse physiological states.

References

    1. Adijanto J, Du J, Moffat C, Seifert EL, Hurle JB, and Philp NJ (2014). The retinal pigment epithelium utilizes fatty acids for ketogenesis. The Journal of biological chemistry 289, 20570–20582. - PMC - PubMed
    1. Agathocleous M, Meacham CE, Burgess RJ, Piskounova E, Zhao Z, Crane GM, Cowin BL, Bruner E, Murphy MM, Chen W, et al. (2017). Ascorbate regulates haematopoietic stem cell function and leukaemogenesis. Nature 549, 476–481. - PMC - PubMed
    1. Arts J, King P, Marien A, Floren W, Belien A, Janssen L, Pilatte I, Roux B, Decrane L, Gilissen R, et al. (2009). JNJ-26481585, a novel “second-generation” oral histone deacetylase inhibitor, shows broad-spectrum preclinical antitumoral activity. Clin Cancer Res 15, 6841–6851. - PubMed
    1. Barish GD, Narkar VA, and Evans RM (2006). PPAR delta: a dagger in the heart of the metabolic syndrome. The Journal of clinical investigation 116, 590–597. - PMC - PubMed
    1. Barker N, Ridgway RA, van Es JH, van de Wetering M, Begthel H, van den Born M, Danenberg E, Clarke AR, Sansom OJ, and Clevers H (2009). Crypt stem cells as the cells-of-origin of intestinal cancer. Nature 457, 608–611. - PubMed

Publication types

MeSH terms