. 2019 Aug 22;178(5):1159-1175.e17.
doi: 10.1016/j.cell.2019.07.043.

Loss of Ataxin-1 Potentiates Alzheimer's Pathogenesis by Elevating Cerebral BACE1 Transcription

Affiliations

Loss of Ataxin-1 Potentiates Alzheimer's Pathogenesis by Elevating Cerebral BACE1 Transcription

Jaehong Suh et al. Cell. .

Abstract

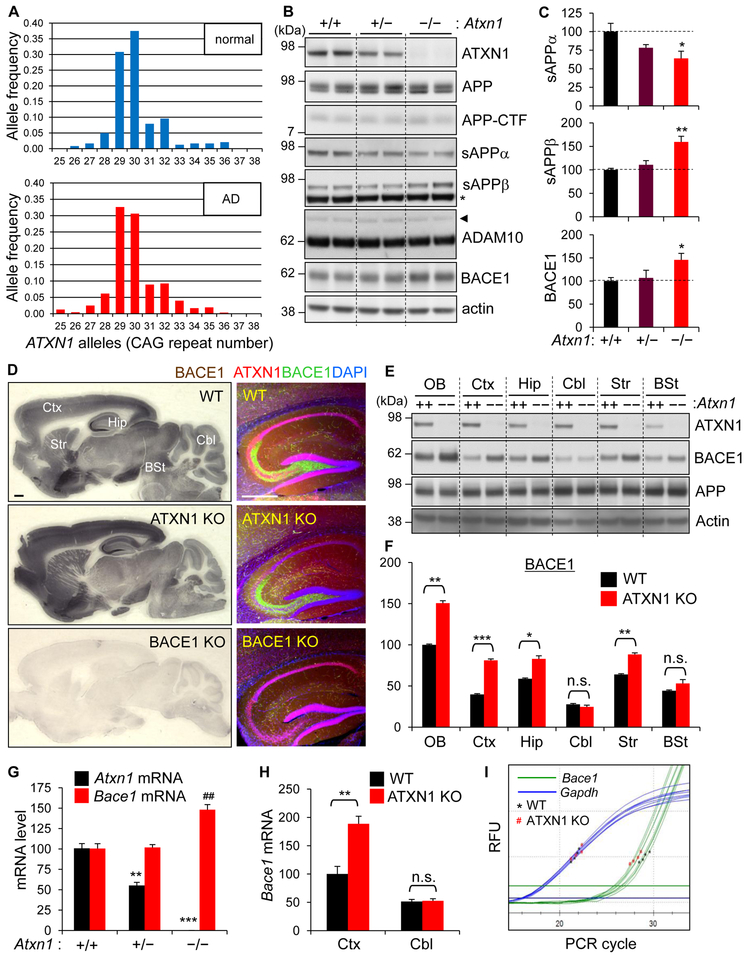
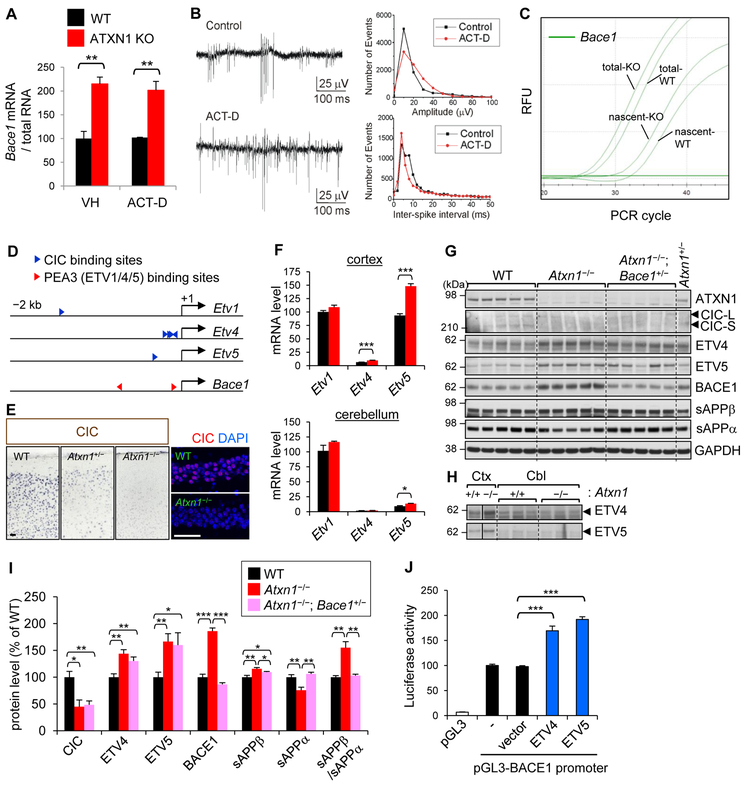
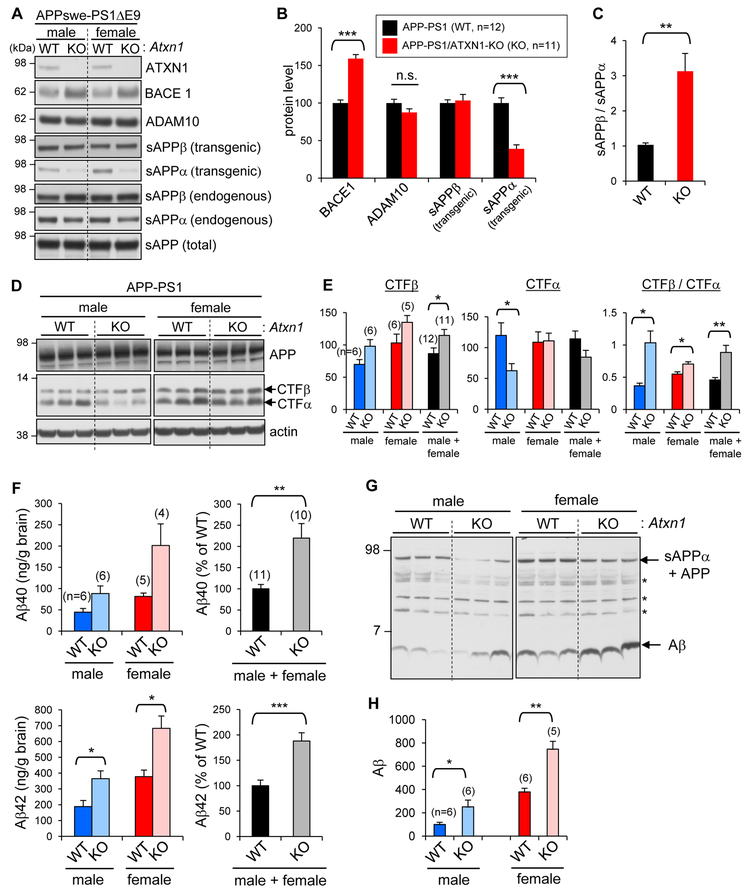
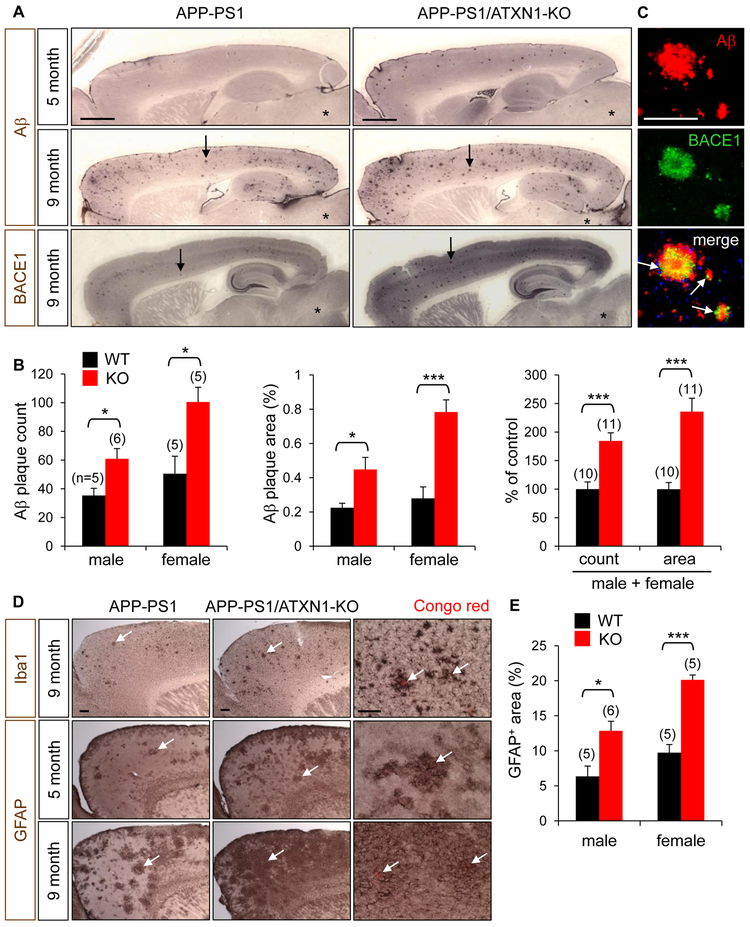
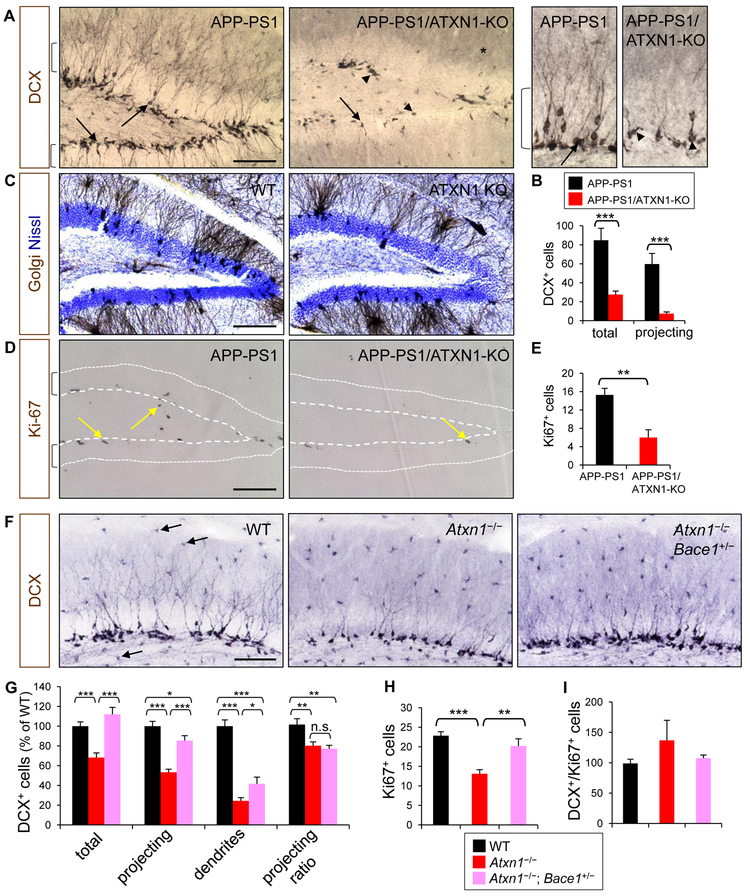
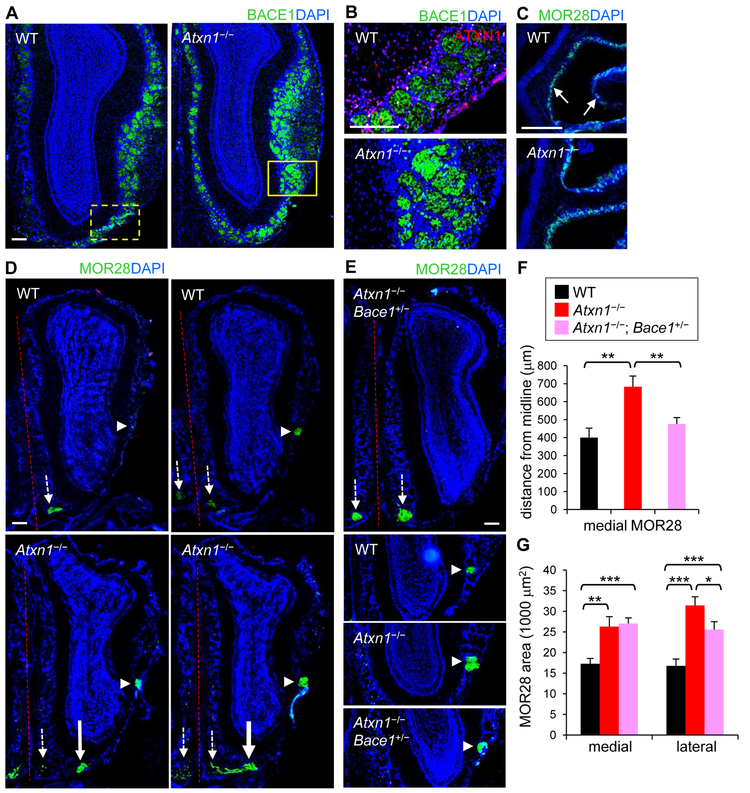
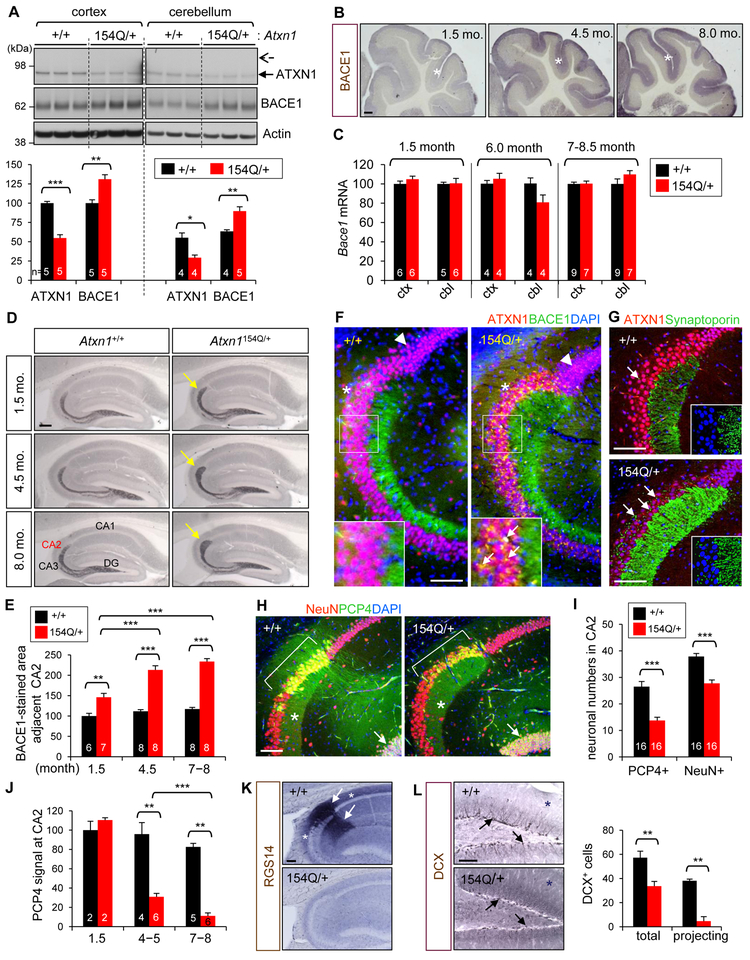
Expansion of CAG trinucleotide repeats in ATXN1 causes spinocerebellar ataxia type 1 (SCA1), a neurodegenerative disease that impairs coordination and cognition. While ATXN1 is associated with increased Alzheimer's disease (AD) risk, CAG repeat number in AD patients is not changed. Here, we investigated the consequences of ataxin-1 loss of function and discovered that knockout of Atxn1 reduced CIC-ETV4/5-mediated inhibition of Bace1 transcription, leading to increased BACE1 levels and enhanced amyloidogenic cleavage of APP, selectively in AD-vulnerable brain regions. Elevated BACE1 expression exacerbated Aβ deposition and gliosis in AD mouse models and impaired hippocampal neurogenesis and olfactory axonal targeting. In SCA1 mice, polyglutamine-expanded mutant ataxin-1 led to the increase of BACE1 post-transcriptionally, both in cerebrum and cerebellum, and caused axonal-targeting deficit and neurodegeneration in the hippocampal CA2 region. These findings suggest that loss of ataxin-1 elevates BACE1 expression and Aβ pathology, rendering it a potential contributor to AD risk and pathogenesis.

Keywords: Alzheimer’s disease; Aβ; BACE1; CA2; amyloid precursor protein; ataxin-1; axonal targeting; hippocampal neurogenesis; neurodegeneration; spinocerebellar ataxia type 1.


Conflict of interest statement

DECLARATION OF INTERESTS

The authors declare no competing interests.

Figures

Figure 1.
Figure 1.. Increased BACE1 expression in the cerebrum of Ataxin-1 KO mice.
(A) Allele frequencies of ATXN1 with different CAG repeat lengths in the probands of NIMH AD families and healthy individuals of CEPH families. (B) Western blot analysis of APP processing in the brains of 3 month-old WT (+/+), Ataxin-1 hetero-KO (+/−) and KO (−/−) mice. RIPA buffer-soluble lysates were used to detect Ataxin-1 (ATXN1), APP, APP-CTF, ADAM10, BACE1. TBS-soluble lysates for sAPPα and sAPPβ. Actin is a loading control. Arrow head, proADAM10; *, non-specific band. (C) Densitometric quantification of western blot results. WT, relative value of 100. Values are mean ± SEM. n = 5. *p < 0.05, **p < 0.01, t-test. (D) Immunohistochemical (left) and immunofluorescence (right) staining for BACE1. Ctx, cortex; Hip, hippocampus; Cbl, cerebellum; Str, striatum; BSt, brain stem. Bar = 500 μm. (E) Ataxin-1, BACE1, and APP levels in dissected brain regions. OB, olfactory bulb. (F) Densitometry of BACE1 levels. n = 3. n.s.: not significant. ***p < 0.001. (G) RT-qPCR analysis of Atxn1 and Bace1 mRNA expression in the whole brain. n = 4. **p < 0.01, ***p < 0.001 versus WT Atxn1 mRNA; ##p < 0.01 versus WT Bace1 mRNA. (H) Bace1 mRNA levels in dissected cortex and cerebellum. n = 4. (I) Representative real-time qPCR amplification graphs for cortical cDNA. RFU, relative fluorescence unit. See also Figure S1.
Figure 2.
Figure 2.. Increased Bace1 transcription in Ataxin-1 KO cortex.
(A) Actinomycin D or vehicle (DMSO) was treated for 48 hrs in acute brain slice cultures. Results are from two independent brain slice cultures (2 mice each for WT and Ataxin-1 KO). n (brain slices) = 3–4. *p < 0.05, **p < 0.01, ***p < 0.001, t-test. (B) Left: extracellular field potential records of multiple unit activity in CA1 areas of brain slices 48 hrs after incubation. Right: histograms representing spike amplitude distribution (bin size 10 mV) and inter-spike interval (bin size 2 ms). (C) Representative real-time qPCR amplification graphs of steady-state (total) and nascent Bace1 mRNA. Brain slices were incubated for 16 hrs in ACSF containing 5-ethynyl uridine. n (brain slices) = 4. (D) Locations of predicted CIC and PEA3 (ETV1/4/5) binding sites in Etv1/4/5 and Bace1 promoter regions, respectively. The CIC binding site in Etv1 promoter is relative distal (−1486) than those in Etv4/5. (E) CIC expression in medial cortex (left) and hippocampal CA1 (right). Bar = 50 μm. (F) mRNA levels of Etv1, Etv4, and Etv5 in the cortex and cerebellum. Gapdh was used as an internal control for RT-qPCR.All levels were presented as relative to Etv1-WT (100). Compared to cortex, the relative levels of Etv4 and Etv5 versus Etv1 mRNA are very low in cerebellum. n= 6 (cortex), 4 (cerebellum). (G) Western blot analysis for cortical levels of Ataxin-1, CIC, ETV4, ETV5, BACE1, sAPPβ, and sAPPα. (H) Cerebellar levels of ETV4 and ETV5. Vertical lines indicate that different parts within same blot were placed together for better comparison. (I) Densitometric quantification. n = 5, except ETV4 and ETV5 (n = 7). (J) Luciferase activity in HEK293T cells measured 24 hr after transfection with pGL3 plasmids harboring BACE1 promoter and vectors expressing either ETV4 or ETV5. Results from 3 independent experiments of sextuplicate transfection were normalized and combined. n = 18. See also Figure S2.
Figure 3.
Figure 3.. Shift of APP processing toward amyloidogenic pathway in APP-PS1/ATXN1-KO mouse brains.
(A) Analysis of Ataxin-1, BACE1, ADAM10, sAPPα, sAPPβ, and sAPP levels in AD mouse brains. sAPPα and sAPPβ derived from either transgenic APPswe or endogenous APP were detected by different antibodies. (B) Densitometric quantification. Number of mice analyzed, n = 11–12. ***p < 0.001, t-test. (C) Ratio of transgenic sAPPα and sAPPβ. **p < 0.01. (D-E) Levels of APP-CTFα and - CTFβ in brains. Number in parenthesis denotes the number of mice analyzed. *p < 0.05. (F) TBS-insoluble Aβ40 and Aβ42 amounts in the brains of 5-month-old mice. The amounts of TBS-insoluble Aβ at this age were ~ 20 times higher than those of TBS-soluble Aβ. (G) Western blot analysis of detergent-soluble brain lysates with 6E10 antibody targeting N-terminal region of human Aβ. *, non-specific bands. (H) Densitometric quantification of Aβ levels. See also Figure S3.
Figure 4.
Figure 4.. Elevated Aβ plaque load and reactive gliosis in APP-PS1/ATXN1-KO mouse.
(A) Upper and middle panels: Aβ immunohistochemical staining of 5- and 9-month-old mice. Aβ plaques (arrows) are abundantly detected in cortex and hippocampus, but not in brain stem (*). Lower panel: BACE1 immunohistochemistry. BACE1 staining revealed plaque-like strong immunoreactivity (arrows). Bar = 1 mm. (B) Quantification of Aβ plaque load in the cortex and hippocampus of 5-month-old APP-PS1 (WT) and APP-PS1/ATXN1-KO mice (KO). In parenthesis, number of mice analyzed (n). 5–6 brain sections per mouse. *p < 0.05, ***p < 0.001, t-test. (C) Double immunofluorescence staining of Aβ plaques with Aβ and BACE1 antibodies. Arrows indicate BACE1 immunoreactivity around Aβ plaques. Bar = 100 μm. (D) Frontal cortex of 5- and 9-month-old mice immunolabeled for a microglial marker Iba1 and an astrocyte marker GFAP. Arrows, activated microglia and astrocytes. Right panel: higher magnification revealing activated microglia around Congo red-stained dendritic plaques (arrows) and hypertrophy of astrocytes around the plaques (arrows). Bar = 200 μm. (E) Quantification of GFAP+ astrocytes in the cortex of 5-month-old mice. 3–4 brain sections/mouse. See also Figure S4.
Figure 5.
Figure 5.. Decrease of adult hippocampal neurogenesis by depletion of Ataxin-1.
(A) Dentate gyrus of APP-PS1 and APP-PS1/ATXN1-KO mice immunolabeled for DCX. Brackets, granular cell layer; arrows, projecting immature neurons; arrow heads, tangential immature neurons. Right panel: high resolution images. *, background DCX immunoreactivity. Bar = 100 μm. (B) Counts of DCX+ (total) and projecting DCX+ cells (projecting) in dentate gyrus per section. Number of mice analyzed, n = 10–12. ***p < 0.001, t-test. (C) Brown, Golgi-stained neurons; blue, Nissl-stained cell nuclei. (D) Ki-67 immunoreactivity (arrows) in dentate gyrus. Area between dots and dashed lines is granular cell layer. (E) Counts of Ki-67+ cells in dentate gyrus. n = 7–8. **p < 0.01. Photomicrographs (F) and quantification (G) of DCX+ neurons in the upper dentate gyrus for their cell bodies in subgranular cell layer (total), projections within granular cell layer (projecting), dendrites in molecular layer (dendrites), and projecting ratio (projecting/total). Each quantification was normalized to WT group (100). Arrows, non-specific immunoreactivity of microglia. n = 6–7. *p < 0.05, **p < 0.01, ***p < 0.001. (H) Number of Ki-67+ cells. (I) Ratio of DCX+ vs. Ki-67+ cells. n = 7–8. See also Figure S5.
Figure 6.
Figure 6.. Impaired axonal targeting in the olfactory bulbs of Ataxin-1 KO mice.
(A) Olfactory bulbs of WT and Ataxin-1 KO mice immunolabeled for BACE1 (green). Bar = 200 μm. (B) Upper: high resolution of WT olfactory bulb (similar region to the marked area). Lower: marked area in Ataxin-1 KO bulb. (C) Olfactory epithelium immunolabeled for MOR28. Arrows, MOR28-expressing OSNs. (D) Two serial sections of olfactory bulbs of WT (upper) and Ataxin-1 KO mice (lower) stained with MOR28 antibody. Small arrows, original locations of medial MOR28 glomeruli; large arrows, translocated MOR28 glomeruli; arrow heads, lateral MOR28 glomeruli; dashed line, midline in the olfactory system. (E) Upper: olfactory bulb of Atxn1−/−; Bace1+/− mouse labeled for MOR28. Lower: lateral MOR28 glomeruli of each mouse genotype. (F) Distance of medial MOR28 glomeruli from the midline. Number of mice/olfactory bulbs analyzed, n = 9/12 (WT), 10/14 (Atxn1−/−), 7/12 (Atxn1−/−; Bace1+/−). *p < 0.05, **p < 0.01, ***p < 0.001, t-test. (G) Areas of medial and lateral MOR28 glomeruli.
Figure 7.
Figure 7.. Elevated BACE1 levels and CA2 neurodegeneration in polyQ-expanded Ataxin-1 knockin mice.
(A) Ataxin-1 and BACE1 levels in 6-month-old Atxn1154Q/+ and WT mice. Arrow and dashed arrow indicate the positions of WT (2Q) and mutant (154Q) Ataxin-1, respectively. In bar, number of mice analyzed. *p < 0.05, **p < 0.01, ***p < 0.001, t-test. (B) BACE1 immunolabeled cerebellum of 1.5-, 4.5-, and 8-month-old Atxn1154Q/+ mice. *, molecular layer. Bar = 200 μm. (C) Bace1 mRNA levels in the cortex and cerebellum. Relative value of 100 is given to the cortex and cerebellum of WT at each age group. (D) Hippocampus of Atxn1154Q/+ and WT mice immunolabeled for BACE1. Arrows, BACE1-immunopositive mossy fiber ends. Bar = 200 μm. (E) Quantification of BACE1-immunoreactive area near CA2. In bar, number of brain section analyzed. 1–2 sections/mouse. (F) Hippocampal CA1/CA2/CA3 regions of 8-month-old mice immunolabeled for Ataxin-1 and BACE1. Arrow head, punctate staining of CA1 neurons by Ataxin-1 and DAPI. *, outward shape of CA2 region. Arrows in inset, BACE1 immunoreactivity (yellow signal) in the neuronal soma. Bar = 100 μm. (G) Immunofluorescence signals of Ataxin-1 and synaptoporin, a presynaptic marker. Arrows, synaptoporin+ presynaptic terminals. Insets, high resolution images without Ataxin-1 signal. (H) Hippocampal regions immunolabeled for PCP4 and NeuN, a neuronal marker. Bracket, CA2; *, stratum lucidum; arrow, granular neurons. (I) Counts of PCP4+ neurons and NeuN+ neurons in CA2 regions of 6-9 months-old mice. In bar, numbers of brain section analyzed. 2–4 sections/mouse. (J) Quantification of PCP4 immunoreactivity of CA2 neurons. 1–2 sections/mouse. (K) RGS14 immunoreactivity in 6 month-old mice. Arrows, RGS14+ dendrites of CA2 neurons; *, RGS14+ axons. Bar = 100 μm. (L) Dentate gyrus of 4.5-month-old mice immunolabeled for DCX. Arrows, DCX+ neurons. *, background DCX immunoreactivity. Right: counts of total and projecting DCX+ cells per dentate gyrus. n = 4. See also Figures S6 and S7.

References

    1. Asher M, Johnson A, Zecevic B, Pease D, and Cvetanovic M (2016). Ataxin-1 regulates proliferation of hippocampal neural precursors. Neuroscience 322, 54–65. - PubMed
    1. Barao S, Gartner A, Leyva-Diaz E, Demyanenko G, Munck S, Vanhoutvin T, Zhou L, Schachner M, Lopez-Bendito G, Maness PF, et al. (2015). Antagonistic Effects of BACE1 and APH1B-gamma-Secretase Control Axonal Guidance by Regulating Growth Cone Collapse. Cell Rep 12, 1367–1376. - PMC - PubMed
    1. Barnea G, O'Donnell S, Mancia F, Sun X, Nemes A, Mendelsohn M, and Axel R (2004). Odorant receptors on axon termini in the brain. Science 304, 1468. - PubMed
    1. Bertram L, Lange C, Mullin K, Parkinson M, Hsiao M, Hogan MF, Schjeide BM, Hooli B, Divito J, Ionita I, et al. (2008). Genome-wide association analysis reveals putative Alzheimer's disease susceptibility loci in addition to APOE. Am J Hum Genet 83, 623–632. - PMC - PubMed
    1. Bertram L, and Tanzi RE (2012). The genetics of Alzheimer's disease. Prog Mol Biol Transl Sci 107, 79–100. - PubMed

Publication types

MeSH terms