. 2019 Aug 22;178(5):1176-1188.e15.
doi: 10.1016/j.cell.2019.07.032.

Effector TH17 Cells Give Rise to Long-Lived TRM Cells that Are Essential for an Immediate Response against Bacterial Infection

Affiliations

Effector TH17 Cells Give Rise to Long-Lived TRM Cells that Are Essential for an Immediate Response against Bacterial Infection

Maria Carolina Amezcua Vesely et al. Cell. .

Abstract

Adaptive immunity provides life-long protection by generating central and effector memory T cells and the most recently described tissue resident memory T (TRM) cells. However, the cellular origin of CD4 TRM cells and their contribution to host defense remain elusive. Using IL-17A tracking-fate mouse models, we found that a significant fraction of lung CD4 TRM cells derive from IL-17A-producing effector (TH17) cells following immunization with heat-killed Klebsiella pneumonia (Kp). These exTH17 TRM cells are maintained in the lung by IL-7, produced by lymphatic endothelial cells. During a memory response, neither antibodies, γδ T cells, nor circulatory T cells are sufficient for the rapid host defense required to eliminate Kp. Conversely, using parabiosis and depletion studies, we demonstrated that exTH17 TRM cells play an important role in bacterial clearance. Thus, we delineate the origin and function of airway CD4 TRM cells during bacterial infection, offering novel strategies for targeted vaccine design.

Keywords: Fate mapping; IL-17; IL-7; T(H)17; Tissue resident memory CD4 T cells; exT(H)17.


Conflict of interest statement

Declaration of Interests

The authors declare no competing interests

Figures
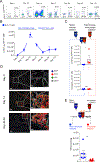
Figure. 1:
Figure. 1:. Origin and function of TRM exTH17 cells
A) Dot plots show percentage of TH17, exTH17 and YFPneg IL17neg cells and B) absolute number of TRM exTH17 cells in lungs at different time points after immunization in Fate+ mice (gated on CD4 in-vitro+ CD4 in-vivo Neg TCR-β+ Foxp3Neg) (n= 4 per time point). One out of 2 independent experiments is shown C) Naïve CD45.1+ and day 35 immunized Fate+ CD45.2+ mice were surgically joined for 3 weeks. Before sacrifice anti-CD4 antibody was injected to distinguish TRM and circulating cells. The graph shows the absolute number of lung TRM CD45.2+ and circulatory exTH17 cells in naïve CD45.1 mice (blue) and in Fate+ immunize mice (red). D) Representative immunofluorescent sections of lungs from naïve (Day 0) and immunized mice (Day 14 and Day 30) showing the presence of CD4 T cells (red) and exTh17/Th17 cells (yellow) surrounding the airways only in the lungs of immunized mice. AW= airway and BV= blood vessel; blue: DAPI, grey: CD31 (n= 3 per time point) E) Parabiotic pairs were infected with live carbapenem resistant Kp after 3 weeks of surgery. The graph shows the CFU count in total lung 24 h after infection of naïve-infected (blue) or immunized-infected (red). Each dot represents one mouse. Data is cumulative of 2 experiments. Data are represented as mean ± SEM. Mann-Whitney U test, ns (non significant); *p= 0.0286; **p = 0.0022. Data are represented as mean ± SEM.
Figure. 2:
Figure. 2:. TCR β sequencing of Lung TRM cells
A, F) TCR β sequencing of lung TRM TH17 vs lung TRM exTH17 cells, B, G) lung TRM TH17 vs lung TRM YFPneg C, H) lung TRM TH17 vs splenic memory CD4 cells and vs splenic naive CD4 cells at day 35 after immunization in 2 different mice. D, I) TCRβ sequencing of lung exTH17 vs lung YFPneg at day 35 after immunization in 2 different mice. The dots plots graphs show the common shared CDR3 amino acid sequences of TCRβ chains between all the populations. The most expanded clones among TH17 cells were colored and followed across all the comparisons between different populations. E, J) The bar graphs on the left show percentage of the most expanded clones in each population. The bar graphs on the right show the cumulative productive frequency of the most expanded clones in lung TRM cells. The colors of the clones followed the same colors used for the dot plots graphs.
Figure 3:
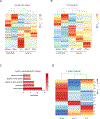
Figure 3:. RNA sequencing of Lung TRM and lymph node memory and naïve CD4 populations illustrates key features of Lung TRM populations.
A) Heatmap of genes significantly differentially expressed (>4 fold cutoff) between the lymph node and lung populations. B) Heatmap of a selected subset of genes known to be involved in tissue resident memory cell biology. C) Bar graph of gene ontology assignments of genes overexpressed 4 fold in lung TRM cells relative to lymph node memory cells. Dashed line represent p = 0.05, Fishers exact test. The intensity of the color bar on the right indicates the amount of genes in each pathway. D) Heatmap of a selected subset of genes known to be involved in T helper subset and memory biology.
Figure 4:
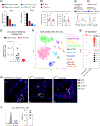
Figure 4:. Lymphatic endothelial cells maintain effector derived lung TRM cells
A) Relative RNA expression of KLF2 and S1PR1 on day 30 in immunized mice is shown. Splenic naïve CD4 cells (black bars), splenic memory CD4 cells (red bars), lung exTH17 cells (light blue bars) and lung TH17 cells (dark blue bars). Technical replicates of one representative experiment out of two are shown and data is represented as mean ± SD. B) The graphs show the absolute number of total TRM CD4 (left) and TRM exTH17 cells (right) in lungs (gated on CD4 in-vitro+ TCR β + Foxp3 CD4 in-vivoNeg) after FTY720 treatment (red circles). Non Tx mice= normal drinking water (black circles). Each dot represents one mouse. One out of 2 independent experiment is shown. C, D) Histograms show the expression of CD127 and CD122 in lung TRM exTH17 cells (red line) 60 days after immunization, and in total spleen CD4 cells (blue line). CD122 expression in total CD8 spleen cells is shown as a positive control (grey line) (n= 4 mice). One out of 2 independent experiments is shown E) Fate+ immunized mice were intra-nasally treated with anti-IL-7 Ab, or with an isotope control on day 35, 37 and 39 after immunization and the mice were sacrificed on day 40. The graph shows the absolute number of lung TRM exTH17 cells in the isotype ctrl treated group (black circles) and in the anti-IL7 treated group (red circles). Each dot represents one mouse. Three combined experiments are shown. F) Single Cell RNA sequencing of total lung tissue cells from immunized mice with total CD4+ cells and circulatory CD45+ removed by FACS sorting. Lung cells were profiled by droplet-based scRNA-seq (Drop-Seq). t-SNE plots show 1500 cells (dots) in a nonlinear representation of the top 50 PCs. Cells are colored by cluster. The clusters were identified by specific genes (Supplementary Figure.7). G) Representation of differentially expressed Il7 gene by cluster (y-axis) in immunized and naive conditions (x-axis). The dot size represents the fraction of cells in the cluster that express Il7; the dot color represents the intensity of Il7 expression. H) Representative immunofluorescent sections of lungs from B6-non immunized (left), IL7GFP/+ non-immunized (middle) or day 35-immunized mice (right). Colocalization of CD4 T cells (red) and IL-7+lymphatic endothelial cells (Grey+ green) in the lungs of immunized mice. Blue: DAPI, grey: Lyve-1, green: IL7, red: CD4. I)The histogram shows the percentage of lung TRM exTH17 BrdU+ cells. Each dot represents one mouse. One out of 2 independent experiments is shown. Data are represented as mean ± SEM. Mann-Whitney U test ** p = 0.0082.
Figure. 5:
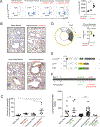
Figure. 5:. Function of TRM exTh17 cells.
A) Dot plots show the frequencies of TRM TH17 cells (CD4 in-vitro+, CD4 in-vivoneg, TCRβ+ Foxp3neg, IL17kata+, YFP+) in naïve+ infection mouse, immunized mouse (day 35), immunized mouse + infection (2 hours) and immunized mouse + infection (24 hours) (n=3 mice per group). The right graph shows the MFI of IL17kata in TRM TH17 cells. B) Peroxidase immune staining of mouse Ly6B in naïve, naïve+ infected, immunized (day 35) and immunized (day 35) + infection lungs, 2 hours after Kp infection. Representative slides are shown for each group. C) Quantification of neutrophils surrounding bronchioles from B. D) Cake graph shows the percentage of INF-γ+ (dark grey) among the population of YFP+ cells 24 h after infection with live Kp (after PMA-ionomycin stimulation). Double positive cells (IL17A+, INF-γ+ middle grey) and IL17A+ cells (light grey) are shown separately. The graph on the right shows the percentage of INF-γ+ single positive cells in immunized + infection (yellow circles) and in immunized mice not infected (day 35 after immunization). E) Constructs of Fate-DTR mice. F) Scheme depicting the time plan of immunization, diphtheria toxin treatment (DT Tx) and infection of Fate-DTR mice (Top). The graph shows the CFU counts in the indicated groups. For the first 4 groups (from left to right) Fate-DTR mice were used, while for the last group Fate+ immunized mice were used. Each symbol represents one mouse. Data are represented as mean ± SEM. Kruskal-Wallis (p < 0.0001) and post-hoc Mann-Whitney U test with Bonferroni correction *p = 0.0238 **p = 0.0043 (A); one-way Anova, and post-hoc Dunnett * p< 0.05; **p < 0.005 (C); and Kruskal-Wallis (p = 0.0009) and post-hoc Mann-Whitney U test with Bonferroni correction, ns (non significant), *** p < 0.0001 (F).

References

    1. Adachi T, Kobayashi T, Sugihara E, Yamada T, Ikuta K, Pittaluga S, Saya H, Amagai M and Nagao K (2015). “Hair follicle-derived IL-7 and IL-15 mediate skin-resident memory T cell homeostasis and lymphoma.” Nat Med 21(11): 1272–1279. - PMC - PubMed
    1. Anderson KG, Mayer-Barber K, Sung H, Beura L, James BR, Taylor JJ, Qunaj L, Griffith TS, Vezys V, Barber DL and Masopust D (2014). “Intravascular staining for discrimination of vascular and tissue leukocytes.” Nat Protoc 9(1): 209–222. - PMC - PubMed
    1. Bannard O, Kraman M and Fearon DT (2009). “Secondary replicative function of CD8+ T cells that had developed an effector phenotype.” Science 323(5913): 505–509. - PMC - PubMed
    1. Becattini S, Latorre D, Mele F, Foglierini M, De Gregorio C, Cassotta A, Fernandez B, Kelderman S, Schumacher TN, Corti D, Lanzavecchia A and Sallusto F (2015). “T cell immunity. Functional heterogeneity of human memory CD4(+) T cell clones primed by pathogens or vaccines.” Science 347(6220): 400–406. - PubMed
    1. Carlson CM, Endrizzi BT, Wu J, Ding X, Weinreich MA, Walsh ER, Wani MA, Lingrel JB, Hogquist KA and Jameson SC (2006). “Kruppel-like factor 2 regulates thymocyte and T-cell migration.” Nature 442(7100): 299–302. - PubMed

Publication types

MeSH terms