. 2019 Aug 22;178(5):1189-1204.e23.
doi: 10.1016/j.cell.2019.07.044.

Systematic Immunotherapy Target Discovery Using Genome-Scale In Vivo CRISPR Screens in CD8 T Cells

Affiliations

Systematic Immunotherapy Target Discovery Using Genome-Scale In Vivo CRISPR Screens in CD8 T Cells

Matthew B Dong et al. Cell. .

Abstract

CD8 T cells play essential roles in anti-tumor immune responses. Here, we performed genome-scale CRISPR screens in CD8 T cells directly under cancer immunotherapy settings and identified regulators of tumor infiltration and degranulation. The in vivo screen robustly re-identified canonical immunotherapy targets such as PD-1 and Tim-3, along with genes that have not been characterized in T cells. The infiltration and degranulation screens converged on an RNA helicase Dhx37. Dhx37 knockout enhanced the efficacy of antigen-specific CD8 T cells against triple-negative breast cancer in vivo. Immunological characterization in mouse and human CD8 T cells revealed that DHX37 suppresses effector functions, cytokine production, and T cell activation. Transcriptomic profiling and biochemical interrogation revealed a role for DHX37 in modulating NF-κB. These data demonstrate high-throughput in vivo genetic screens for immunotherapy target discovery and establishes DHX37 as a functional regulator of CD8 T cells.

Keywords: CD8 T cell; DHX37; T cell effector function; adoptive transfer; breast cancer; immunotherapy; in vivo CRISPR screen; lentiCRISPR; target discovery; tumor infiltration.


Figures

Figure 1.
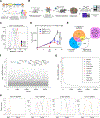
Figure 1.. Genome-scale in vivo CD8 T cell screen identified genes regulating tumor infiltration
(A) Schematics of the design of a T cell CRISPR vector, MKO library cloning and lentiviral library production. (B) Schematics of experiment design. (C) Measurement of antigen presentation in E0771-mCh-OVA clonal cell lines with a SIINFEKL:H-2kb antibody. (D) Growth curve of intramammary fat pad tumors from transplanted E0771-mCh-OVA cells in Rag1−/− mice following different treatments. PBS control (n = 3), adoptive transfer of OT-I;Cas9 CD8 T cells infected with vector (n = 3) or MKO (n = 8). Red arrow indicates the time of adoptive transfer. Data are shown as mean ± s.e.m.. Note that some error bars are not visible because the values are small. * = p < 0.05, ** = p < 0.01, *** = p < 0.001 by two-way ANOVA. (E) Venn diagram of the three enrichment criteria to identify the top gene hits (≥ 2% read abundance in one sample (n = 36), significant in ≥ 20% of samples (n = 220), and ≥ 2 independent enriched sgRNAs (n = 26)). (F) Meta-analysis of infiltration screen using RIGER with the second-best sgRNA method. (G) Meta-analysis of infiltration screen using MAGeCK analysis of survival screen. (H) Single gene-level analysis of individual for their sgRNA distributions across each sample, showing representative genes depleted (His1h4d) or enriched (Pdcd1, Stradb, and Havcr2) in tumors as compared to cells. (see also Supplemental Figures S1 to S3)
Figure 2.
Figure 2.. High-throughput CRISPR screen of CD8 T cell degranulation identified Dhx37 and Odc1 as top hits convergent with infiltration
(A) Schematics of experiment. (B) Titration of SIINFEKL peptide on MHC-I in E0771 cells. (C) Representative histogram of CD107a+ T cells analyzed from the co-culture of OT-I;Cas9 CD8 T cells and E0771 cancer cells. (D) Waterfall plot of the top-ranked sgRNAs across all sorted cell samples. (E) Venn diagram comparing the hits from the degranulation screen and from the tumor infiltration screen. (F) Schematics of efficacy testing experiments with adoptive transfer of single-gene knockout CD8+ T cells (G) Growth curves of mammary fat pad E0771-mCh-OVA tumors in Rag1−/− mice following different treatments: PBS control, adoptive transfer of OT-I;Cas9 CD8 T cells infected with lentiviral vector, lenti-sgDhx37, lenti-sgOdc1 and lenti-sgPdcd1. Note: Arrow indicates the time of adoptive transfer of MKO or vector transduced OT-I; Cas9 CD8+ T cells. Data are shown as mean ± s.e.m. Statistical comparisons were made with two-way ANOVA for each group against vector, with p values indicated. (H) Spider plots of (G) separated by treatment group for visibility. (see also Supplemental Figures S4 to S5)
Figure 3.
Figure 3.. Single-cell transcriptomics of Dhx37 knockout CD8 tumor-infiltrating lymphocytes
(A) Schematics of experiment. (B) Volcano plot of differentially expressed genes in tumor-infiltrating CD8+ cells treated with sgDhx37 compared to vector control. (C) Gene ontology (GO) analysis of significantly upregulated genes in sgDhx37-treated tumor-infiltrating CD8+ cells. (D) GO analysis of significantly downregulated genes in sgDhx37-treated tumor-infiltrating CD8+ cells. Note: for C and D, significantly enriched (Bonferroni adjusted p < 0.05) GO categories were shown.
Figure 4.
Figure 4.. AAV-mediated gene editing in primary murine CD8 T cells and effect of Dhx37 perturbation
(A) Schematics of the AAV-CRISPR T cell knockout vector. (B) Schematics of experiment. (C) Dhx37 gene editing in mouse CD8 T cells with AAV-CRISPR measured by T7E1 assay. (D) Representative Illumina targeted amplicon sequencing of the sgRNA target site 5 days after infection with AAV-sgDhx37. Top most frequent variants were shown, with the associated variant frequencies in the box to the right. PAM and sgRNA spacers were indicated above. Red arrows indicate predicted cleavage sites. Red dash lines indicate deletions. (E) qPCR of Dhx37 mRNA level in murine CD8 T cells with AAV-sgDhx37 transduction. (F) Western blot of Dhx37 protein level in murine CD8 T cells with AAV-sgDhx37 transduction. (G) Representative flow histograms of CD107a degranulation assay for Dhx37 knockout CD8+ T cells. (H) Quantification of data from (G) with independent experimental replicates. (I) Anti-tumor activity of adoptive transfer of AAV-CRISPR mediated Dhx37 knockout CD8 T cells. Growth curves of mammary fat pad E0771-mCh-OVA tumors in Rag1−/− mice following different treatments. Note: In all bar plots, Data are shown as mean ± s.e.m. * = p < 0.05, ** = p < 0.01, *** = p < 0.001, by unpaired two-sided t-test. In tumor growth curves, arrow indicates the time of adoptive transfer. **** = p < 0.0001 by two-way ANOVA. (see also Supplemental Figures S4 to S5)
Figure 5.
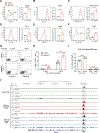
Figure 5.. Immunological characterization of Dhx37 knockout mouse CD8 T cells
(A-F) Flow cytometry analysis of key immune markers of T cell function, including CD69 (A), CD27 (B), Granzyme B (C), PD-1 (D), Lag3 (E) and Tim-3 (F). Left panel in each plot is a representative histogram of sgDhx37 (red) and Vector (black) CD8+ T cells. Right panel is a bar plot of quantification for each marker. Data are shown as mean ± s.e.m. * = p < 0.05, ** = p < 0.01, *** = p < 0.001, by unpaired two-sided Mann Whitney test. (G) Flow cytometry analysis plot of IFNγ production of sgDhx37 and Vector CD8+ T cells with or without anti-CD3 stimulation. (H) Quantification bar plot of (G). Data are shown as mean ± s.e.m. ** = p < 0.01, by unpaired two-sided Mann Whitney test. (I) Co-culture luciferase assay that measures the ability of sgDhx37 and Vector treated CD8 T cells to kill antigen-expressing (E0771-OVA) and parental control (E0771-Ctrl) cells. Data are shown as mean ± s.e.m. **** = p < 0.0001, by unpaired two-sided t test. (J) Normalized signal tracks of ATAC-seq, H3K27ac, H3K4me3, and H3K27me3 ChIP-seq at the Dhx37 locus in naïve, memory precursor and terminal effector CD8+ T cells. (see also Supplemental Figure S6)
Figure 6.
Figure 6.. Transcriptome analysis of Dhx37 knockout mouse CD8+ T cells by mRNA-seq
(A) Volcano plot of differentially expressed genes between Dhx37 knockout and Vector control CD8 T cells, as quantified by bulk mRNA-seq (n = 4 biological replicates each). (B) Heatmap of differentially mRNA-seq expressed genes in between Dhx37 knockout and Vector control CD8 T cells. (C) qPCR single-gene validation of representative highly upregulated or downregulated genes, including Gzmc, Gzmd, Serpinb9b, Tim-3 and Il6ra. Data are shown as mean ± s.e.m. * = p < 0.05, ** = p < 0.01, *** = p < 0.001, by unpaired two-sided t-test. (D-E) GSEA analysis of differentially expressed (DE) genes in Dhx37 knockout CD8+ T cells in known T effector signatures. (D) Analysis of Dhx37-DE upregulated gene set in (Left) gene signature of IL-12 treatment vs. control T effector cell; and in (Right) D6 vs. D12 T effector cell in culture. (E) Analysis of Dhx37-DE downregulated gene set in (Left) gene signature of effector vs. naïve CD8 T cell; and in (Right) effector vs. memory CD8 T cell. (F) DAVID GO analysis of Dhx37-DE upregulated gene set. (G) Motif analysis of the regulatory DNA elements of the Dhx37-DE upregulated gene set, identifying the consensus NF-κB binding site as the top enriched motif.
Figure 7.
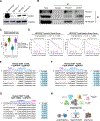
Figure 7.. Characterization of DHX37 in human T cells
(A) Western blot analysis of DHX37 protein in human cells. From left to right, HEK293FT cells with DHX37 cDNA overexpression as a positive control; peripheral blood CD4+ T cells from a healthy donor; peripheral blood CD8+ T cells from a healthy donor; TILs from a tumor biopsy freshly isolated from an NSCLC patient. (B) Co-IP western experiment of DHX37 and NF-κB pathway components (PDCD11 and p65) in human primary CD8+ T cells. Anti-DHX37 and Anti-PDCD11 reciprocal IPs were blotted with endogenous antibody against PDCD11, DHX37, also along with p65. (C) DHX37 mRNA expression in normal human CD8+ and CD4+ T cells in activated and naïve states. Statistical comparisons were made with two-sided unpaired Mann Whitney test. (D) TIDE analyses of DHX37 expression in T cell dysfunction signatures linked to survival benefits in patients, with luminal-A or triple-negative breast cancer. (E-G) Gene editing of the DHX37 locus in primary human CD8+ T cells, with Cas9 RNP (E), Cas9 mRNA (F) or Cpf1 mRNA systems. Representative Illumina targeted amplicon sequencing of the sgRNA target site. Top most frequent variants were shown, with the associated variant frequencies in the box to the right. PAM and sgRNA spacers were indicated above. Red arrows indicate predicted cleavage sites. Red dash lines indicate deletions. Red A/C/G/T where applicable indicate insertions. (see also Supplemental Figure S7)

Comment in

References

    1. Abdelhaleem M (2005). RNA helicases: regulators of differentiation. Clin Biochem 38, 499–503. - PubMed
    1. Beil-Wagner J, Dossinger G, Schober K, vom Berg J, Tresch A, Grandl M, Palle P, Mair F, Gerhard M, Becher B, et al. (2016). T cell-specific inactivation of mouse CD2 by CRISPR/Cas9. Sci Rep 6, 21377. - PMC - PubMed
    1. Betts MR, Brenchley JM, Price DA, De Rosa SC, Douek DC, Roederer M, and Koup RA (2003). Sensitive and viable identification of antigen-specific CD8+ T cells by a flow cytometric assay for degranulation. J Immunol Methods 281, 65–78. - PubMed
    1. Blankenstein T, Coulie PG, Gilboa E, and Jaffee EM (2012). The determinants of tumour immunogenicity. Nat Rev Cancer 12, 307–313. - PMC - PubMed
    1. Blum JS, Wearsch PA, and Cresswell P (2013). Pathways of antigen processing. Annu Rev Immunol 31, 443–473. - PMC - PubMed

Publication types

MeSH terms