. 2019 Aug 22;20(17):4094.
doi: 10.3390/ijms20174094.

Mice Exposed to Combined Chronic Low-Dose Irradiation and Modeled Microgravity Develop Long-Term Neurological Sequelae

Affiliations

Mice Exposed to Combined Chronic Low-Dose Irradiation and Modeled Microgravity Develop Long-Term Neurological Sequelae

Eliah G Overbey et al. Int J Mol Sci. .

Abstract

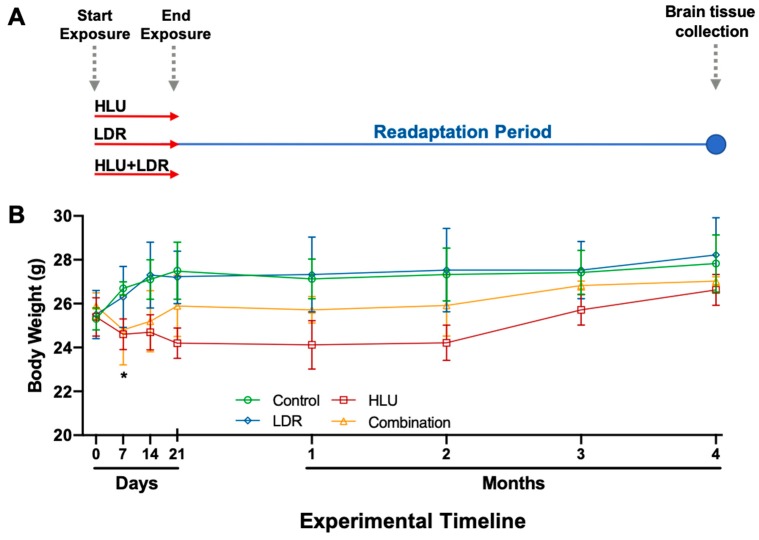
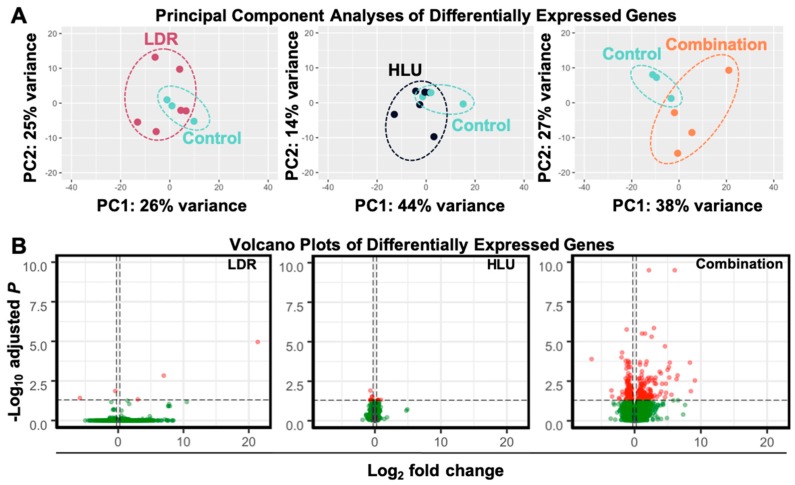
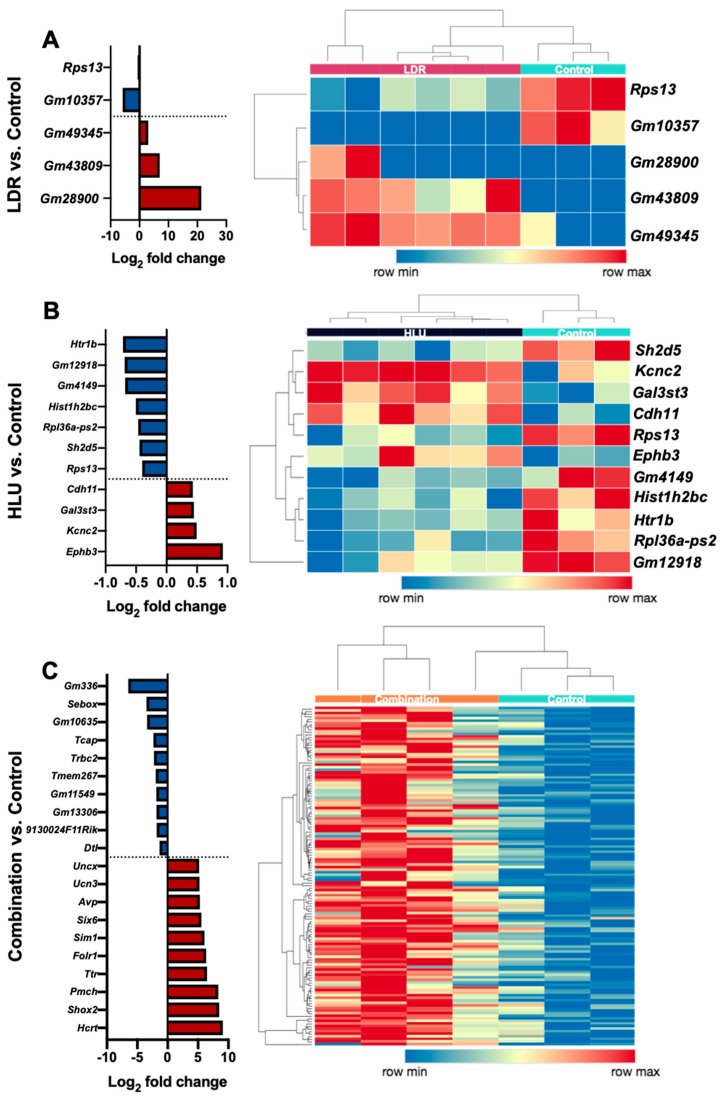
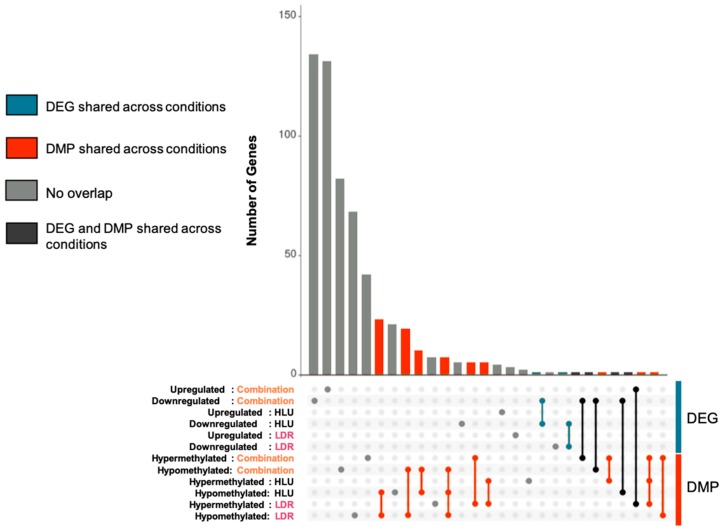
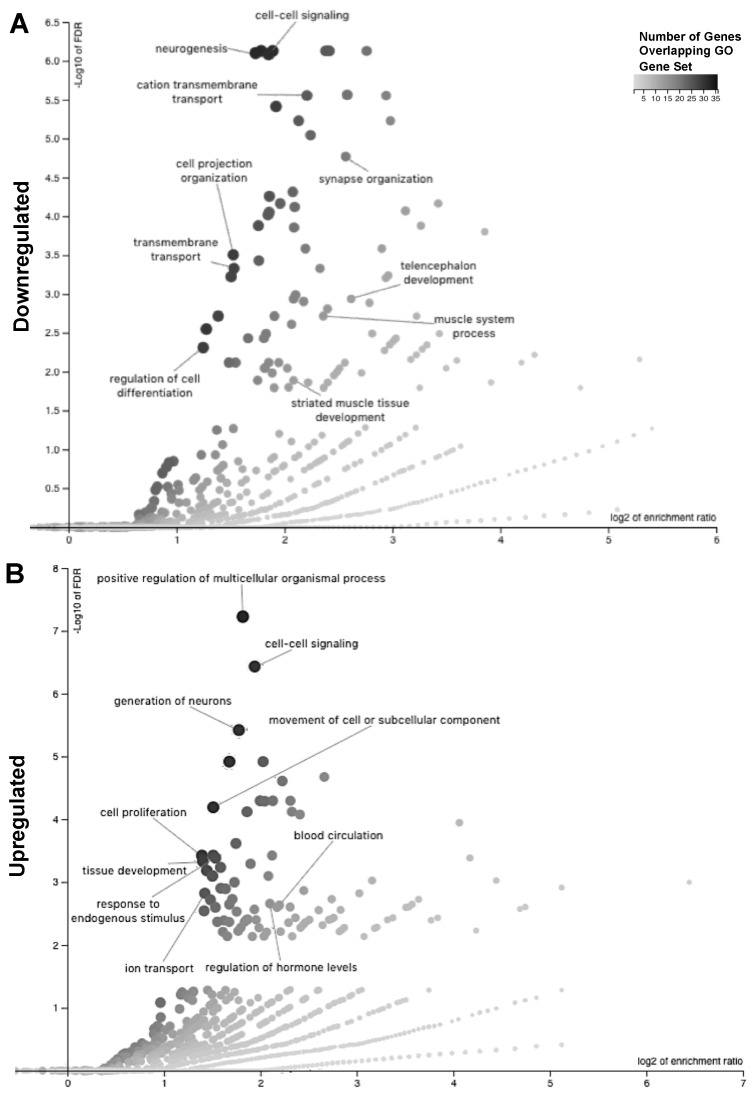
Spaceflight poses many challenges for humans. Ground-based analogs typically focus on single parameters of spaceflight and their associated acute effects. This study assesses the long-term transcriptional effects following single and combination spaceflight analog conditions using the mouse model: simulated microgravity via hindlimb unloading (HLU) and/or low-dose γ-ray irradiation (LDR) for 21 days, followed by 4 months of readaptation. Changes in gene expression and epigenetic modifications in brain samples during readaptation were analyzed by whole transcriptome shotgun sequencing (RNA-seq) and reduced representation bisulfite sequencing (RRBS). The results showed minimal gene expression and cytosine methylation alterations at 4 months readaptation within single treatment conditions of HLU or LDR. In contrast, following combined HLU+LDR, gene expression and promoter methylation analyses showed multiple altered pathways involved in neurogenesis and neuroplasticity, the regulation of neuropeptides, and cellular signaling. In brief, neurological readaptation following combined chronic LDR and HLU is a dynamic process that involves pathways that regulate neuronal function and structure and may lead to late onset neurological sequelae.

Keywords: brain; chronic low-dose irradiation; hindlimb unloading; transcriptome.


Conflict of interest statement

The authors declare no conflict of interest.

Figures

Figure 1
Figure 1
Experimental timeline and body weights during- and post-hindlimb unloading (HLU), low-dose irradiation (LDR) or combined HLU+LDR. (A) Whole brains were isolated from C57BL/6J at 4 months post-experimental conditions of hindlimb unloading (HLU, 21 days), low-dose irradiation (LDR, 0.04 Gy for 21 days) or combined LDR and HLU timeline. (B) Body weights were monitored throughout the experiment (21 days) and during readaptation (4 months post-experimental exposure). Baseline weights were taken on day 0, prior to the initiation of HLU and LDR exposure. An unpaired t-test with Welch’s correction compared experimental groups with controls. A * denotes significance of HLU only compared to controls at the 7-day timepoint. Error bars denote standard error of means. Dashed gray arrows highlight start and endpoints of experimental LDR and HLU treatments, and the final timepoint of the experiment when tissue was collected for transcriptomic analysis.
Figure 2
Figure 2
HLU in combination with LDR results in a heightened differentially expressed gene (DEG) profile in brains isolated at 4 months post-experimental conditions. DEG identified in brain isolated at 4 months post-LDR (0.04 Gy for 21 days), HLU (21 days) or combined HLU+LDR. (A) Principal component analysis (PCA) displays sample clustering within each experimental condition (n = 3–6). (B) Volcano plots indicate DEG profiles at 4 months post-experimental conditions. Vertical dashed lines indicate the Log2 fold-change cutoff used (0.263), while horizontal dashed lines indicate the adjusted p-value cutoff used (0.05). Red dots indicate differentially expressed genes that meet our adjusted p-value and Log2 fold-change cutoffs and compose our set of differentially expressed genes. Green dots indicate genes that do not meet our adjusted p-value cutoff and, therefore, are not differentially expressed. Darker saturation of color represents overlap of genes.
Figure 3
Figure 3
DEG profiles of brains isolated at 4 months post-HLU, LDR or combined HLU+LDR. (A, left panel) Graph depicts LDR versus control samples Log2 fold-change mean values (n = 3–6); (A, right panel) Heatmap displays individual DEG. (B, left panel) Graph depicts HLU versus control samples Log2 fold-change mean values (n = 3–6); (B, right panel) Heatmap displays individual DEG. (C, left panel) Graph depicts a subset of the largest Log2 fold-change gene set within combined HLU+LDR (combination) verses control samples Log2 fold-change mean values (n = 3–4); (C, right panel) Heatmap displays individual DEG.
Figure 4
Figure 4
Minimal brain differential gene expression and promoter methylation overlap across different simulated spaceflight experimental conditions. Gene lists of DEGs and the genes corresponding to the differentially methylated promoters (DMPs) were created for each condition: LDR, HLU, or HLU+LDR combined versus controls. The dotted region depicts all conditions, and the connecting lines depict DEG/DMP overlap between experimental conditions. The vertical bars indicate the size of that overlap. A single, grey dot indicates the number of DEG/DMP that do not overlap with any other DEG/DMP. The red dots indicate DMP overlap across different conditions. The blue dots indicate DEG overlap across different conditions. The black dots indicate DEG and DMP overlap. “Upregulated/downregulated” denotes gene expression of DEG and “hypermethylated/hypomethylated” denotes methylation patterns of DMPs.
Figure 5
Figure 5
Altered biological processes and pathways identified at 4 months post-combined HLU+LDR exposure. (A,B) WebGestalt graphs depict enriched gene ontology (GO) terms for downregulated (A) and upregulated (B) DEGs. The x-axis measures the enrichment ratio for each GO term on a Log2 scale. The y-axis measures -Log10 (false discovery rate, FDR). The size and color tone of the dot is proportional to the size of the category. The displayed categories are from WebGestalt’s “Weighted set cover” option, which displays the GO categories that minimize redundancy.

References

    1. Kovalchuk A., Kolb B. Low dose radiation effects on the brain-from mechanisms and behavioral outcomes to mitigation strategies. Cell Cycle. 2017;16:1266–1270. doi: 10.1080/15384101.2017.1320003. - DOI - PMC - PubMed
    1. Lawley J.S., Petersen L.G., Howden E.J., Sarma S., Cornwell W.K., Zhang R., Whitworth L.A., Williams M.A., Levine B.D. Effect of gravity and microgravity on intracranial pressure. J. Physiol. 2017;595:2115–2127. doi: 10.1113/JP273557. - DOI - PMC - PubMed
    1. Chancellor J.C., Scott G.B.I., Sutton J.P. Space Radiation: The Number One Risk to Astronaut Health beyond Low Earth Orbit. Life. 2014;4:491–510. doi: 10.3390/life4030491. - DOI - PMC - PubMed
    1. Seawright J.W., Samman Y., Sridharan V., Mao X.W., Cao M., Singh P., Melnyk S., Koturbash I., Nelson G.A., Hauer-Jensen M., et al. Effects of low-dose rate γ-irradiation combined with simulated microgravity on markers of oxidative stress, DNA methylation potential, and remodeling in the mouse heart. PloS ONE. 2017;12:e0180594. doi: 10.1371/journal.pone.0180594. - DOI - PMC - PubMed
    1. De la Torre G.G. Cognitive neuroscience in space. Life. 2014;4:281–294. doi: 10.3390/life4030281. - DOI - PMC - PubMed

MeSH terms