

Underlying Differences in Health Spending Within the World Health Organisation Europe Region-Comparing EU15, EU Post-2004, CIS, EU Candidate, and CARINFONET Countries
- PMID: 31443381
- PMCID: PMC6747367
- DOI: 10.3390/ijerph16173043
Underlying Differences in Health Spending Within the World Health Organisation Europe Region-Comparing EU15, EU Post-2004, CIS, EU Candidate, and CARINFONET Countries
Abstract
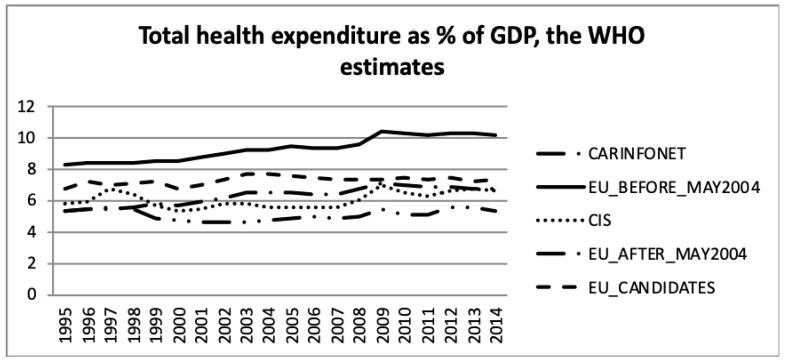
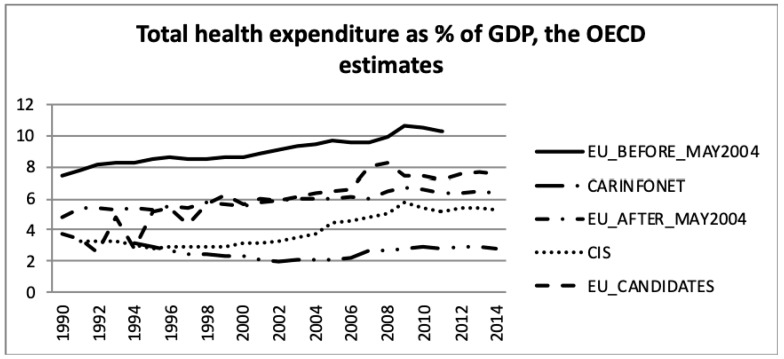
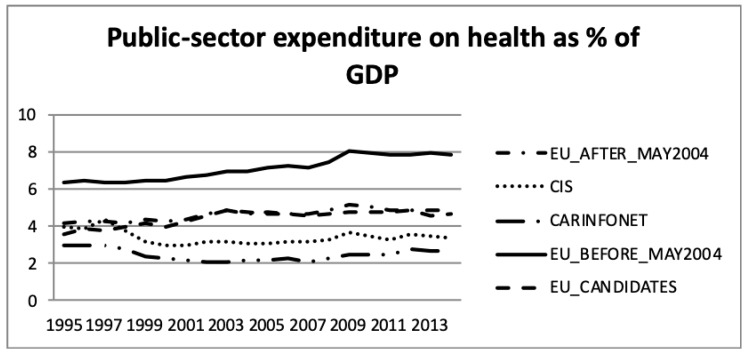
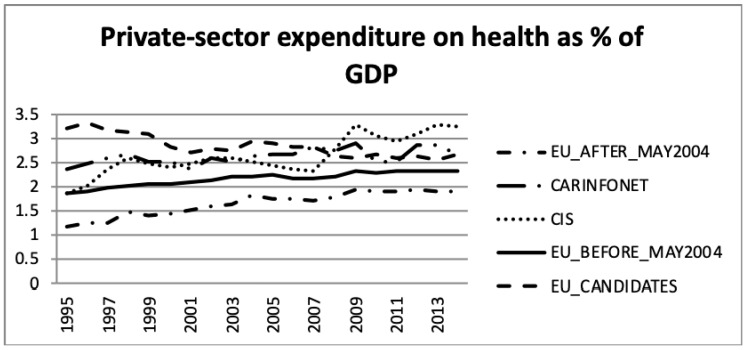
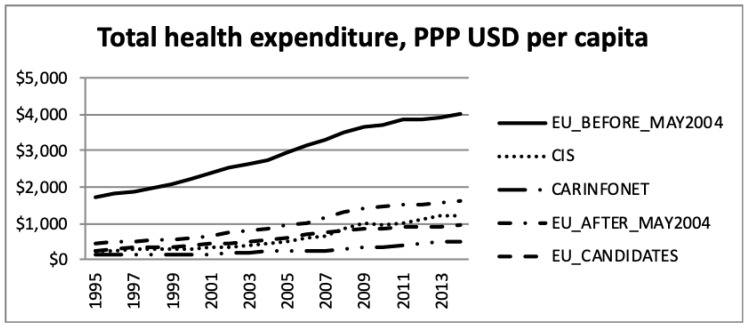
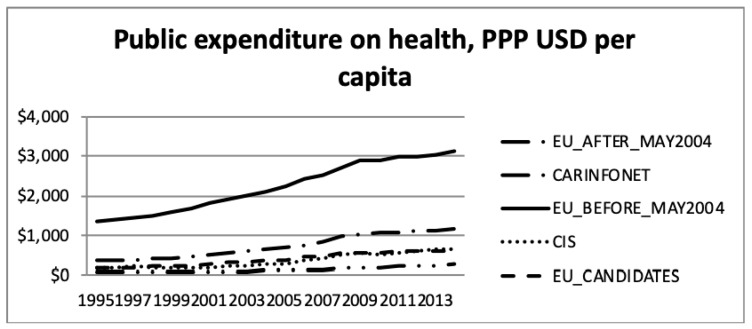
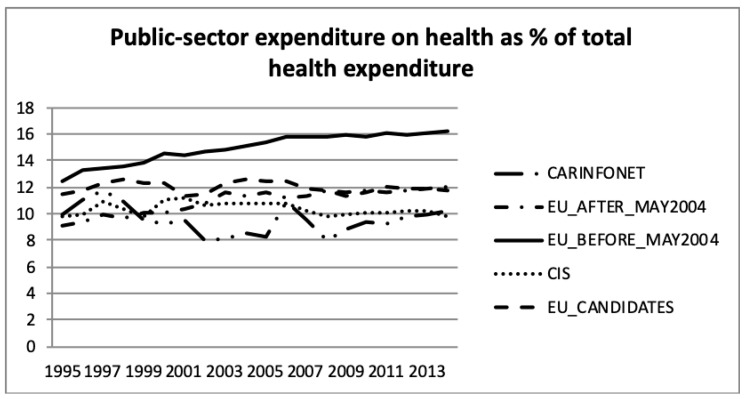
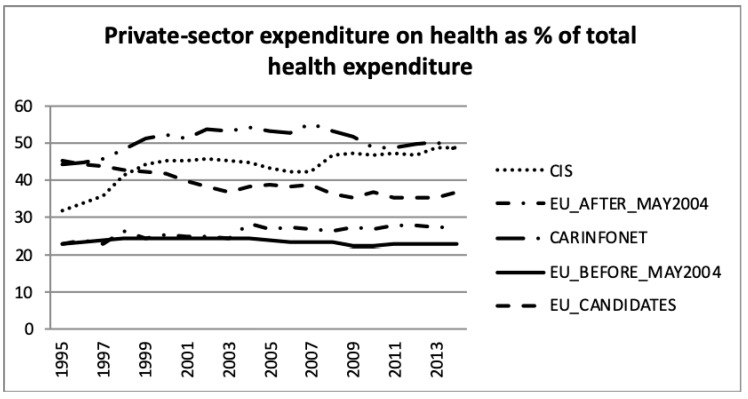
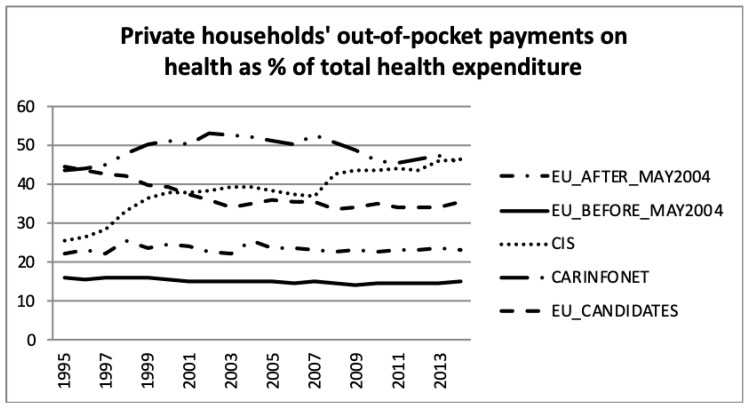
This study examined the differences in health spending within the World Health Organization (WHO) Europe region by comparing the EU15, the EU post-2004, CIS, EU Candidate and CARINFONET countries. The WHO European Region (53 countries) has been divided into the following sub-groups: EU15, EU post-2004, CIS, EU Candidate countries and CARINFONET countries. The study period, based on the availability of WHO Global Health expenditure data, was 1995 to 2014. EU15 countries have exhibited the strongest growth in total health spending both in nominal and purchasing power parity terms. The dynamics of CIS members' private sector expenditure growth as a percentage of GDP change has exceeded that of other groups. Private sector expenditure on health as a percentage of total government expenditure, has steadily the highest percentage point share among CARINFONET countries. Furthermore, private households' out-of-pocket payments on health as a percentage of total health expenditure, has been dominated by Central Asian republics for most of the period, although, for the period 2010 to 2014, the latter have tended to converge with those of CIS countries. Western EU15 nations have shown a serious growth of health expenditure far exceeding their pace of real economic growth in the long run. There is concerning growth of private health spending among the CIS and CARINFONET nations. It reflects growing citizen vulnerability in terms of questionable affordability of healthcare. Health care investment capability has grown most substantially in the Russian Federation, Turkey and Poland being the classical examples of emerging markets.
Keywords: Europe; WHO; health economics; private health expenditure; public health expenditure.
Conflict of interest statement
The authors declare no conflicts of interest.
Figures
References
-
- Kuznets S., Friedman M. Incomes from Independent Professional Practice. NBER; Berkshire, UK: 1939. Incomes from Independent Professional Practice, 1929–1936.
-
- Getzen T.E. Medical care price indexes: Theory, construction & empirical analysis of the US series 1927–1990. Adv. Health Econ. Health Serv. Res. 1992;13:83–128. - PubMed
Publication types
MeSH terms
LinkOut - more resources
Full Text Sources
