. 2019 Sep 11;26(3):400-411.e3.
doi: 10.1016/j.chom.2019.07.010. Epub 2019 Aug 20.

A Delicate Balance between Bacterial Iron and Reactive Oxygen Species Supports Optimal C. elegans Development

Affiliations

A Delicate Balance between Bacterial Iron and Reactive Oxygen Species Supports Optimal C. elegans Development

Jingyan Zhang et al. Cell Host Microbe. .

Abstract

Iron is an essential micronutrient for all forms of life; low levels of iron cause human disease, while too much iron is toxic. Low iron levels induce reactive oxygen species (ROS) by disruption of the heme and iron-sulfur cluster-dependent electron transport chain (ETC). To identify bacterial metabolites that affect development, we screened the Keio Escherichia coli collection and uncovered 244 gene deletion mutants that slow Caenorhabditis elegans development. Several of these genes encode members of the ETC cytochrome bo oxidase complex, as well as iron importers. Surprisingly, either iron or anti-oxidant supplementation reversed the developmental delay. This suggests that low bacterial iron results in high bacterial ROS and vice versa, which causes oxidative stress in C. elegans that subsequently impairs mitochondrial function and delays development. Our data indicate that the bacterial diets of C. elegans provide precisely tailored amounts of iron to support proper development.

Keywords: C. elegans; E. coli; diet; electron transport chain; flux balance analysis; iron; metabolic network modeling; metabolism; reactive oxygen species.


Conflict of interest statement

DECLARATION OF INTERESTS

The authors declare no competing interests.

Figures

Figure 1.
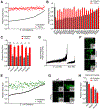
Figure 1.. Genome-Scale Screen to Identify E. coli Single Gene Deletion Mutants that Affect C. elegans Development
(A) Representative growth curve of wild type C. elegans fed wild type E. coli BW25113. Animal body size was measured by ImageJ. The dashed red line indicates the 48-hour time point used in the screen. Error bars indicate ± standard error of the mean (SEM). Number of animals used for 0, 12, 24, 36, 48, and 60 hours are 30, 34, 45, 31, 54, and 43, respectively. (B) Relative body size of C. elegans grown for 48 hours on Comamonas aquatica DA1877 relative to animals grown on the standard laboratory diet of Escherichia coli OP50. Error bars indicate ± SEM. (C) Relative body size of individual C. elegans fed the wild type E. coli BW25113 strain. Two independent experiments are shown. Each data point indicates the body size of a single animal relative to the average body size of the population. The red dashed line indicates the relative body size of 0.9, a 10% difference from the average wild type body size of 1.0. (D) Relative average body size of C. elegans fed each of 244 E. coli deletion strains (hits) that confer a >10% reduction in body size. The red dashed line is the same as described in part C. (E) Comparison of the effect of E. coli deletion strains on C. elegans development versus growth of each E. coli strain. The mean of three experiments is shown. Error bars indicate standard deviation (SD). See Figure S1A for details. (F) Luciferase developmental rate experiment for C. elegans fed a selection of 44 E. coli hits. The top line indicates animals fed the wild type E. coli BW25113 strain. L = larval stage; M = molt. The dashed red line indicates the time point at which C. elegans fed wild type E. coli BW25113 completes development (48 hours). A representative of three experiments is shown. See also Figure S2A.
Figure 2.
Figure 2.. Deletion of Different E. coli Metabolic Genes Slow C. elegans Development
(A) Pie chart showing manual functional annotations of E. coli hits that slow C. elegans development (left) and different categories of metabolic enzymes (right) among the E. coli hits. (B) E. coli electron transport chain gene deletion strains slow C. elegans development. A representative of three experiments is shown. Error bars indicate ± SEM. P≤0.05 for all of the mutants relative to wild type by Student’s t-test. (C) E. coli electron transport chain gene deletion strains contain more ROS compared to wild type E. coli. The mean of three experiments is shown. Error bars indicate ± SEM. (D) Supplementation with 10 mM of the anti-oxidant N-acetylcysteine rescues the C. elegans developmental delay caused by E. coli electron transport chain mutants. The mean of three experiments is shown. For the electron transport chain mutants, all N-acetylcysteine treated animals displayed significantly increased body size relative to untreated animals. A representative of three experiments is shown. Error bars indicate ± SEM.*P≤0.05 by Student’s t-test; n.s., not significant. (E) Cartoon illustrating the framework for determining statistical associations between metabolite increases or decreases in E. coli deletion strains and their effect on C. elegans developmental rate. The 1513 E. coli genes include the 244 hits that slow C. elegans development. The rest are non-hits for which sufficient body size data was generated. To find metabolite-gene associations, columns of the z-score matrix (ions) were correlated with the body size data (y vector). See methods for details. (F) Increased bacterial choline (left) and bacterial enterobactin (right) are significantly associated with a reduction in C. elegans developmental rate, based on the correlation analysis defined in (E). Each data point in these ion plots indicates the adjusted z-score of the ion for a particular strain. See also Figure S2B, Tables S1 and S2.
Figure 3.
Figure 3.. Low or High Iron both Slow C. elegans Development.
(A) While bacterial fep B, C, D, E, and G, and fes mutants affect C. elegans development, fepA and enterobactin synthesis mutants (ent genes) do not. A representative of three experiments is shown. Error bars indicate ± SEM.*P≤0.01 by Student’s t-test. (B) The iron chelators bipyridine and phenanthroline slow wild type C. elegans development in a dose-dependent manner. All treated samples are statistically significantly reduced in body size relative to the DMSO (vehicle control) treated animals P≤0.0001 by Student’s t-test. A representative of three experiments is shown. Error bars indicate ± SEM. (C) The slow C. elegans development on a diet of fepG mutant E. coli is rescued by supplementation of 4 mM iron. A representative of three experiments is shown. Data are represented as mean ± SEM. P≤0.05 by Student’s t-test; n.s, not significant. (D) Excess iron slows wild type C. elegans development and is lethal at the highest dose.
Figure 4.
Figure 4.. Crosstalk Between Low Bacterial Iron and High Bacterial ROS Slows C. elegans Development.
(A) Iron supplementation (4 mM) rescues the slow C. elegans development elicited by most E. coli hits. The average of three biological replicate experiments is shown. (B) A dose of 8 mM iron greatly slows the development of C. elegans fed wild type bacteria, whilst rescuing developmental rate of animals fed randomly selected set of E. coli hits. A representative of two experiments is shown. Error bars indicate ± SEM. (C) Iron supplementation (4 mM) rescues the slow development elicited by E. coli electron transport chain mutants. A representative of three experiments is shown and all iron treated animals are significantly larger in body size relative to untreated animals. Data are represented as mean ± SEM.*P≤0.05 by Student’s t-test; n.s, not significant. (D) ROS levels are elevated in E. coli hits compared to wild type E. coli and non-hits. Dashed red line indicates normalized ROS levels in wild type E. coli. The mean of three biological replicate experiments is shown and error bars indicate ± SD. (E) The anti-oxidant N-acetylcysteine (10 mM) rescues the slow C. elegans development elicited by most E. coli hits. The average of three biological replicate experiments is shown. (F) Fluorescent microscopy shows that feeding most E. coli hits to C. elegans activates the hsp-6 promoter, which is sensitive to the mitochondrial unfolded protein response. Insets show corresponding bright field images. (G) Fluorescent microscopy shows that iron supplementation (4 mM) can turn off the hsp-6 promoter in animals fed E. coli containing the fepG mutant. Insets show corresponding bright field images. (H) Metabolically inactive bacterial powder made from fepG or cyoD mutant E. coli slows C. elegans development compared to powder made from wild type E. coli. A representative of three experiments is shown and data are represented as mean ± SEM.
Figure 5.
Figure 5.. Overlay of E. coli metabolic mutant hits on the E. coli metabolic network map.
75% of E. coli metabolic hits (39 of 52) can be mapped to the core metabolic network and its immediate vicinity. A minimal flux distribution that activates all 52 genes was calculated and is indicated by blue arrows.
Figure 6.
Figure 6.. Analysis of Bacterial Metabolic Network Indicates Perturbation of Redox Homeostasis in E. coli Hits.
(A) Association between E. coli hit genes and those directly linked to reactions that generate ROS (Table S3). (B) Total flux (sum of absolute values) in ROS-generating reactions (Table S3) as a percentage of total flux in the entire network. The value shown by the red line was calculated based on the network predicted by activating 52 E. coli hits. The values in the histogram were calculated based on 10,000 networks obtained by activating the same number of (52) random metabolic genes. The P-value indicates total frequency of values to the right of the red line divided by 10,000. (C) Same as (B) for the flux sum of oxidative phosphorylation pathway instead of ROS-generating reactions. (D) Enrichment of pathways and metabolites in E. coli metabolic network. The analysis in (C) was extended to pathways other than oxidative phosphorylation.
Figure 7.
Figure 7.. Model of how E. coli mutants can slow C. elegans development.
Deletions of bacterial genes involved in the cytochrome bo oxidase (ETC) or other anti-oxidant genes when fed to C. elegans cause increases in animal ROS leading to mitochondrial dysfunction and slow development. Animal development can be rescued by the addition of antioxidants. Likewise, deletions of the ferric enterobactin import system genes fepB, fepC, fepD, fepE, fepG, and fes cause a decrease in bioavailable iron again leading to mitochondrial impairment and slow animal growth. Slow growth can be rescued by the supplementation of iron and growth can be slowed in wild type animals by iron chelators. Bioavailable iron can react with intracellular hydrogen peroxide to cause an increase in ROS via the Fenton Reaction, and a reduction in bioavailable iron.

Similar articles

Cited by

References

    1. Anderson GJ, and Frazer DM (2017). Current understanding of iron homeostasis. Am J Clin Nutr 106, 1559S–1566S. - PMC - PubMed
    1. Andrews NC (2000). Iron metabolism: iron deficiency and iron overload. Annu Rev Genomics Hum Genet 1, 75–98. - PubMed
    1. Andrews NC, and Schmidt PJ (2007). Iron homeostasis. Annu Rev Physiol 69, 69–85. - PubMed
    1. Baba T, Ara T, Hasegawa M, Takai Y, Okumura Y, Baba M, Datsenko KA, Tomita M, Wanner BL, and Mori H (2006). Construction of Escherichia coli K-12 in-frame, single-gene knockout mutants: the Keio collection. Molecular Systems Biology 2, 2006 0008. - PMC - PubMed
    1. Banerjee R, and Ragsdale SW (2003). The many faces of vitamin B12: catalysis by cobalamin-dependent enzymes. Annu Rev Biochem 72, 209–247. - PubMed

MeSH terms