. 2019 Oct;30(10):2017-2026.
doi: 10.1681/ASN.2018111156. Epub 2019 Aug 23.

Glomerular Immunodeposits of Patients with IgA Nephropathy Are Enriched for IgG Autoantibodies Specific for Galactose-Deficient IgA1

Affiliations

Glomerular Immunodeposits of Patients with IgA Nephropathy Are Enriched for IgG Autoantibodies Specific for Galactose-Deficient IgA1

Dana V Rizk et al. J Am Soc Nephrol. 2019 Oct.

Abstract

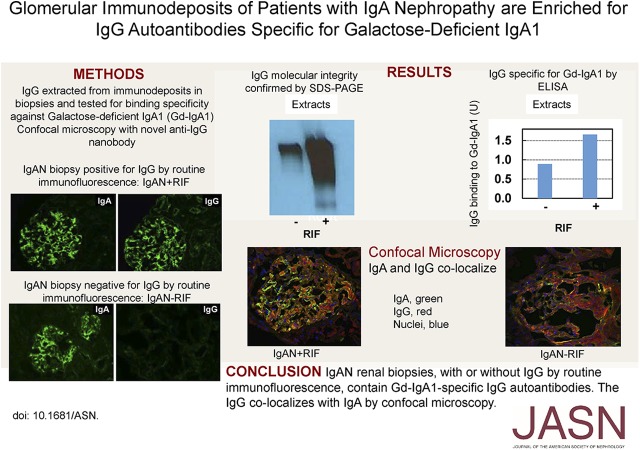
Background: IgA nephropathy (IgAN) is the leading primary GN worldwide. The disease is thought to result from glomerular deposition of circulating immune complexes of IgG bound to galactose-deficient IgA1 (Gd-IgA1). However, routine immunofluorescence microscopy fails to detect IgG in many kidney biopsies from patients with IgAN and the specificity of IgG in immunodeposits has not been tested.

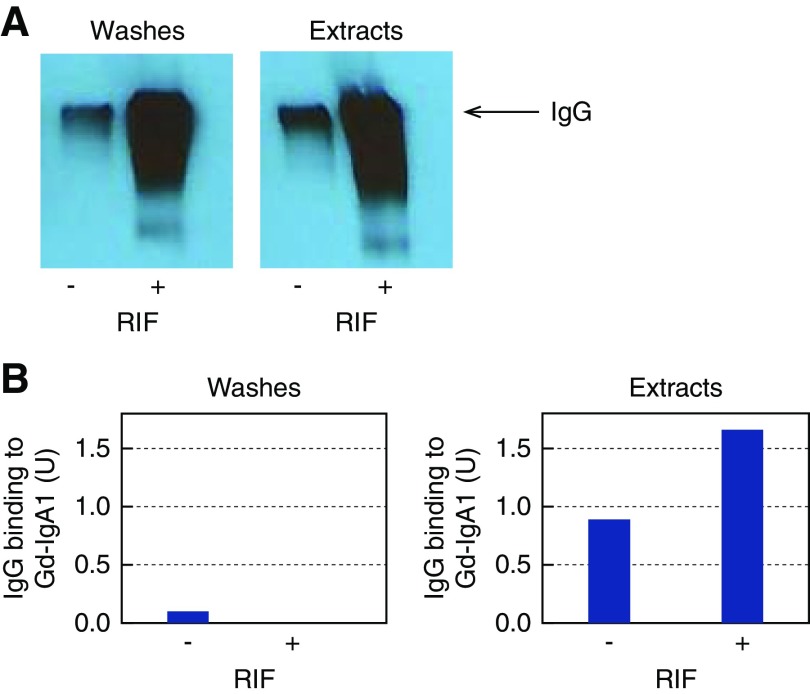
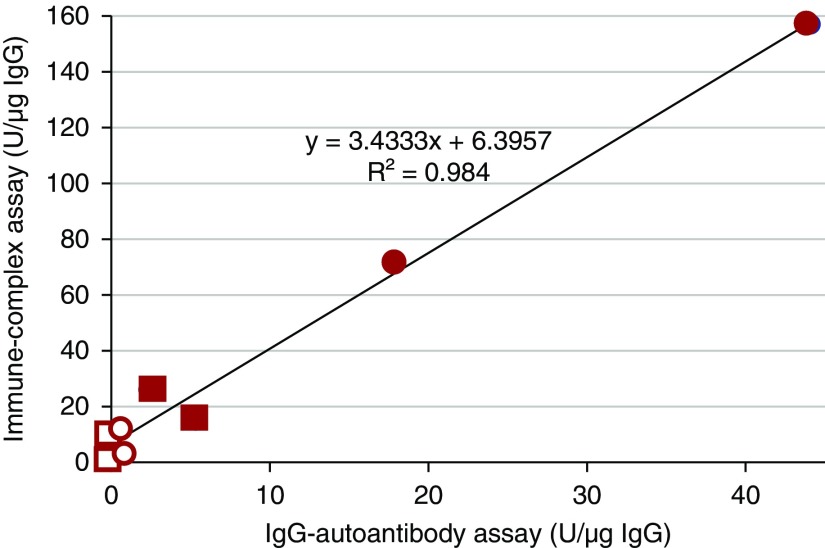
Methods: We used remnant frozen kidney-biopsy specimens from 34 patients with IgAN; 14 were IgG-positive and 20 were IgG-negative by routine immunofluorescence microscopy. Six patients with primary membranous nephropathy (MN) and eight with lupus nephritis (LN) served as controls. IgG in the kidney tissue was extracted and its amount determined by ELISA. IgG molecular integrity was assessed by SDS-PAGE immunoblotting. Antigenic specificity of extracted IgG was determined by ELISA using phospholipase A2 receptor (PLA2R) or Gd-IgA1 as antigen. In addition, ten other IgAN cases, six IgG-positive and four IgG-negative by routine immunofluorescence, were used for colocalization studies by confocal microscopy.

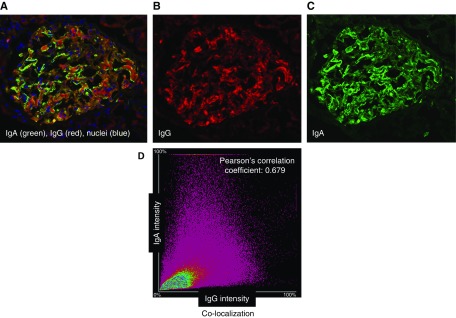
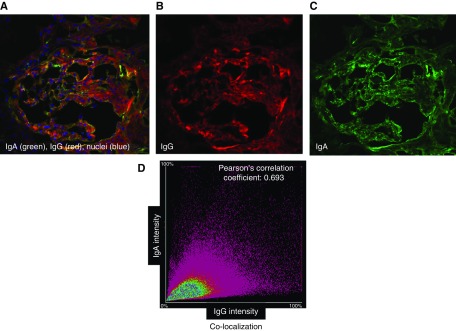
Results: IgG extracted from MN but not IgAN immunodeposits reacted with PLA2R. Conversely, IgG extracted from IgAN but not MN or LN immunodeposits reacted with Gd-IgA1. Even IgAN kidney-biopsy specimens without IgG by routine immunofluorescence microscopy had IgG specific for Gd-IgA1. Confocal microscopy confirmed the presence of IgG in the IgAN biopsies with colocalization of glomerular IgA and IgG.

Conclusions: These results reveal for the first time that IgAN kidney biopsies, with or without IgG by routine immunofluorescence, contain Gd-IgA1-specific IgG autoantibodies. These findings support the importance of these autoantibodies in the pathogenesis of IgAN.

Keywords: IgA nephropathy; autoantibody; biomarker; immunodeposits.


Figures

None
Graphical abstract
Figure 1.
Figure 1.
IgG isolated from renal immunodeposits of patients with IgAN is specific for Gd-IgA1. We pooled five biopsy specimens each using remnant frozen tissue that had been IgG-negative (IgG−RIF) (n=5; pool 5) or IgG-positive (IgG+RIF) (n=5; pool 2) by routine immunofluorescence microscopy and used the pools for immunodeposits extraction. (A) SDS-PAGE of washes and extracts under nonreducing conditions followed by immunodetection of IgG by Western blot confirmed the molecular integrity of isolated IgG. Arrow denotes IgG protein band. (B) Analysis of extracts from renal immunodeposits indicated enrichment for IgG autoantibodies specific for Gd-IgA1, as detected by IgG-IgA1 immune-complex assay. One unit (U) was defined as the amount of IgG resulting in optical density (OD) at 490 nm equal to 1.0. RIF, routine immunofluorescence; −, IgG-negative; +, IgG-positive.
Figure 2.
Figure 2.
IgG isolated from renal immunodeposits of patients with IgAN but not from renal immunodeposits of patients with MN is specific for Gd-IgA1. Individual IgG samples from two patients with MN, pooled samples for four patients with IgG+RIF IgAN (pool 3), and five patients with IgG-RIF IgAN (pool 7) were assessed in two tests using Gd-IgA1 as the antigen: IgG-IgA1 immune-complex assay and IgG autoantibody assay. One unit (U) was defined as the amount of IgG resulting in optical density (OD) at 490 nm equal to 1.0. Results of the two assays for washes and extracts show excellent correlation (r2=0.98) by Pearson test. Filled circles denote extracts from the two pools of IgAN biopsies; filled squares denote extracts from two MN biopsies. Empty circles denote washes from the same two pools of IgAN biopsies, and empty squares denote washes from the same two MN biopsies.
Figure 3.
Figure 3.
Confocal microscopic analyses of glomerular Ig deposits of a patient with IgAN with IgG by routine immunofluorescence microscopy show colocalization of IgG and IgA. A remnant frozen kidney-biopsy specimen from a patient with IgAN with IgG staining by routine immunofluorescence microscopy was stained with antibodies against IgA (Cy2, green) and IgG (Alexa 555, red), and a DNA stain (DAPI, blue). (A–C) Single-layer confocal microscopy images with three combined colors (A), red (B), and green (C). (D) Image analysis of entire glomerular area indicated colocalization of individual components, IgA and IgG in glomerular deposits. For this sample, Pearson correlation coefficient (r) is 0.68. Pearson correlation coefficient (r) with value of 1.0 would indicate 100% colocalization.
Figure 4.
Figure 4.
Confocal microscopic analyses of glomerular deposits of a patient with IgAN without IgG by routine immunofluorescence microscopy detect IgG and show colocalization of IgG and IgA. A remnant frozen kidney-biopsy specimen from a patient with IgAN without IgG staining by routine immunofluorescence microscopy was stained with antibodies against IgA (Cy2, green) and IgG (Alexa 555, red), and a DNA stain (DAPI, blue). (A–C) Single-layer confocal microscopy images with three combined colors (A), red (B), and green (C). (D) Image analysis of entire glomerular area indicated colocalization of individual components, IgA and IgG, in glomerular deposits. For this sample, Pearson correlation coefficient (r) is 0.69. Pearson correlation coefficient (r) with value of 1.0 would indicate 100% colocalization.

References

    1. Wyatt RJ, Julian BA: IgA nephropathy. N Engl J Med 368: 2402–2414, 2013 - PubMed
    1. Suzuki H, Kiryluk K, Novak J, Moldoveanu Z, Herr AB, Renfrow MB, et al. .: The pathophysiology of IgA nephropathy. J Am Soc Nephrol 22: 1795–1803, 2011 - PMC - PubMed
    1. Hiki Y, Odani H, Takahashi M, Yasuda Y, Nishimoto A, Iwase H, et al. .: Mass spectrometry proves under-O-glycosylation of glomerular IgA1 in IgA nephropathy. Kidney Int 59: 1077–1085, 2001 - PubMed
    1. Allen AC, Bailey EM, Brenchley PE, Buck KS, Barratt J, Feehally J: Mesangial IgA1 in IgA nephropathy exhibits aberrant O-glycosylation: Observations in three patients. Kidney Int 60: 969–973, 2001 - PubMed
    1. Wada Y, Ogata H, Takeshige Y, Takeshima A, Yoshida N, Yamamoto M, et al. .: Clinical significance of IgG deposition in the glomerular mesangial area in patients with IgA nephropathy. Clin Exp Nephrol 17: 73–82, 2013 - PMC - PubMed

Publication types

LinkOut - more resources