. 2019 Aug 23;10(1):3835.
doi: 10.1038/s41467-019-11680-1.

Genomic landscape and chronological reconstruction of driver events in multiple myeloma

Affiliations

Genomic landscape and chronological reconstruction of driver events in multiple myeloma

Francesco Maura et al. Nat Commun. .

Abstract

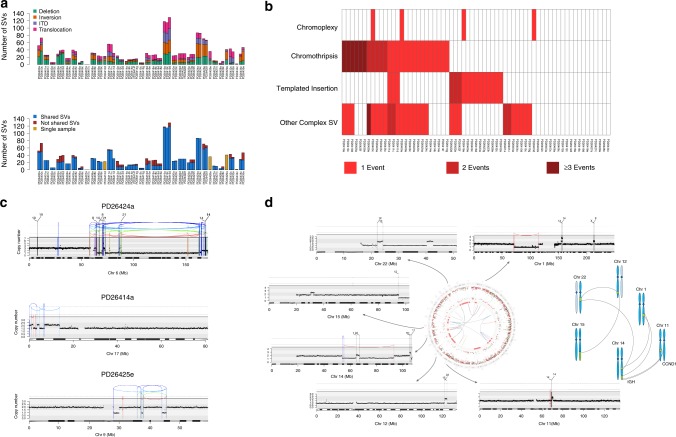
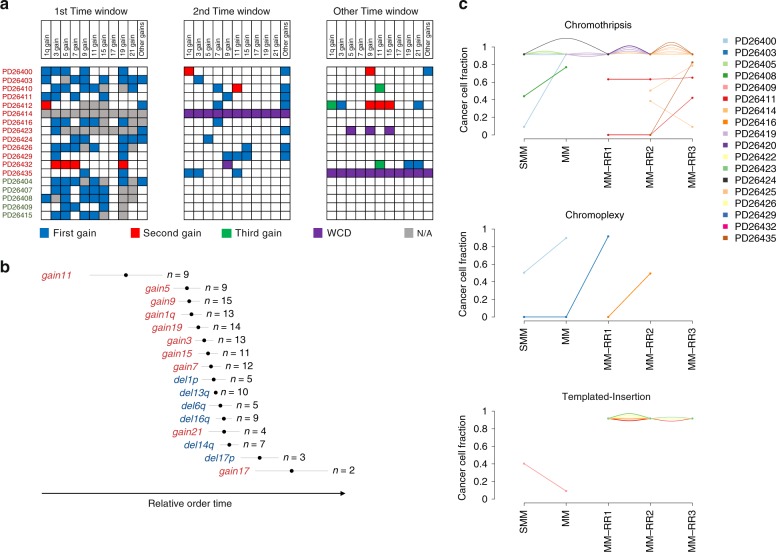
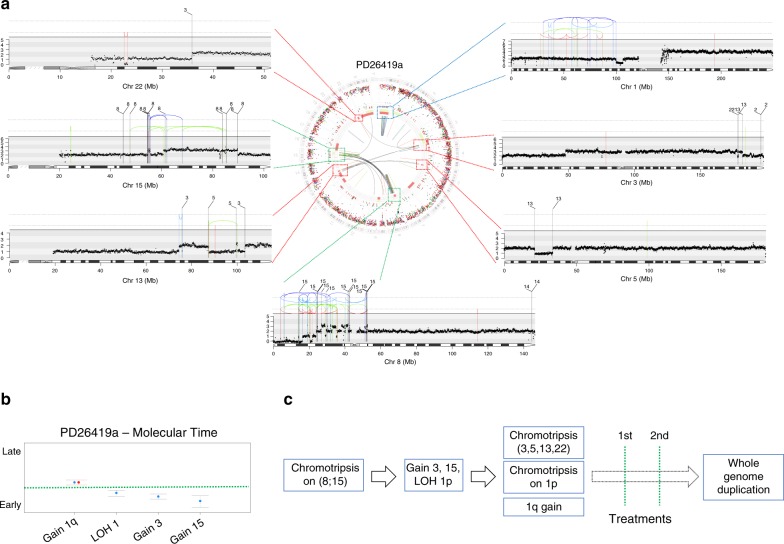
The multiple myeloma (MM) genome is heterogeneous and evolves through preclinical and post-diagnosis phases. Here we report a catalog and hierarchy of driver lesions using sequences from 67 MM genomes serially collected from 30 patients together with public exome datasets. Bayesian clustering defines at least 7 genomic subgroups with distinct sets of co-operating events. Focusing on whole genome sequencing data, complex structural events emerge as major drivers, including chromothripsis and a novel replication-based mechanism of templated insertions, which typically occur early. Hyperdiploidy also occurs early, with individual trisomies often acquired in different chronological windows during evolution, and with a preferred order of acquisition. Conversely, positively selected point mutations, whole genome duplication and chromoplexy events occur in later disease phases. Thus, initiating driver events, drawn from a limited repertoire of structural and numerical chromosomal changes, shape preferred trajectories of evolution that are biologically relevant but heterogeneous across patients.


Conflict of interest statement

The authors declare no competing interests.

Figures

Fig. 1
Fig. 1
The landscape of exome-based driver events MM. a Landscape of driver mutations in MM. Each bar represents a distinct positively selected gene and each bar’s color indicates its prevalence across the main MM cytogenetic subgroups. b We built the optimal Bayesian network by considering the recurrent SVs and CNAs (n = 14) and driver SNVs (n = 55) across 724 MM patients, where the final list of 69 variables was assessed. To further investigate the type of recurrence patterns we fitted logic gates between parent and child nodes in the network. The gate combination with the most significant Fisher exact test p value was selected. The line width is proportional to the log hazard ratio of the test. Dashed lines represent non-significant associations (p > 0.05). CNAs and translocations were colored in brown and light blue respectively. The thickness of the outline of each box is proportional to the prevalence of the event across the entire series. c The heatmap showing the main MM genomic subgroups across 724 MM patients. The genomic profile of each cluster was generated by integrating the hierarchical Dirichlet process and Bayesian network data. Rows in the graph represent individual genomic lesions, and the columns represent patients
Fig. 2
Fig. 2
The landscape of structural variants (SVs) in MM. a Top, prevalence of SVs across the entire series. Bottom, the proportion of SVs shared between samples collected at different time points within the same patients. b A heatmap representing the distribution and prevalence of the main complex events: chromothripsis, chromoplexy, and templated insertions. c Three examples of chromothripsis. In these plots, the red arch represents a deletion, the green arch represents an internal tandem duplication (ITD) and the blue arch represents an inversion. d Example of templated insertion. In the middle, the genome plot of patient PD26422 represents all main genomic events: mutations (external circle), indels (middle circle; dark green and red lines represent insertions and deletions respectively), copy-number variants (red = deletions, green = gain) and rearrangements (blue = inversions, red = deletionss, green = ITDs, black = translocations). Externally, a copy-number/rearrangement plot of each chromosome involved in the templated insertion is provided, highlighting a focal CNA around each breakpoint. This case represents a clear example of how templated insertion may involve critical driver oncogenes, like CCND1 in this case. A schematic representation of this sample templated insertion is reported on the right
Fig. 3
Fig. 3
Timing the clonal number changes in MM. a Summary of the sample’s ploidy for the entire series. Samples with ploidy > 3 (above the dashed red line) were considered as whole-genome duplication (WGD). b The copy-number profile of a MM patient (PD26419) that experienced a WGD at relapse: gold line = total copy number, gray = copy number of the minor allele. The presence of more than 1 cytogenetic segment is compatible with the existence of a subclonal CNA whose CCF is proportional to the segment thickness. ce Left, standard copy number profile of 3 hyperdiploid MMs. Right, the molecular time (blue dots) estimated for each clonal gain and copy-neutral loss of heterozygosity (“Methods”). Red dots represent the molecular time of a second extra gain occurred on a previous one. Dashed green lines separate multi gain events occurring at different time windows
Fig. 4
Fig. 4
The chronological reconstruction of aneuploidies acquisition in MM. a Heatmaps representing the cumulative acquisition of copy-number gains observed in 13/18 hyperdiploid patients, labeled in red if the final HRD profile was generated by multiple and independent events (n = 13) or green if the trisomies were acquired in one single time window (n = 5). Boxes are color-coded based on the relative order of acquisition of each event; WCD = whole chromosome duplication. b A Bradley–Terry model based on the integration between the CCF and molecular time of each recurrent CNAs (gains = red and deletions = blue) for all 30 MM cases included in this study. Segments were ordered from the earliest (top) to the latest (bottom) occurring in relative time from sampling. The time scale (X-axis) is relative since timing of genomic evolution is variable from case to case and not easily correlated to age. c Cancer cell fraction of each single complex event for each patient over the time
Fig. 5
Fig. 5
Defining the relative order of acquisition of the key driver events. a Genome plot of patient PD26419a where the three chromothripsis events [(8;15), (3;5;13;22) and 1p] were highlighted with different colored dashed lines connected to specific rearrangements/copy-number plots. In these plots, the red arch represents a deletion, the green arch represents an ITD and the blue arch represents an inversion. b Molecular time of the main clonal gains and CN-LOH in the PD26419a sample. This data suggested the existence of at least two independent time windows: the first involving alterations on chromosomes 3, 15, and 1p and the second chromosome 1q. c The driver events of patient PD26419 are reconstructed in chronological order
Fig. 6
Fig. 6
The chronological reconstruction of driver events in MM. Phylogenetic trees generated from the Dirichlet process analysis (“Methods”). The root (always colored in red) and branch length are proportional to the (sub)clone mutational load. All main drivers (CNAs, SNVs, and SVs) were annotated according to their chronological occurrence. Early clonal events (root) were chronologically annotated on the right, when it was possible to establish a specific time window. Here, all different root time windows were separated by a green line. Conversely, early drivers without a clear timing were grouped together on the left of the root. All driver events that occurred in the root were reported with larger font size. Patients were grouped according to the genomic clustering shown in Fig. 1c, and color-coded accordingly. TI = templated insertion

References

    1. Corre J, Munshi N, Avet-Loiseau H. Genetics of multiple myeloma: another heterogeneity level? Blood. 2015;125:1870–1876. doi: 10.1182/blood-2014-10-567370. - DOI - PMC - PubMed
    1. Manier S, et al. Genomic complexity of multiple myeloma and its clinical implications. Nat. Rev. Clin. Oncol. 2017;14:100–113. doi: 10.1038/nrclinonc.2016.122. - DOI - PubMed
    1. Morgan GJ, Walker BA, Davies FE. The genetic architecture of multiple myeloma. Nat. Rev. Cancer. 2012;12:335–348. doi: 10.1038/nrc3257. - DOI - PubMed
    1. Walker BA, et al. APOBEC family mutational signatures are associated with poor prognosis translocations in multiple myeloma. Nat. Commun. 2015;6:6997. doi: 10.1038/ncomms7997. - DOI - PMC - PubMed
    1. Bolli N, et al. Heterogeneity of genomic evolution and mutational profiles in multiple myeloma. Nat. Commun. 2014;5:2997. doi: 10.1038/ncomms3997. - DOI - PMC - PubMed

Publication types