. 2019 Aug 23;10(1):3838.
doi: 10.1038/s41467-019-11718-4.

Tumor exosome-based nanoparticles are efficient drug carriers for chemotherapy

Affiliations

Tumor exosome-based nanoparticles are efficient drug carriers for chemotherapy

Tuying Yong et al. Nat Commun. .

Abstract

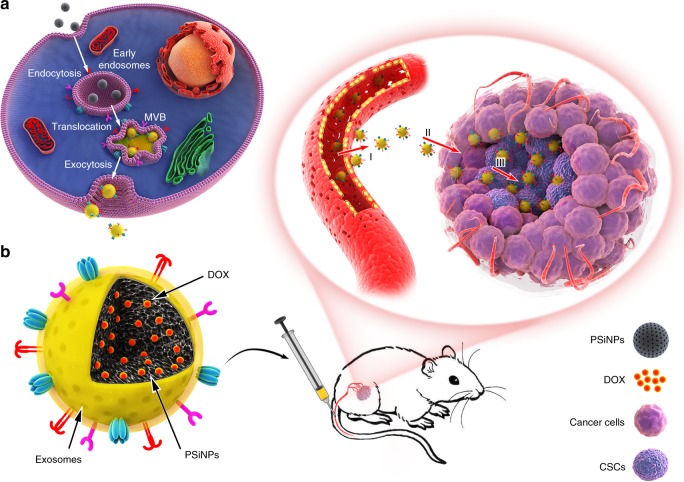
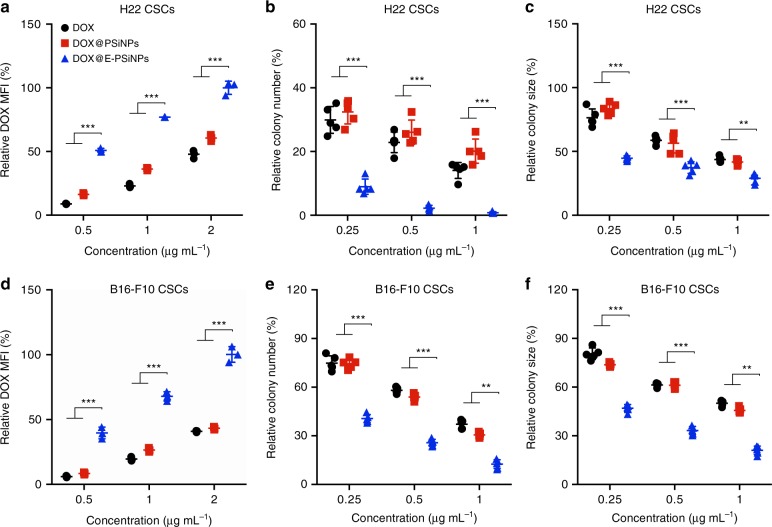
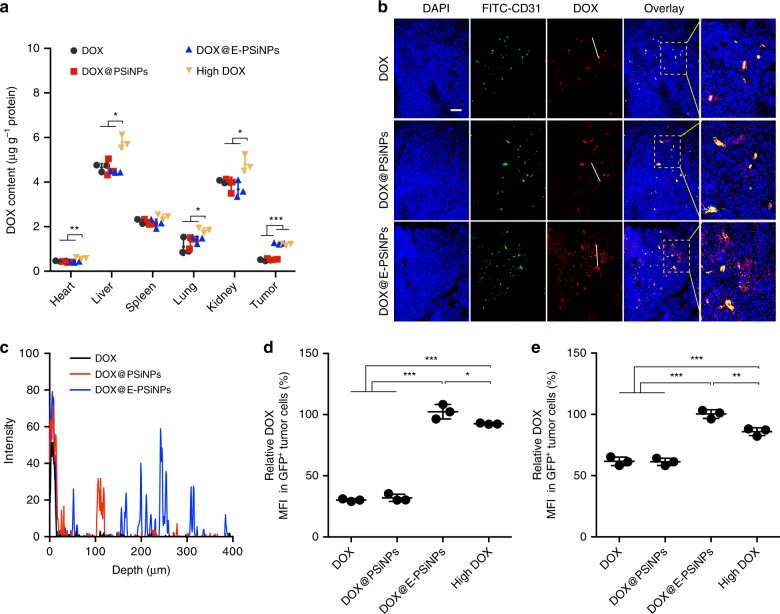
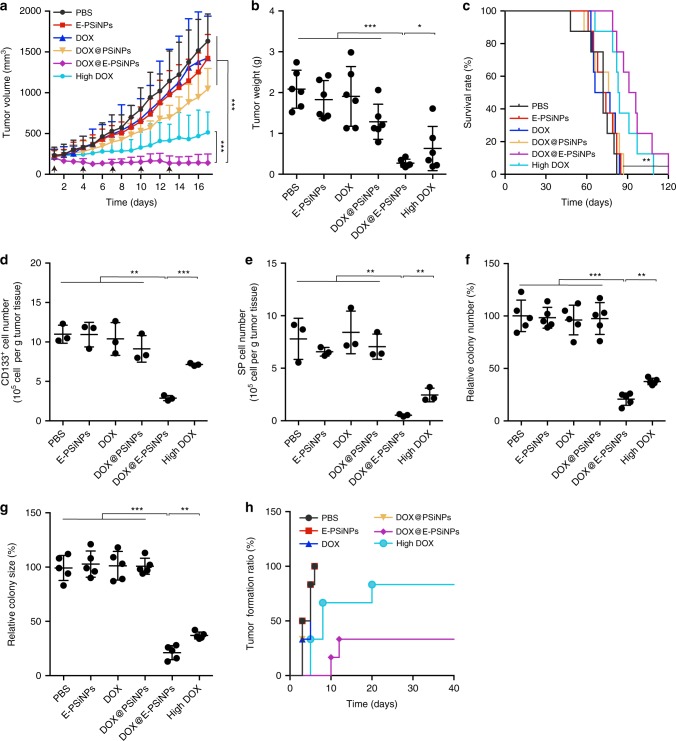
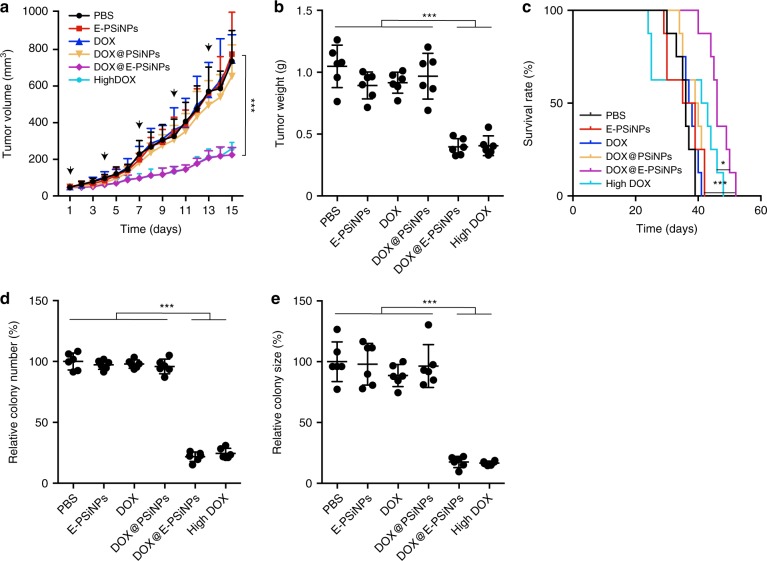
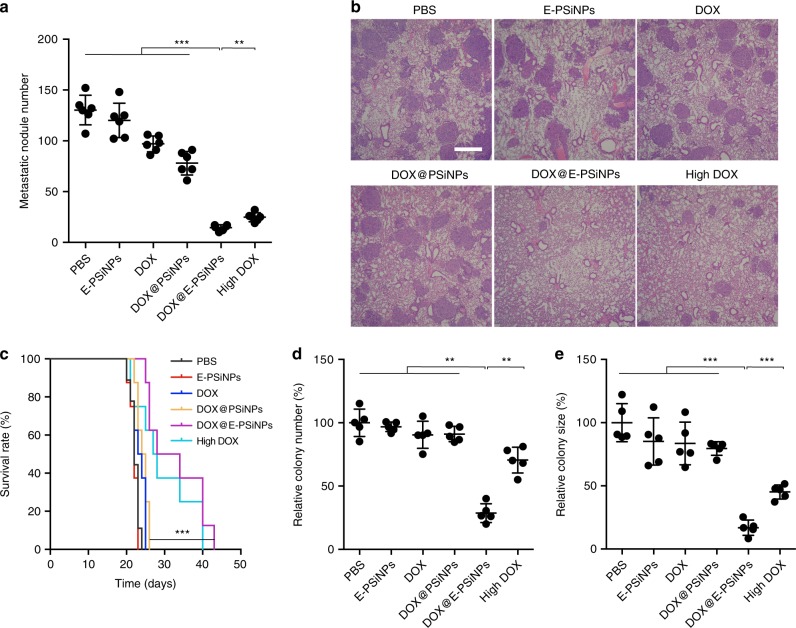
Developing biomimetic nanoparticles without loss of the integrity of proteins remains a major challenge in cancer chemotherapy. Here, we develop a biocompatible tumor-cell-exocytosed exosome-biomimetic porous silicon nanoparticles (PSiNPs) as drug carrier for targeted cancer chemotherapy. Exosome-sheathed doxorubicin-loaded PSiNPs (DOX@E-PSiNPs), generated by exocytosis of the endocytosed DOX-loaded PSiNPs from tumor cells, exhibit enhanced tumor accumulation, extravasation from blood vessels and penetration into deep tumor parenchyma following intravenous administration. In addition, DOX@E-PSiNPs, regardless of their origin, possess significant cellular uptake and cytotoxicity in both bulk cancer cells and cancer stem cells (CSCs). These properties endow DOX@E-PSiNPs with great in vivo enrichment in total tumor cells and side population cells with features of CSCs, resulting in anticancer activity and CSCs reduction in subcutaneous, orthotopic and metastatic tumor models. These results provide a proof-of-concept for the use of exosome-biomimetic nanoparticles exocytosed from tumor cells as a promising drug carrier for efficient cancer chemotherapy.


Conflict of interest statement

The authors declare no competing interests.

Figures

Fig. 1
Fig. 1
Schematic illustration of E-PSiNPs as drug carriers for targeted cancer chemotherapy. a Schematic illustration of the preparation of DOX@E-PSiNPs. DOX@PSiNPs are endocytosed into cancer cells after incubation, then localized in multivesicular bodies (MVBs) and autophagosomes. After MVBs or amphisomes fuse with cell membrane, DOX@E-PSiNPs are exocytosed into extracellular space. b Schematics showing how DOX@E-PSiNPs effeciently target tumor cells after intravenous injection into tumor-bearing mice. (I) DOX@E-PSiNPs effeciently accumulate in tumor tissues; (II) DOX@E-PSiNPs penetrate deeply into tumor parenchyma; and (III) DOX@E-PSiNPs are efficently internalized into bulk cancer cells and CSCs to produce strong anticancer efficacy
Fig. 2
Fig. 2
Role of autophagy in the exocytosis of PSiNPs. a LC3-I and LC3-II expression in Bel7402 cells treated with 200 μg mL−1 PSiNPs for different time intervals by western blot. The number underneath each group in the immunoblotting indicates the relative ratio of LC3-II to LC3-I of the corresponding group. b Confocal fluorescence microscopic images of EGFP-LC3-transfected Bel7402 cells after treatment with 200 μg mL−1 PSiNPs for different time intervals. Scale bar: 20 μm. c Relative amount of the exocytosed PSiNPs in Bel7402 cells after treatment with 200 μg mL−1 PSiNPs for 6 h, followed by washing with PBS and then incubating in fresh medium with or without 5 mM of 3-MA, 200 nM of rapamycin or 30 μM of CBZ for another 16 h by ICP-OES. d Relative amount of the exocytosed PSiNPs in wild type and Atg7−/− MEF cells after treatment with 200 µg mL−1 PSiNPs for 6 h, followed by washing with PBS and then incubating in fresh medium for 16 h by ICP-OES. Data were represented as mean ± SD (n = 3). *P < 0.05, **P < 0.01 (one-way ANOVA with Fisher’s LSD test for c and unpaired two-tailed Student’s t test for d). Source data are provided as a Source Data file
Fig. 3
Fig. 3
Evaluation of exosomes sheathed on PSiNPs in E-PSiNPs. a Hydrodynamic diameter of PSiNPs and E-PSiNPs by DLS analysis. b TEM images of PSiNPs and E-PSiNPs. Scale bar: 200 nm. c Colocalization of DiO (green) and PSiNPs (red) in E-PSiNPs by confocal microscopy. Scale bar: 20 μm. d Colocalization of CD63 (green) and PSiNPs (red) in E-PSiNPs by confocal microscopy. Scale bar: 20 μm. e Immunoblotting analysis of exosome markers (TSG101 and CD63) and ER marker (calnexin) expressed in E-PSiNPs exocytosed from Bel7402 cells. f Yield of E-PSiNPs when Bel7402 cells were pretreated with 200 μg mL−1 PSiNPs for 6 h and then incubated in fresh medium containing 15 nM DMA or 10 μM ionomycin for 16 h by ICP-OES. Data were represented as mean ± SD (n = 3). **P < 0.01, ***P < 0.001 (one-way ANOVA with Fisher’s LSD test). Source data are provided as a Source Data file
Fig. 4
Fig. 4
Characterization of DOX@E-PSiNPs. a Colocalization of DiO, DOX, and PSiNPs in DOX@E-PSiNPs exocytosed from Bel7402 cells by confocal microscopy. Scale bar: 1 µm. b Hydrodynamic diameter of E-PSiNPs and DOX@E-PSiNPs by DLS. c Hydrodynamic diameter of E-PSiNPs incubating in PBS with or without 10% FBS for different time intervals. d Degradation behavior of PSiNPs, E-PSiNPs and DOX@E-PSiNPs in PBS at 37 °C. e In vitro DOX release profiles of DOX@PSiNPs and DOX@E-PSiNPs in PBS at pH 7.4 by dialysis bag. Data were presented as mean ± SD (n = 3). ***P < 0.001 (one-way ANOVA with Bonferroni’s multiple comparisons test for d and unpaired two-tailed Student’s t test for e). Source data are provided as a Source Data file
Fig. 5
Fig. 5
Cellular uptake and cytotoxicity of DOX@E-PSiNPs against CSCs. a, d Relative DOX mean fluorescence intensity (MFI) when H22 CSCs (a) and B16-F10 CSCs (d) selected in soft 3D fibrin gels were treated with free DOX, DOX@PSiNPs or DOX@E-PSiNPs exocytosed from H22 cells at different DOX concentrations for 2 h by flow cytometry. Data were represented as mean ± SD (n = 3). b, e Relative colony number of tumor spheroids when H22 (b) and B16-F10 cells (e) were pretreated with free DOX, DOX@PSiNPs or DOX@E-PSiNPs exocytosed from H22 cells at different DOX concentrations for 4 h and then seeded in soft 3D fibrin gels for 5 days. c, f Relative colony size of tumor spheroids when H22 (c) and B16-F10 cells (f) were pretreated with free DOX, DOX@PSiNPs or DOX@E-PSiNPs exocytosed from H22 cells at different DOX concentrations for 4 h and then seeded in soft 3D fibrin gels for 5 days. Data were represented as mean ± SD (n = 5). **P < 0.01, ***P < 0.001 (two-way ANOVA with Bonferroni’s multiple comparisons test). Source data are provided as a Source Data file
Fig. 6
Fig. 6
Accumulation and penetration of DOX@E-PSiNPs into tumor parenchyma. a DOX content in tumor tissues and major organs of H22 tumor-bearing mice at 24 h after intravenous injection of DOX, DOX@PSiNPs or DOX@E-PSiNPs at DOX dosage of 0.5 mg kg−1, or high dosage of DOX at 4 mg kg−1. b Colocalization of DOX and CD31-labeled tumor vessels in tumor sections of H22 tumor-bearing mice at 24 h after intravenous injection of DOX, DOX@PSiNPs or DOX@E-PSiNPs at DOX dosage of 0.5 mg kg−1. Scale bar: 200 µm. White lines represent the distance between DOX in blood vessels and DOX in tumor parenchyma. c DOX distribution profile from the blood vessels to tumor tissues on the specified white lines as indicated in b. d, e Relative DOX fluorescence intensity in GFP-positive tumor cells (d) and side population cells (e) of tumor tissues at 24 h after GFP-expressing H22 tumor-bearing mice were intravenously injected with DOX, DOX@PSiNPs or DOX@ E-PSiNPs at DOX dosage of 0.5 mg kg−1, or high dosage of DOX at 4 mg kg−1. Data were represented as mean ± SD (n = 3). *P < 0.05, **P < 0.01, ***P < 0.001 (two-way ANOVA with Bonferroni’s multiple comparisons test for a and one-way ANOVA with Bonferroni’s multiple comparisons test for d, e). Source data are provided as a Source Data file
Fig. 7
Fig. 7
Anticancer activity of DOX@E-PSiNPs in H22 tumor-bearing mice. a Tumor growth curves of H22 tumor-bearing mice after intravenous injection of PBS, E-PSiNPs, free DOX, DOX@PSiNPs, DOX@E-PSiNPs exocytosed from H22 cells at DOX dosage of 0.5 mg kg−1, or free DOX at high dosage of 4 mg kg−1. The arrows indicate the drug injection time. Data were represented as mean ± SD (n = 14). b Weight of tumor tissues at the end of tumor growth inhibition experiments. Data were represented as mean ± SD (n = 6). c Kaplan–Meier survival plot of H22 tumor-bearing mice after intravenous administration of different formulations (n = 8). d Number of CD133-postive cells in tumor tissues at the end of tumor growth inhibition experiments. e Number of side population cells in GFP-positive tumor cells of GFP-expressing H22 tumor-bearing mice at the end of tumor growth inhibition experiments as above. Data were represented as mean ± SD (n = 3). f, g Relative colony number (f) and size (g) of tumor spheroids when tumor cells digested from tumor tissues of H22 tumor-bearing mice at the end of tumor growth inhibition experiments were seeded in soft 3D fibrin gels for 5 days. Data were represented as mean ± SD (n = 5). h Tumor formation ratio in BALB/c mice after subcutaneous injection of tumor cells (106 cells per mouse) from tumor tissues of H22 tumor-bearing mice after treatment as above. *P < 0.05, **P < 0.01, ***P < 0.001 (one-way ANOVA with Bonferroni’s multiple comparisons test for a, b, and dg and log-rank test for c). Source data are provided as a Source Data file
Fig. 8
Fig. 8
Anticancer activity of DOX@E-PSiNPs in orthotopic 4T1 tumor-bearing mice. a Tumor growth curves of orthotopic 4T1 tumor-bearing mice after intravenous injection of PBS, E-PSiNPs, free DOX, DOX@PSiNPs, DOX@E-PSiNPs exocytosed from H22 cells at DOX dosage of 0.5 mg kg−1, or free DOX at high dosage of 4 mg kg−1. The arrows indicate the drug injection time. Data were represented as mean ± SD (n = 14). b Weight of tumor tissues at the end of tumor growth inhibition experiments. Data were represented as mean ± SD (n = 6). c Kaplan–Meier survival plot of 4T1 tumor-bearing mice after intravenous administration of different formulations (n = 8). d, e Relative colony number (d) and size (e) of tumor spheroids when tumor cells digested from tumor tissues of 4T1 tumor-bearing mice at the end of tumor growth inhibition experiments were seeded in soft 3D fibrin gels for 5 days. Data were represented as mean ± SD (n = 6). *P < 0.05, ***P < 0.001 (one-way ANOVA with Bonferroni’s multiple comparisons test for a, b, d, e and log-rank test for c). Source data are provided as a Source Data file
Fig. 9
Fig. 9
Anticancer activity of DOX@E-PSiNPs in B16-F10 lung metastasis mice. a Metastatic nodule numbers in lungs of B16-F10 tumor-bearing mice after intravenous injection of PBS, E-PSiNPs, free DOX, DOX@PSiNPs, DOX@E-PSiNPs exocytosed from H22 cells at DOX dosage of 0.5 mg kg−1, or free DOX at high dosage of 4 mg kg−1 every three days for 13 days. Data were represented as mean ± SD (n = 6). b H&E staining of lungs of B16-F10 tumor-bearing mice at the end of tumor growth inhibition experiments. Scale bar: 1000 µm. c Kaplan–Meier survival plot of B16-F10 tumor-bearing mice after intravenous administration of different formulations (n = 8). d, e Relative colony number (d) and size (e) of tumor spheroids when tumor cells digested from lung tumor nodules at the end of tumor growth inhibition experiments were seeded in soft 3D fibrin gels for 5 days. Data were represented as mean ± SD (n = 5). **P < 0.01, ***P < 0.001 (one-way ANOVA with Bonferroni’s multiple comparisons test for a, d, e and log-rank test for c). Source data are provided as a Source Data file

References

    1. Peer D, et al. Nanocarriers as an emerging platform for cancer therapy. Nat. Nanotech. 2007;2:751–760. doi: 10.1038/nnano.2007.387. - DOI - PubMed
    1. Maeda H, Nakamura H, Fang J. The EPR effect for macromolecular drug delivery to solid tumors: improvement of tumor uptake, lowering of systemic toxicity, and distinct tumor imaging in vivo. Adv. Drug Deliv. Rev. 2013;65:71–79. doi: 10.1016/j.addr.2012.10.002. - DOI - PubMed
    1. Mitragotri S, Burke PA, Langer R. Overcoming the challenges in administering biopharmaceuticals: formulation and delivery strategies. Nat. Rev. Drug Discov. 2014;13:655–672. doi: 10.1038/nrd4363. - DOI - PMC - PubMed
    1. Cheng CJ, et al. A holistic approach to targeting disease with polymeric nanoparticles. Nat. Rev. Drug Discov. 2015;14:239–247. doi: 10.1038/nrd4503. - DOI - PMC - PubMed
    1. Salvati A, et al. Transferrin-functionalized nanoparticles lose their targeting capabilities when a biomolecule corona adsorbs on the surface. Nat. Nanotechnol. 2013;8:137–143. doi: 10.1038/nnano.2012.237. - DOI - PubMed

Publication types

MeSH terms