. 2019 Aug 23;10(1):3813.
doi: 10.1038/s41467-019-11798-2.

Systemic acquired resistance networks amplify airborne defense cues

Affiliations

Systemic acquired resistance networks amplify airborne defense cues

Marion Wenig et al. Nat Commun. .

Abstract

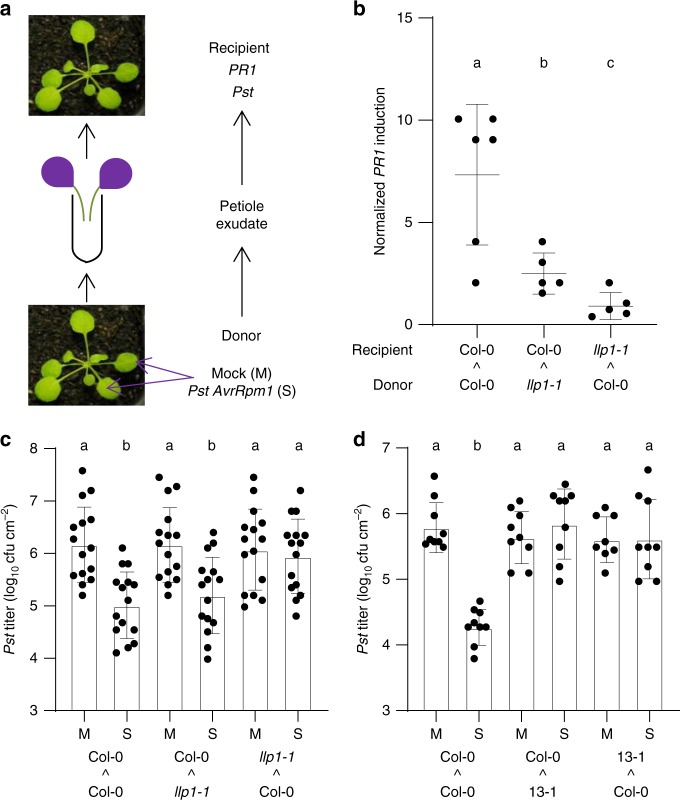
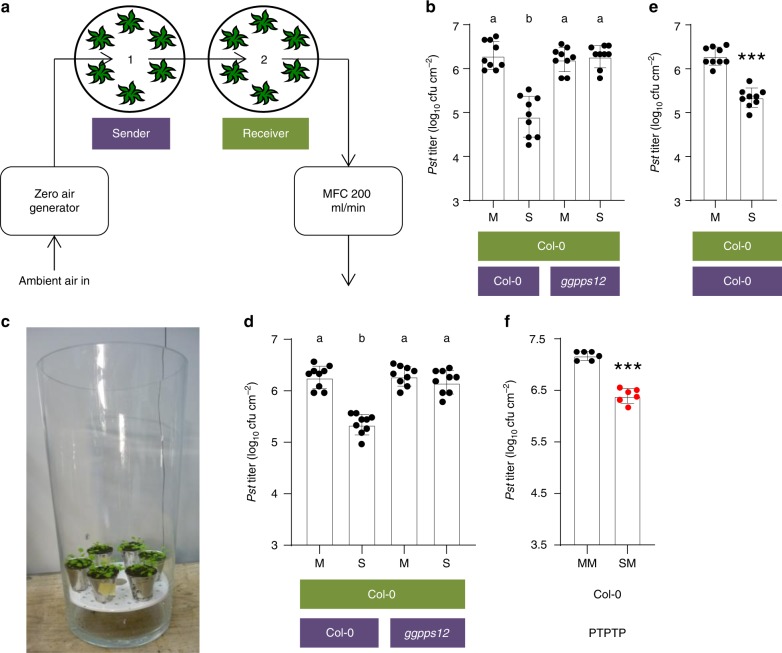
Salicylic acid (SA)-mediated innate immune responses are activated in plants perceiving volatile monoterpenes. Here, we show that monoterpene-associated responses are propagated in feed-forward loops involving the systemic acquired resistance (SAR) signaling components pipecolic acid, glycerol-3-phosphate, and LEGUME LECTIN-LIKE PROTEIN1 (LLP1). In this cascade, LLP1 forms a key regulatory unit in both within-plant and between-plant propagation of immunity. The data integrate molecular components of SAR into systemic signaling networks that are separate from conventional, SA-associated innate immune mechanisms. These networks are central to plant-to-plant propagation of immunity, potentially raising SAR to the population level. In this process, monoterpenes act as microbe-inducible plant volatiles, which as part of plant-derived volatile blends have the potential to promote the generation of a wave of innate immune signaling within canopies or plant stands. Hence, plant-to-plant propagation of SAR holds significant potential to fortify future durable crop protection strategies following a single volatile trigger.


Conflict of interest statement

The authors declare no competing interests.

Figures

Fig. 1
Fig. 1
Legume lectin-like protein 1 (LLP1) is necessary for the recognition of or downstream responses to vascular systemic acquired resistance (SAR) signals. a Setup of a petiole exudate experiment. Leaves of donor plants were inoculated with Pseudomonas syringae pathovar tomato (Pst) carrying the effector locus AvrRpm1 (SAR-induced; S) or mock-treated (M). Twenty-four hours later, their petiole exudates were collected and infiltrated into the leaves of naive recipient plants. b Pathogenesis-Related 1 (PR1) transcript accumulation in recipients of petiole exudates from SAR-induced donor plants normalized to that in recipients of petiole exudates from mock-treated donor plants. Donor and recipient genotypes are indicated below the panel. Dots represent data from five to six biologically independent experiments; lines indicate average ± standard deviation. Grubb’s outlier test identified statistically significant outliers in the data sets llp1-1-to-Col-0 and Col-0-to-llp1-1; these outliers were excluded from further analyses to assure normal distribution of the remaining data and are highlighted in gray in the source data file associated with this paper. c, d In planta Pst titers at 4 days post-inoculation (dpi) of the leaves of the recipient plants. The treatments of the donor plants are indicated below the bars. The donor and recipient genotypes are indicated below the panels; 13-1 refers to RNAi:LLP1-3 line 13-1 (Supplementary Fig. 1A). Dots indicate individual results from three (d) to five (c) biologically independent experiments, including three replicates each. Bars represent the average of the indicated results ± standard deviation. Results with a second independent RNAi:LLP1-3 line are presented in Supplementary Fig. 1B. bd Different letters above bars indicate significant differences, one-way ANOVA, P < 0.05
Fig. 2
Fig. 2
LLP1, glycerol-3-phosphate (G3P), and volatile monoterpenes act downstream of pipecolic acid (Pip) in Pip-induced resistance. a Setup of a Pip irrigation experiment. Plants were irrigated near the roots with Pip (or H2O as the mock (M) control) and subsequently inoculated in the leaves with Pst. b, c In planta Pst titers at 4 dpi of Pip- or mock-treated plants. The plant genotypes are indicated below the panels and include gly1-3 with compromised G3P accumulation and ggpps12 with compromised monoterpene biosynthesis. Dots indicate individual results from three biologically independent experiments per genotype and treatment (including three replicates each). Bars represent the average of the indicated results ± standard deviation. Different letters above bars indicate significant differences, one-way ANOVA, P < 0.05
Fig. 3
Fig. 3
LLP1 and Pip act downstream of volatile monoterpenes in pinene-induced resistance. a Setup of a pinene fumigation experiment. Plants were exposed to a mixture of α- and β-pinene (molar ratio 1:1; Pin) in air-tight glass containers or to the solvent hexane as the mock (M) control treatment. The plants were subsequently released from the containers and inoculated in the leaves with Pst. b In planta Pst titers at 4 dpi of pinene (Pin)- or mock (M)-treated plants. The plant genotypes are indicated below the panel and include ald1 with compromised Pip accumulation. Dots indicate individual results from three to four biologically independent experiments per genotype and treatment (including three replicates each). Bars represent the average of the indicated results ± standard deviation. Different letters above bars indicate significant differences, one-way ANOVA, P < 0.05
Fig. 4
Fig. 4
SAR-induced emissions of the volatile monoterpenes α- and β-pinene depend on LLP1, G3P, and Pip. Emission rates of α-pinene a and β-pinene b from the plant genotypes indicated below the panels 1 day before (T0) and during the first (T1), second (T2), and third (T3) day after spray inoculation of the plants with Pst/AvrRpm1 or the corresponding mock treatment. Dots indicate individual, biologically independent results (n = 3–8); bars represent the average of the indicated results ± standard deviation. Asterisks indicate significant differences from the respective Col-0 mock control. Genotype main effect: Col-0***, azi1-2*** (α-pinene); Col-0***, azi1-2*** (β-pinene). Two-way ANOVA, multiple comparison versus control groups, Holm-Sidak method; *P < 0.05, **P < 0.01, ***P < 0.001. ND: not detectable indicates that the average emission rates remained below background levels. Individual data that were below background levels are not indicated in the bars, but were included in statistical analyses of the data and in the source data file associated with this paper. Grubb’s outlier test identified statistically significant outliers in the data sets Col-0 Pst AvrRpm1 T1 and T2; these outliers were excluded from further analyses and are highlighted in gray in the source data file
Fig. 5
Fig. 5
Plant-to-plant (PTP) propagation of innate immunity depends on LLP1, G3P, Pip, and TERPENE SYNTHASE 24 (TPS24). a PTP experimental setup. Senders were either inoculated with Pst/AvrRpm1 (SAR-induced; S) or mock-treated (M), and incubated with naive receivers in gas-tight containers. The receiver plants were subsequently released from the containers and inoculated with Pst. bj In planta Pst titers at 4 dpi of the receiver plants. The plant genotypes are indicated below the panels (senders in purple and receivers in green) and include bsmt1 with reduced MeSA emissions and tps24 with compromised monoterpene emissions. The treatments of the senders (M or S) are indicated below the bars. Dots indicate individual results from two (b, h; bsmt1 in i, j), three (c, f, i remaining genotypes), or more (d, e, g) biologically independent experiments, including three replicates each. Bars represent the average of the indicated results ± standard deviation. Different letters above bars indicate significant differences, one-way ANOVA, P < 0.05
Fig. 6
Fig. 6
PTP innate immune cues are propagated in the absence of infection and depend on monoterpene emissions and the SAR signaling network. a Plant-to-plant-to-plant (PTPTP) experimental setup. Col-0 senders (sender 1) were SAR-induced (S) or mock-treated (M) and incubated with receiver 1 plants. These plants were either not further treated (–), mock-treated (M) or SAR-induced (S) and incubated as secondary senders (sender 2) with Col-0 wild-type secondary receivers (receiver 2). b, c In planta Pst titers at 4 dpi of receiver 2 plants. Sender 1 and receiver 2 were Col-0 wild type in all experiments; the genotypes of the receiver 1/sender 2 plants are indicated in green below the panels. Capital letters below the bars indicate the consecutive treatments of sender 1 and sender 2. Dots indicate individual results from two (S/– in (b) and llp1-1 in (c)) to three or more biologically independent experiments, including three replicates each. Bars represent the average of the indicated results ± standard deviation. Different letters above bars indicate significant differences, one-way ANOVA, P < 0.05
Fig. 7
Fig. 7
Pip and G3P cooperate to promote SAR and PTP cues. a Experimental setup of (bd). Senders were exposed to Pin, treated with Pip and/or G3P, or exposed to the appropriate mock controls, and incubated with naive receivers in gas-tight containers. The receivers were subsequently released from the containers and inoculated with Pst. b, c In planta Pst titers at 4 dpi of the receivers. The plant genotypes are indicated below the panels (senders in purple and receivers in green) and the treatments of the senders are indicated below the bars. d Chemical complementation of the PTP-signaling defect of the ald1 mutant with Pip and G3P. ald1 senders were irrigated with Pip or the corresponding H2O control and subsequently syringe-infiltrated in the leaves with G3P or the corresponding mock control as indicated below the panel. The treated plants were incubated with Col-0 wt receivers in gas-tight containers. The receiver plants were subsequently released from the containers and inoculated with Pst. The resulting in planta Pst titers at 4 dpi are shown. e Chemical complementation of the SAR-deficient phenotype of the gly1-3 mutant with Pip and G3P. gly1-3 mutant plants were irrigated with Pip or the corresponding H2O control and subsequently syringe-infiltrated in the first two true leaves with G3P or the corresponding mock control as indicated below the panel. Leaves systemic to the site of G3P application were inoculated with Pst, and the resulting in planta Pst titers at 4 dpi are shown. be Dots indicate individual results from two (b, c, e) to three (d) biologically independent experiments, including three replicates each. Bars represent the average of the indicated results ± standard deviation. b Asterisks above bar indicate a significant difference from the mock control (t test, P < 0.001). ce Different letters above bars indicate significant differences, one-way ANOVA, P < 0.05
Fig. 8
Fig. 8
PTP propagation of innate immunity in open systems. a Experimental setup of PTP experiments under dynamic/flow-through conditions. Sender and receiver plants were incubated in separate, but via 1/8″ tubes connected vacuum desiccators. VOC-free air was derived from ambient air by a zero-air generator and pulled through the system at a flow rate of 200 mL min−1. (be) PTP experiments in the dynamic system (b), open glass vases (c, d), and open desiccators (e). Receivers were exposed to the emissions of Pst/AvrRpm1-infected (SAR-induced; S) or mock-treated (M) sender plants in the different experimental setups (e.g., a, c). The plant genotypes are indicated below the panels (senders in purple and receivers in green); the treatment of the senders is indicated below the bars. After 3 days, receivers were inoculated with Pst, and the resulting in planta Pst titers at 4 dpi are shown. Dots indicate individual results from three biologically independent experiments, including three replicates each. Bars represent the average of the indicated results ± standard deviation. Different letters above bars indicate significant differences, one-way ANOVA, P < 0.05. f PTPTP experiment in Col-0 wt plants. Data summarize Pst titers in receiver 2 plants. Receiver 1 had been exposed to SAR-induced (S) or mock-treated (M) sender 1 plants in the flow-through system from (a) for 3 days. Subsequently, receiver 2 was exposed to mock-treated receiver 1 plants in the same setup. After another 3 days, receiver 2 plants were inoculated with Pst, and the resulting in planta Pst titers at 4 dpi are shown. Dots indicate individual results from two biologically independent experiments, including three replicates each. Bars represent the average of the indicated results ± standard deviation. Asterisks above bar indicate a significant difference from the mock control (t test, P < 0.001). MFC, mass flow controller
Fig. 9
Fig. 9
Working model of systemic and plant-to-plant propagation of innate immunity. A Systemic acquired resistance (SAR)-inducing infection triggers pipecolic acid (Pip) and glycerol-3-phosphate (G3P) accumulation, which stimulate each other in a positive feedback loop acting upstream of monoterpene emissions. Monoterpenes subsequently enhance salicylic acid (SA)-associated immunity through the SAR signaling intermediates LEGUME LECTIN-LIKE PROTEIN1 (LLP1) and AZELAIC ACID INDUCED1 (AZI1). At the same time, monoterpenes are emitted and act as cues that are perceived by systemic leaves and also neighboring plants. At the site of monoterpene perception, SA-associated immunity is enhanced through LLP1 and AZI1. In addition, LLP1 drives a positive feedback loop with Pip and G3P to stimulate monoterpene biosynthesis and emission, potentially promoting the generation of a wave of plant-derived volatile defense cues moving between leaves in a canopy or rosette and between neighboring plants in a population

References

    1. Vlot AC, Dempsey DA, Klessig DF. Salicylic acid, a multifaceted hormone to combat disease. Annu Rev. Phytopathol. 2009;47:177–206. doi: 10.1146/annurev.phyto.050908.135202. - DOI - PubMed
    1. Jones JD, Dangl JL. The plant immune system. Nature. 2006;444:323–329. doi: 10.1038/nature05286. - DOI - PubMed
    1. Spoel SH, Dong X. How do plants achieve immunity? Defence without specialized immune cells. Nat. Rev. Immunol. 2012;12:89–100. doi: 10.1038/nri3141. - DOI - PubMed
    1. Park SW, Kaimoyo E, Kumar D, Mosher S, Klessig DF. Methyl salicylate is a critical mobile signal for plant systemic acquired resistance. Science. 2007;318:113–116. doi: 10.1126/science.1147113. - DOI - PubMed
    1. Ament K, et al. Methyl salicylate production in tomato affects biotic interactions. Plant J. 2010;62:124–134. doi: 10.1111/j.1365-313X.2010.04132.x. - DOI - PubMed

Publication types

MeSH terms