. 2019 Aug 23;9(1):12298.
doi: 10.1038/s41598-019-48639-7.

Comparative linkage mapping of diploid, tetraploid, and hexaploid Avena species suggests extensive chromosome rearrangement in ancestral diploids

Affiliations

Comparative linkage mapping of diploid, tetraploid, and hexaploid Avena species suggests extensive chromosome rearrangement in ancestral diploids

Robert G Latta et al. Sci Rep. .

Abstract

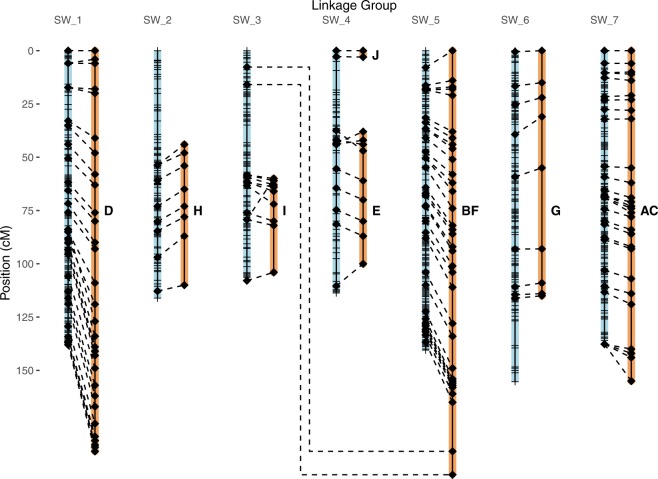
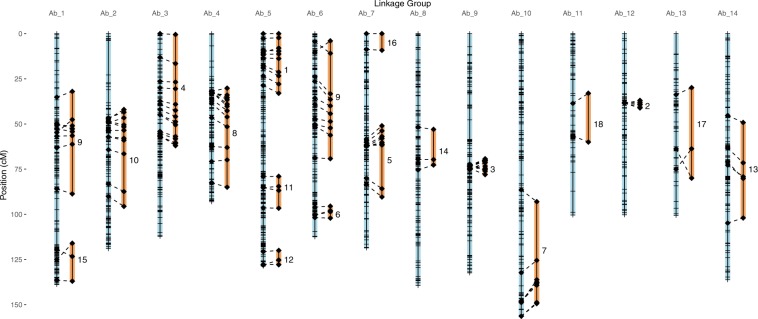
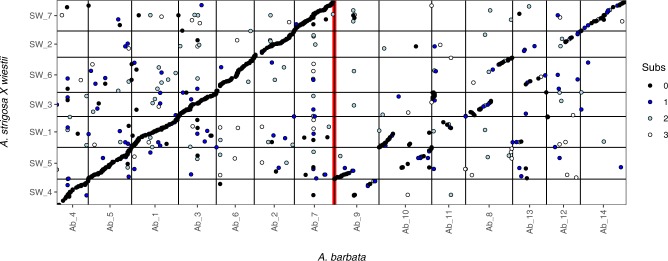
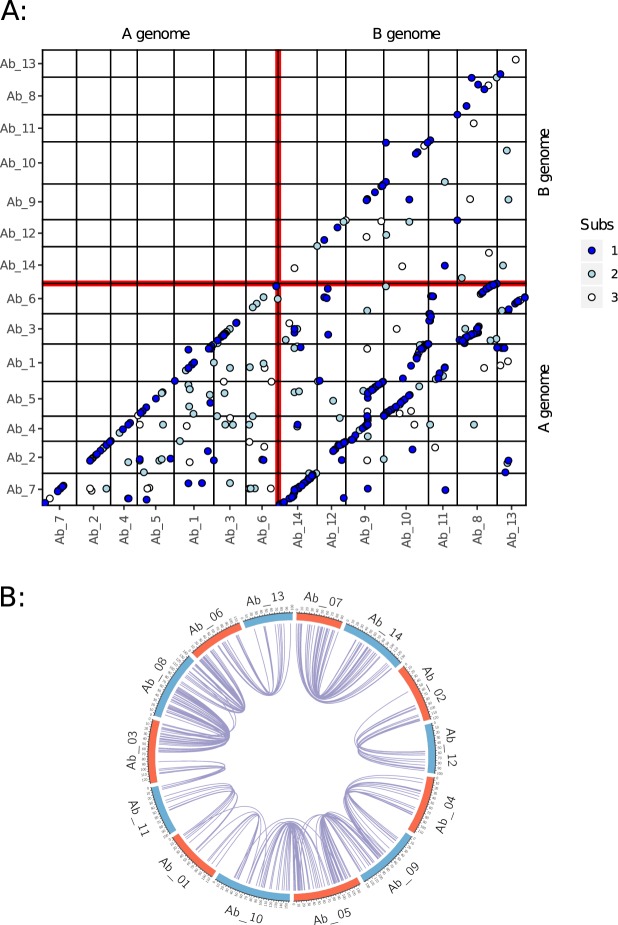
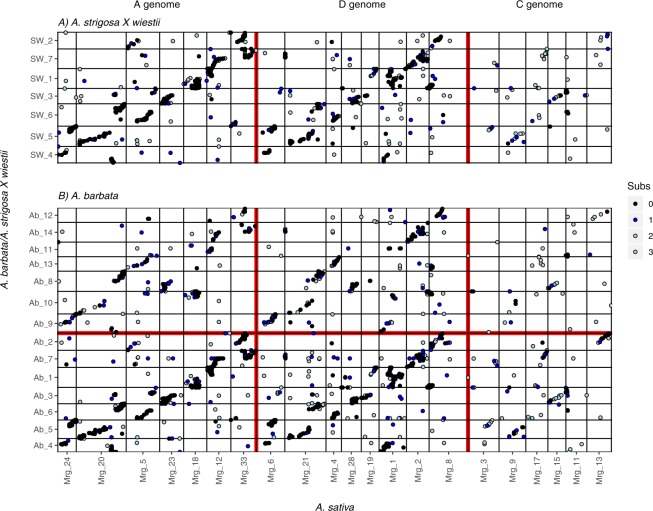
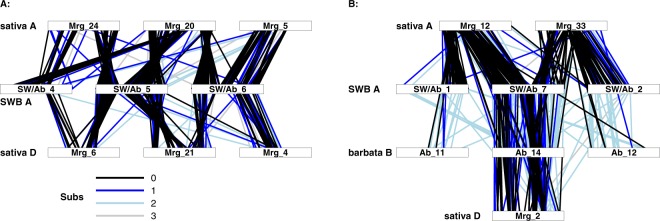
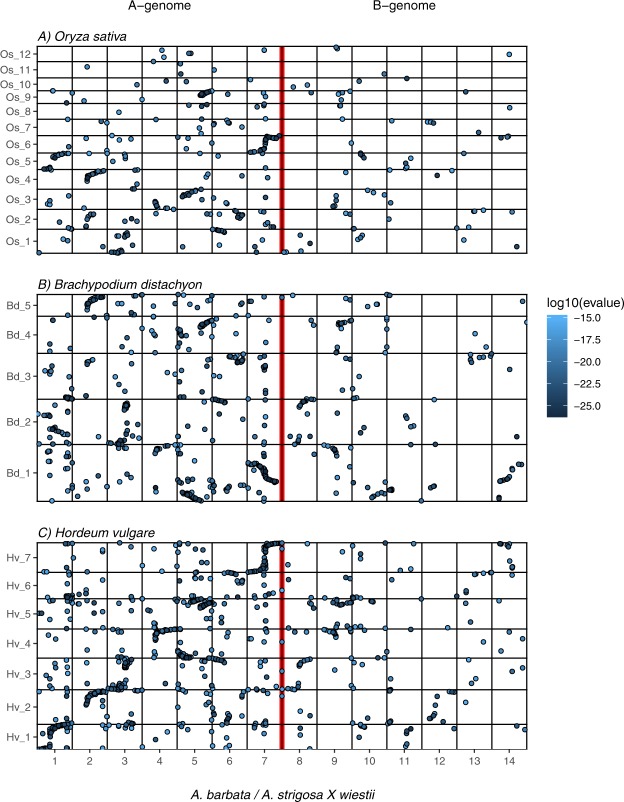
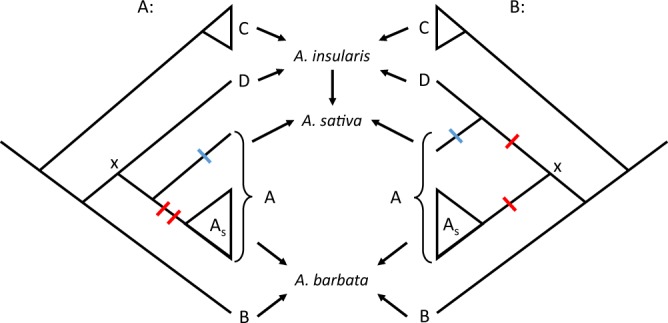
The genus Avena (oats) contains diploid, tetraploid and hexaploid species that evolved through hybridization and polyploidization. Four genome types (named A through D) are generally recognized. We used GBS markers to construct linkage maps of A genome diploid (Avena strigosa x A. wiestii, 2n = 14), and AB genome tetraploid (A. barbata 2n = 28) oats. These maps greatly improve coverage from older marker systems. Seven linkage groups in the tetraploid showed much stronger homology and synteny with the A genome diploids than did the other seven, implying an allopolyploid hybrid origin of A. barbata from distinct A and B genome diploid ancestors. Inferred homeologies within A. barbata revealed that the A and B genomes are differentiated by several translocations between chromosomes within each subgenome. However, no translocation exchanges were observed between A and B genomes. Comparison to a consensus map of ACD hexaploid A. sativa (2n = 42) revealed that the A and D genomes of A. sativa show parallel rearrangements when compared to the A genomes of the diploids and tetraploids. While intergenomic translocations are well known in polyploid Avena, our results are most parsimoniously explained if translocations also occurred in the A, B and D genome diploid ancestors of polyploid Avena.


Conflict of interest statement

The authors declare no competing interests.

Figures

Figure 1
Figure 1
GBS linkage map of diploid A. strigosa (C.I. 3815) x A. wiestii (C.I. 1994) RIL population (blue, left), aligned to the RFLP map (orange, right) of Portyanko et al. from the same population. Linkage distances shown here were calculated after removal of likely GBS genotyping errors. Diamonds represent positions of common RFLP markers, while hatches indicated bins of other GBS markers.
Figure 2
Figure 2
GBS linkage map (blue, left) of tetraploid A. barbata mapping population aligned to the AFLP map (orange, right) of Gardner and Latta. Note that several linkage groups of the fragmentary AFLP map align to the same GBS chromosome. This map is derived from the double restriction digest (PstI-MspI) GbS library, with linkage distances calculated after removal of likely GBS genotyping errors. Diamonds represent position of AFLP markers, while hatches indicated bins of other GBS markers.
Figure 3
Figure 3
Dot-plot showing alignment of linkage groups between diploid A. strigosa (C.I. 3815) × A. wiestii (C.I. 1994) RIL population and tetraploid A. barbata linkage maps. Dots are coloured to indicate the number of base substitutions (black = perfect match; blue, grey, and white represent 1, 2, or 3 mismatches, respectively) between matching Tag sequences. Linkage groups have been re-ordered to emphasize the pattern.
Figure 4
Figure 4
Paralogs and homeologs within the A. barbata genome. (A) Dot-plot of all paralogous loci detected with GBS. Linkage groups have been re-ordered to emphasize the pattern, and colour represents the number of base pair substitutions between the tag sequences of paralogous loci (blue, grey, and white represent 1, 2, or 3 mismatches, respectively). (B) Circos plot highlighting the pattern among linkage groups having more paralogous markers than expected by chance. A and B genome assignments from Fig. 3 are coloured red and blue respectively. Paralogous loci are joined by blue curved lines.
Figure 5
Figure 5
Dot-plots showing alignment of the consensus linkage map from A. sativa, with the diploid A. strigosa × A. wiesteii map and with the tetraploid A. barbata map. Linkage groups have been re-ordered to emphasize the pattern, and colour represents the number of base pair substitutions between the tag sequences of homologous loci (black = perfect match; blue, grey, and white represent 1, 2, or 3 mismatches, respectively). Genome assignments of linkage groups in A. sativa following Yan et al. are shown across the top, with linkage group assignments at the bottom. Groups Mrg18 and Mrg19 are shown as A and D genomes, respectively, although they contain large translocations from the hexaploid C genome.
Figure 6
Figure 6
Example alignments of linkage groups from A. strigosa, A. wiestii and A. barbata against the A and D genomes of A. sativa. (A) alignment of LGs 4, 5, and 6 from the A. sativa × A. wiestei and A. barbata maps (labelled “SWB”) against the corresponding A and D genome LGs of A. sativa. Note that Mrg24 and Mrg6 are homeologs as are Mrg20 and Mrg21 as well as Mrg4 and Mrg5. (B) alignment of LG7 (A genome of SW and A. barbata), LG 14 (B genome of A. barbata), and Mrg2 (D genome of A. sativa) with Mrg12 and 33 both of the A genome of A. sativa. Linkage groups have been standardized to unit length, and line colour indicates the number of base pair differences between homologous tag sequences.
Figure 7
Figure 7
Dot-plot comparison of the Avena barbata and A. strigosa × A. wiestii (SW) linkage maps with the rice (top), Brachypodium (middle) and barley (bottom) genomes. LG’s 1–7 include markers from both A. barbata and SW with blast hits in the target genomes. X axis in recombination units (cM) with linkage groups standardized to unit length. Y axis in base pairs. Blast hits were filtered to max e-value of 10−15, and tags matching more than 10 locations in the target genomes were removed.
Figure 8
Figure 8
Two hypothetical relationships among the diploid ancestors of polyploid oats prior to the hybridization and polyploidization events (arrows) creating A. barbata, A. insularis and A. sativa. Left: The A genome diploid ancestor of A. sativa is more closely related to As diploids including A. strigosa and A. wiestii. Under this view, the ancestor at the node labelled “x” likely exhibited the genome arrangement seen in Mrg4/5, Mrg20/21, Mrg6/24, and a series of translocations (red hatches) in the common ancestor of As diploids led to the arrangement in SW_4–6 (Fig. 6a). Right: The A and D genome diploid ancestors of A. sativa are each other’s closest relatives. If this hypothesis is correct, then the contrasting arrangements in Mrg4/5, Mrg20/21, Mrg6/24 and SW_4–6 represent the accumulation of translocations (red hatches) as each lineage diverged from ancestor x. In either case, the unique arrangement of Mrg12 and Mrg33 in the A genome of A. sativa occurred (blue hatch) after that diploid ancestor diverged from the D genome ancestor.

References

    1. Wendel, J. F. Genome evolution in polyploids. Plant Mol. Biol.42, 225–249 (2000). 10.1023/A:1006392424384 - DOI - PubMed
    1. Adams, K. & Wendel, J. Polyploidy and genome evolution in plants. Curr. Opin. Plant Biol.8, 135–141 (2005). 10.1016/j.pbi.2005.01.001 - DOI - PubMed
    1. Soltis, D. E., Visger, C. J., Marchant, D. B. & Soltis, P. S. Polyploidy: Pitfalls and paths to a paradigm. Am. J. Bot.103, 1146–1166 (2016). 10.3732/ajb.1500501 - DOI - PubMed
    1. Gaeta, R. T. & Pires, J. C. Homoeologous recombination in allopolyploids: the polyploid ratchet. New Phytol.186, 18–28 (2010). 10.1111/j.1469-8137.2009.03089.x - DOI - PubMed
    1. Wendel, J. F., Jackson, S. A., Meyers, B. C. & Wing, R. A. Evolution of plant genome architecture. Genome Biol.17, 37, 10.1186/s13059-016-0908-1 (2016). 10.1186/s13059-016-0908-1 - DOI - PMC - PubMed

Publication types