. 2019 Dec;176(24):4731-4744.
doi: 10.1111/bph.14841. Epub 2019 Dec 26.

Considerations for improved performance of competition association assays analysed with the Motulsky-Mahan's "kinetics of competitive binding" model

Affiliations

Considerations for improved performance of competition association assays analysed with the Motulsky-Mahan's "kinetics of competitive binding" model

Victoria Georgi et al. Br J Pharmacol. 2019 Dec.

Abstract

Background and purpose: Target engagement dynamics can influence drugs' pharmacological effects. Kinetic parameters for drug:target interactions are often quantified by evaluating competition association experiments-measuring simultaneous protein binding of labelled tracers and unlabelled test compounds over time-with Motulsky-Mahan's "kinetics of competitive binding" model. Despite recent technical improvements, the current assay formats impose practical limitations to this approach. This study aims at the characterisation, understanding and prevention of these experimental constraints, and associated analytical challenges.

Experimental approach: Monte Carlo simulations were used to run virtual kinetic and equilibrium tracer binding and competition experiments in both normal and perturbed assay conditions. Data were fitted to standard equations derived from the mass action law (including Motulsky-Mahan's) and to extended versions aiming to cope with frequently observed deviations of the canonical traces. Results were compared to assess the precision and accuracy of these models and identify experimental factors influencing their performance.

Key results: Key factors influencing the precision and accuracy of the Motulsky-Mahan model are the interplay between compound dissociation rates, measurement time and interval frequency, tracer concentration and binding kinetics and the relative abundance of equilibrium complexes in vehicle controls. Experimental results produced recommendations for better design of tracer characterisation experiments and new strategies to deal with systematic signal decay.

Conclusions and implications: Our data advances our comprehension of the Motulsky-Mahan kinetics of competitive binding models and provides experimental design recommendations, data analysis tools, and general guidelines for its practical application to in vitro pharmacology and drug screening.


Conflict of interest statement

S.S. is employed by Genedata AG, Switzerland.

Figures
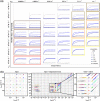
Figure 1
Figure 1
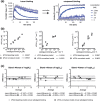
In silico evaluation of the Motulsky–Mahan model performance fitting a range of rate constants measured with the same experimental conditions. (a) Representative graphs of simulated competitive tracer‐compound association traces for 35 virtual compounds with different on‐ and off‐rates. The simulation considered an observation time of 400 s, a measuring interval of 10 s, and 12.5‐nM tracer with a kon = 2.56 × 106 M−1 s−1 and a koff = 1.67 × 10−3 s−1. The corresponding fit curves derived from the “kinetics of competitive binding” equation are indicated as solid lines. (b) Monte Carlo simulations and analyses shown in Panel (a) were performed 100 times for each compound. The rate plots represent the input binding kinetic parameters (left panel, and large symbols in all plots) for the 35 compounds (one colour per compound) as used for the simulation along with the corresponding output rates (small symbols in middle and right graphs) calculated by using the Motulsky–Mahan model. The diagonals in the plots correspond to the isoaffinity lines. The right panel zooms into the range of the input parameters, which span a physiologically meaningful range of the binding parameters. In contrast, the middle panel allows visualisation of all generated output parameters
Figure 2
Figure 2
Effect of observation time on Motulsky–Mahan model fitting precision and accuracy. (a) Representative graphs of simulated competitive tracer‐compound association traces for a fast‐ (10−1 s−1) and a slow‐dissociating (10−4 s−1) compound, both with an association rate of 106 M−1 s−1. The simulation assumed a measuring interval of 10 s and 12.5‐nM tracer with a kon = 2.56 × 106 M−1 s−1 and a koff = 1.67 × 10−3 s−1. The vertical lines indicate the different total observation times used for the simulations. The corresponding fit curves derived from the “kinetics of competitive binding” equation are indicated as solid lines. (b) Monte Carlo simulations and analyses as shown in Panel (a) were performed 100 times per compound and per observation time. The graphs represent the input binding kinetic parameters (horizontal dotted line) along with the output parameters (grey dots) calculated by global fitting of the Motulsky–Mahan model to the simulated binding traces. Not all output parameters are inside the y‐axis limits. The solid black lines represent the mean values of all output parameters of a Monte Carlo experiment
Figure 3
Figure 3
Effect of measuring interval on Motulsky–Mahan model fitting precision and accuracy. (a) Representative graphs of simulated competitive tracer‐compound association traces for a fast‐ (10−1 s−1) and a slow‐dissociating (10−4 s−1) compound, both with an association rate of 106 M−1 s−1. All simulations assumed an observation time of 400 s and 12.5‐nM tracer with a kon = 2.56 × 106 M−1 s−1 and a koff = 1.67 × 10−3 s−1. The vertical lines indicate the different measuring intervals used for the simulations. The corresponding fit curves derived from the “kinetics of competitive binding” equation are indicated as solid lines. (b) Monte Carlo simulations and analyses as shown in Panel (a) were performed 100 times per compound and per measuring interval. The graphs represent the input binding kinetic parameters (horizontal dotted line) along with the output parameters (grey dots) calculated by using the Motulsky–Mahan model. Not all output parameters are inside the y‐axis limits. The solid black lines represent the mean values of all output parameters of a Monte Carlo experiment
Figure 4
Figure 4
Effect of tracer binding kinetics and concentration on Motulsky–Mahan model fitting precision and accuracy. (a) Representative graphs of simulated competitive tracer‐compound association traces for a fast‐ (10−1 s−1) and a slow‐dissociating (10−4 s−1) compound, both with an association rate of 106 M−1 s−1. All simulations considered an observation time of 400 s and a measuring interval of 10 s. The purple traces were simulated assuming 12.5‐nM tracer with a kon = 2.56 × 106 M−1 s−1 and a koff = 1.67 × 10−3 s−1. The red traces considered a 10‐fold faster tracer off‐rate, while the sepia curves assumed either a 10‐fold higher tracer concentration or a 10‐fold faster on‐rate (resulting in the same traces). The corresponding fit curves derived from the “kinetics of competitive binding” equation are indicated as solid lines. (b) Monte Carlo simulations and analyses as shown in Panel (a) were performed 100 times per compound and per tracer condition. The graphs represent the input binding kinetic parameters (horizontal dotted line) along with the output parameters (grey dots) calculated by global fitting of the Motulsky–Mahan model to the simulated binding traces. Not all output parameters are inside the y‐axis limits. The solid black lines represent the mean values of all output parameters of a Monte Carlo experiment
Figure 5
Figure 5
Comparison of two experimental approaches for tracer characterisation. (a) Representative graphs of simulated tracer association traces as well as tracer association‐then‐dissociation traces for tracers with an association rate of 106 M−1 s−1 and with different dissociation rates (0.1 vs. 0.001 vs. 0.00001 s−1). The solid lines represent the corresponding fit curves. (b) Monte Carlo simulations and analyses similarly or identical to those shown in (a) were performed 100 times respectively. The graphs represent the input binding kinetic parameters (horizontal and diagonal dashed lines) along with the output parameters (grey dots) calculated by using either the “association kinetics” or the “association‐then‐dissociation” model. Not all output parameters are inside the y‐axis limits
Figure 6
Figure 6
Comparison of two kinetics of competitive binding models dealing with systematic signal decay. (a) The left graph shows an example of a competitive tracer‐compound binding trace with systematic signal decay (from kPCA experiment, Bosma et al., 2019) and the corresponding fit (solid line) derived from the Motulsky–Mahan model equation multiplied with a signal drift term where K Drift = 0.0028 ± 0.0004. The signal is also decaying in the control well without compound. The right graph shows the associated normalised traces: The percentage of binding was calculated by normalisation between the tracer binding control (0% compound binding) and the background signal (100% compound binding). The corresponding fit (solid line) was calculated by using the normalised Motulsky–Mahan equation. (b–c) For nine compounds, the resulting binding parameters from both fits were compared to those obtained from radioligand binding experiments (Bosma et al., 2019) represents the correlation plots. Spearman correlation coefficients are indicated below the graphs. Panel (c) shows Bland–Altman plots. The solid horizontal lines indicate the mean log difference for all data points—which is also given as mean ± SD below the graphs. The dashed lines represent the upper and lower 95% limit of agreement

References

    1. Alexander, S. P. H. , Kelly, E. , Marrion, N. V. , Peters, J. A. , Faccenda, E. , Harding, S. D. , … CGTP Collaborators (2017). The concise guide to Pharmacology 2017/18: Overview. British Journal of Pharmacology, 174(Suppl 1), S1–S16. 10.1111/bph.13882 - DOI - PMC - PubMed
    1. Antoine, T. , Ott, D. , Ebell, K. , Hansen, K. , Henry, L. , Becker, F. , & Hannus, S. (2016). Homogeneous time‐resolved G protein‐coupled receptor‐ligand binding assay based on fluorescence cross‐correlation spectroscopy. Analytical Biochemistry, 502, 24–35. 10.1016/j.ab.2016.02.017 - DOI - PubMed
    1. Aranyi, P. (1980). Kinetics of the hormone‐receptor interaction. Competition experiments with slowly equilibrating ligands. Biochimica et Biophysica Acta, 628, 220–227. 10.1016/0304-4165(80)90369-4 - DOI - PubMed
    1. Bland, J. M. , & Altman, D. G. (1986). Statistical methods for assessing agreement between two methods of clinical measurement. Lancet, 1, 307–310. - PubMed
    1. Bland, J. M. , & Altman, D. G. (1990). A note on the use of the intraclass correlation coefficient in the evaluation of agreement between two methods of measurement. Computers in Biology and Medicine, 20, 337–340. 10.1016/0010-4825(90)90013-F - DOI - PubMed

Publication types