Clinical Trial
. 2019 Dec;144(6):1660-1673.
doi: 10.1016/j.jaci.2019.08.007. Epub 2019 Aug 22.

Common variable immunodeficiency-associated endotoxemia promotes early commitment to the T follicular lineage

Affiliations
Clinical Trial

Common variable immunodeficiency-associated endotoxemia promotes early commitment to the T follicular lineage

Carole Le Coz et al. J Allergy Clin Immunol. 2019 Dec.

Abstract

Background: Although chiefly a B-lymphocyte disorder, several research groups have identified common variable immunodeficiency (CVID) subjects with numeric and/or functional TH cell alterations. The causes, interrelationships, and consequences of CVID-associated CD4+ T-cell derangements to hypogammaglobulinemia, autoantibody production, or both remain unclear.

Objective: We sought to determine how circulating CD4+ T cells are altered in CVID subjects with autoimmune cytopenias (AICs; CVID+AIC) and the causes of these derangements.

Methods: Using hypothesis-generating, high-dimensional single-cell analyses, we created comprehensive phenotypic maps of circulating CD4+ T cells. Differences between subject groups were confirmed in a large and genetically diverse cohort of CVID subjects (n = 69) by using flow cytometry, transcriptional profiling, multiplex cytokine/chemokine detection, and a suite of in vitro functional assays measuring naive T-cell differentiation, B-cell/T-cell cocultures, and regulatory T-cell suppression.

Results: Although CD4+ TH cell profiles from healthy donors and CVID subjects without AICs were virtually indistinguishable, T cells from CVID+AIC subjects exhibited follicular features as early as thymic egress. Follicular skewing correlated with IgA deficiency-associated endotoxemia and endotoxin-induced expression of activin A and inducible T-cell costimulator ligand. The resulting enlarged circulating follicular helper T-cell population from CVID+AIC subjects provided efficient help to receptive healthy donor B cells but not unresponsive CVID B cells. Despite this, circulating follicular helper T cells from CVID+AIC subjects exhibited aberrant transcriptional profiles and altered chemokine/cytokine receptor expression patterns that interfered with regulatory T-cell suppression assays and were associated with autoantibody production.

Conclusions: Endotoxemia is associated with early commitment to the follicular T-cell lineage in IgA-deficient CVID subjects, particularly those with AICs.

Keywords: Common variable immunodeficiency; activin A; autoimmune cytopenias; endotoxin; follicular helper T cell; recent thymic emigrant; regulatory T cell; time-of-flight cytometry.


Conflict of interest statement

Conflict of Interest Disclosure Statement: E.J.W. is a member of the Parker Institute for Cancer Immunotherapy which supported the UPenn cancer immunotherapy program. E.J.W. has consulting agreements with and/ or is on the scientific advisory board for Merck, Roche, Pieris, Elstar, and Surface Oncology. E.J.W. is a founder of Arsenal Biosciences. E.J.W. has a patent licensing agreement on the PD-1 pathway with Roche/Genentech. The rest of authors declare that they have no relevant conflicts of interest.

Figures

Figure 1.
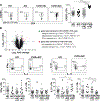
Figure 1.. High-dimensional analyses of CVID+AIC subject circulating CD4+ T cells reveal distinct distribution patterns and pervasive follicular signatures.
(A) 38-dimension mass cytometry analyses of HD (n=3), CVID-AIC subject (n=3) and CVID+AIC subject (n=3) peripheral blood CD4+ T cells are pooled and reduced into 2-dimensional t-SNE plots (left). Between plots cell distribution differences are concentrated into three spatially-distinct populations: P1, P2 and P3 . Density of cells co-expressing surface markers indicative of (B) naive cells (C) Tfh cells and (D) “Tregs” in healthy donors are overlaid on ungated t-SNE plots. Heatmaps compare the frequency of cells from different populations expressing the indicated markers. Compared populations include, (B) naive cells belonging to P1, P2 or a third CD45RA+CD45RO population (P1’) (C) cTfh cells from each subject by group and (D) cells in the “Treg” gate belonging to P3 and not.
Figure 2.
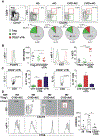
Figure 2.. CVID+AIC CD4+ recent thymic emigrants (RTEs) express activation and follicular markers
(A) The frequencies of RTEs among total CD4+ T cells are displayed for representative subjects (left) and all available subjects . Comparison of (B) CD95 expression intensities and (C) Ki67 (D) CXCR5, and PD1 expression frequencies on CD4+ RTEs from representative (left) and all available HD, AIC, CVID-AIC and CVID+AIC subjects. *P<.05, **P<.01, and ****P<.0001, Mann-Whitney U tests.
Figure 3.
Figure 3.. Endotoxemia promotes T follicular helper cell (Tfh) differentiation.
(A) Day five CXCR5/PD1 coexpression on HD CD45RO naive cells cultured with anti-CD3/CD28 beads, recombinant ICOSL and 20% HD, CVID-AIC, or CVID+AIC plasma with and without polymyxin B (PMB). (B) Day two CCR7, ICOS and CD95 expression and (C) day five CXCR5 and PD1 expression on activated HD CD45RO- cells similarly cultured but in 20% fetal bovine serum spiked with LPS (100ng/ml) or not. (D) Activin A plasma concentrations between groups and against paired cTfh cell frequencies are displayed. *P<.05, **P<.01, ***P<.001, and ****P<.0001, Mann-Whitney U tests or paired student’s t-tests or a Pearson correlation coefficient.
Figure 4.
Figure 4.. CVID+AIC monocytes express increased ICOSL.
(A) Representative dot plot (upper) of classical monocyte (cMo, CD14+CD16), intermediate monocyte (iMo, CD14+CD16+) and non-classical monocyte (ncMo, CD14intCD16+). (B) HD, AIC, CVID-AIC and CVID+AIC iMo frequencies. (C) ICOSL mean fluorescence intensities on monocyte subsets from representative donors (left) and all subjects . **P<.01, ****P<.0001, Mann-Whitney U tests.
Figure 5.
Figure 5.. Most CVID+AIC cTfh cells express CXCR3+ but are functionally distinct from HD CXCR3+ cTfh cells.
(A) The frequencies of cTfh cells expressing CXCR3 are displayed for representative subjects (left) and all available subjects including immunocompetent autoimmune cytopenia subjects. (B) Differentially expressed transcripts between CVID+AIC cTfh and HD CXCR3+ cTfh are displayed in a volcano plot with enriched gene sets listed (C) The frequency of activated cTfh cells staining positive for intracellular cytokines are shown for representative (left) and all available subjects . *P<.05, **P<.01, ***P<.001 and ****P<.0001, Mann-Whitney U tests.
Figure 6.
Figure 6.. CVID cTfh efficiently help receptive B-cells.
(A) Day seven IgG and IgA cell-surface expression frequencies on naive B cells (nB) from representative indicated subjects in homologous or heterologous co-cultures with cTfh cells from indicated subjects (left) and mean frequencies tallied from four separate experiments . (B) Mean immunoglobulin concentrations in supernatants from the described co-cultures are displayed. Error bars indicate mean ± SEM. * P<.05, **P<.01. Mann-Whitney U tests.
Figure 7.
Figure 7.. The CVID+AIC CD25hiCD127lo “Treg gate” is contaminated by a poorly suppressive cTfh-like subset
(A) Peripheral CD4+ cells in the CD25hiCD127lo/- “Treg” gate include conventional Tregs (grey), CXCR5+PD1lo circulating T follicular regulatory cells (Tfr, green) and a third CXCR5+PD1hi population, CD25hi Tfh-like cells (red). (B) FOXP3, Ki67, (C) IL-21 and IL-10 expression and expression frequencies on CVID+AIC and HD T cell subsets (D) Representative histograms (left) of CFSE-labeled HD naive T effector cells (Teff) stimulated (solid line) or not (dashed) in cocultures with indicated CVID+AIC T helper cell subsets. Columns represent mean percent inhibition relative to unstimulated Teff cells. Error bars indicate mean ± SEM. * P<.05, **P<.01, ***P<.001, and ****P<.0001, Mann-Whitney U tests or paired t-tests.

References

    1. Cunningham-Rundles C The many faces of common variable immunodeficiency. Hematology Am Soc Hematol Educ Program 2012; 2012:301–5. - PMC - PubMed
    1. Romberg NNY, Cunningham-Rundles C, Meffre E. Response: common variable immunodeficiency patients with increased CD21−/lo B cells suffer from altered receptor editing and defective central B-cell tolerance. Blood 2011.
    1. Romberg N, Chamberlain N, Saadoun D, Gentile M, Kinnunen T, Ng YS, et al. CVID-associated TACI mutations affect autoreactive B cell selection and activation. J Clin Invest 2013; 123:4283–93. - PMC - PubMed
    1. Simchoni N, Cunningham-Rundles C. TLR7- and TLR9-responsive human B cells share phenotypic and genetic characteristics. J Immunol 2015; 194:3035–44. - PMC - PubMed
    1. Yu JE, Knight AK, Radigan L, Marron TU, Zhang L, Sanchez-Ramon S, et al. Toll-like receptor 7 and 9 defects in common variable immunodeficiency. J Allergy Clin Immunol 2009; 124:349–56, 56.e1–3. - PMC - PubMed

Publication types