. 2019 Nov;21(6):1053-1066.
doi: 10.1016/j.jmoldx.2019.06.011. Epub 2019 Aug 22.

A Novel Next-Generation Sequencing Approach to Detecting Microsatellite Instability and Pan-Tumor Characterization of 1000 Microsatellite Instability-High Cases in 67,000 Patient Samples

Affiliations

A Novel Next-Generation Sequencing Approach to Detecting Microsatellite Instability and Pan-Tumor Characterization of 1000 Microsatellite Instability-High Cases in 67,000 Patient Samples

Sally E Trabucco et al. J Mol Diagn. 2019 Nov.

Abstract

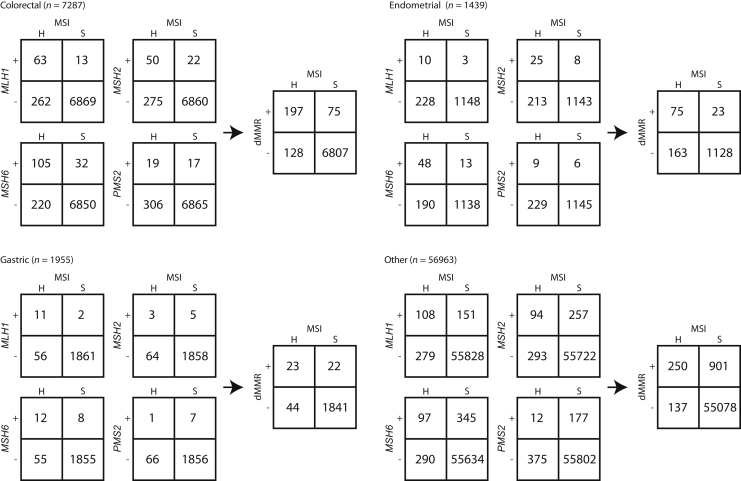
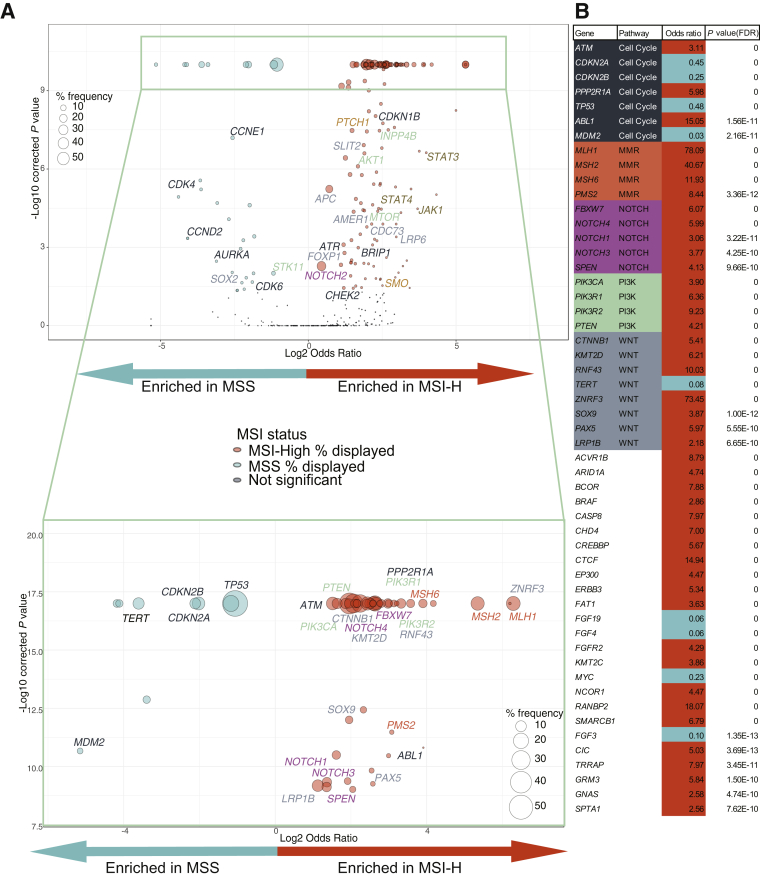
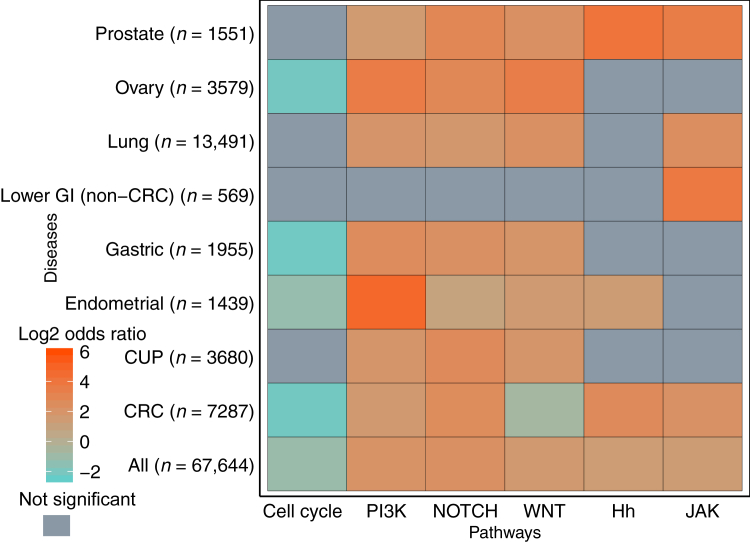
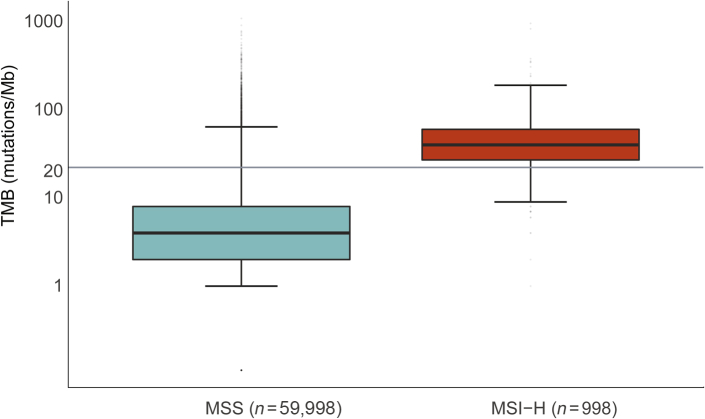
Microsatellite instability (MSI) is an important biomarker for predicting response to immune checkpoint inhibitor therapy, as emphasized by the recent checkpoint inhibitor approval for MSI-high (MSI-H) solid tumors. Herein, we describe and validate a novel method for determining MSI status from a next-generation sequencing comprehensive genomic profiling assay using formalin-fixed, paraffin-embedded samples. This method is 97% (65/67) concordant with current standards, PCR and immunohistochemistry. We further apply this method to >67,000 patient tumor samples to identify genes and pathways that are enriched in MSI-stable or MSI-H tumor groups. Data show that although rare in tumors other than colorectal and endometrial carcinomas, MSI-H samples are present in many tumor types. Furthermore, the large sample set revealed that MSI-H tumors selectively share alterations in genes across multiple common pathways, including WNT, phosphatidylinositol 3-kinase, and NOTCH. Last, MSI is sufficient, but not necessary, for a tumor to have elevated tumor mutation burden. Therefore, MSI can be determined from comprehensive genomic profiling with high accuracy, allowing for efficient MSI-H detection across all tumor types, especially those in which routine use of immunohistochemistry or PCR-based assays would be impractical because of a rare incidence of MSI. MSI-H tumors are enriched in alterations in specific signaling pathways, providing a rationale for investigating directed immune checkpoint inhibitor therapies in combination with pathway-targeted therapies.


Figures

Figure 1
Figure 1
Development of next-generation sequencing (NGS)–based microsatellite instability (MSI) algorithm. Overview of the development of the NGS-based algorithm to determine MSI status. A: Integrative Genomics Viewer screenshot of one representative MSI-stable (MSS) and MSI-high (MSI-H) sample sorted for sequence reads with insertion (Ins)/deletion (Del; indel) events. Homopolymer shown is chromosome (Chr) 11:118,353,038 to 118,353,053, which is one location used in the MSI algorithm. B: Histogram summarizing frequency of the different length indel events observed at Chr11:118,353,038 to 118,353,053 for the two cases shown in A.
Figure 2
Figure 2
Development of next-generation sequencing (NGS)–based microsatellite instability (MSI) algorithm. Overview of the development of the NGS-based algorithm to determine MSI status. A: An example plot of normalized mean length of homopolymer and variance in length at one locus [chromosome (Chr) 11:118,353,038 to 118,353,053]. Normalization was achieved using the mean and SD values from the MSI-stable (MSS) training group. Each point represents a single sample. A total of 300 MSS (teal) and 300 MSI-high (MSI-H; orange) samples are shown to visualize separation of MSS and MSI-H cases based on mean and variance statistics. B: Principal component (PC) analysis scores plot, showing PC1 and PC2 scores, with PC1 separating the two groups (MS, teal; MSI-H, orange). Same 300 MSS and MSI-H cases as presented in Figure 1C.
Figure 3
Figure 3
Limit of detection. Estimated sample purity of microsatellite instability–high (MSI-H) samples diluted to represent varying sample purities. Each sample (identified by shape) was diluted (identified by color) and next-generation sequencing (NGS) MSI score was assessed. Dotted lines represent cutoffs for MSI-stable (MSS; top line) and MSI-H (bottom line). Dashed line represents 20% cutoff for estimated tumor purity.
Figure 4
Figure 4
Microsatellite instability–high (MSI-H) sample distribution across tumor types. Prevalence (%) of MSI-H in each disease group in order of frequency displayed with the number of MSI-H samples on top of each bar and the total number of samples assessed with the disease group label. Each disease group (defined in Supplemental Table S1) must have at least 100 total samples with an evaluated MSI status to be included. Disease groups in gray are super groups and encompass all solid tumors (solid tumor), all hematopoietic tumors (hematopoietic tumor), or all tumors profiled (total). CNS, central nervous system; CRC, colorectal carcinoma.
Figure 5
Figure 5
Frequency of deleterious mutations in mismatch repair (MMR) genes by microsatellite instability (MSI) status. There are 2 × 2 tables for sample counts of each gene (MLH1, MSH2, MSH6, and PMS2) mutation frequency. The vertical axis plus (+) indicates presumed deleterious variant(s) observed, and the vertical axis minus (−) indicates no deleterious variants observed. Samples are split by MSI status on the horizontal axis (H indicates high, and S indicates stable). Results are further segregated into disease categories: colorectal, uterine endometrial, gastric, and other, with other representing all other tumor types not already displayed. The MMR-deficient (dMMR) 2 × 2 in each disease group represents the combined results from the four gene-level 2 × 2 tables.
Figure 6
Figure 6
Gene enrichment in microsatellite instability–high (MSI-H) or MSI-stable (MSS) tumors. Pan-tumor enrichment of genes in MSI-H (log2 odds ratio > 1) or MSS (log2 odds ratio < 1). Circle sizes represent the frequency of gene alteration in either MSI-H tumors (orange) or MSS tumors (teal). Circles representing genes without significant enrichment (dark blue) are not scaled to size. Multiple hypothesis–corrected –log10 P values are on the y axis. A: All genes with at least 25 samples are displayed. Top panel: Pathway-related (Supplemental Table S6) or mismatch repair (MMR) related genes with P < 0.05 and P > 1e-09 are labeled. P values are capped at 1e-09 for visualization purposes. Bottom panel: Enlargement of highly significantly enriched genes (P < 1e-09). P values are capped at 1e-17 for visualization purposes. Pathway-related (Supplemental Table S6) or MMR-related genes are labeled. B: List of all genes with P < 1e-09 with odds ratio (>1 enriched in MSI-H, and <1 enriched in MSS) and multiple hypothesis–corrected P value. Odds ratios corresponding with MSI-H enrichment are coded in orange, and those with MSS are coded in teal. Genes included in pathway analyses are color coded, and the pathway is listed. FDR, false discovery rate; PI3K, phosphatidylinositol 3-kinase.
Figure 7
Figure 7
Pathway enrichment with mismatch repair polymerase slippage regions removed. Enrichment of various pathways (Supplemental Table S6 for genes included in each pathway) in indicated disease types. Log2 odds ratio displayed by color: orange indicates enrichment in microsatellite instability–high, and teal indicates enrichment in MSI-stable. Gray indicates nonsignificant multiple hypothesis–corrected P values for enrichment (P ≥ 0.05). CRC, colorectal carcinoma; CUP, carcinoma of unknown primary; GI, gastrointestinal; Hh, Hedgehog; JAK, Janus kinase/signal transducers and activators of transcription; PI3K, phosphatidylinositol 3-kinase.
Figure 8
Figure 8
Microsatellite instability–high (MSI-H) is sufficient but not necessary for high tumor mutation burden (TMB). Spectrum of TMB in MSI-stable (MSS) and MSI-H samples. The y axis is TMB (mutations/Mb) plotted on a logarithmic scale to better display extreme outliers. Horizontal lines in each box indicates the median TMB, whereas the lower and upper bounds of the box represent 25th and 75th percentiles, respectively. Whiskers extend to extreme values no more than 1.5 times the interquartile range beyond the box. Points beyond whiskers are considered outliers and are plotted individually. P < 0.001 (calculated from a Mann-Whitney-Wilcox test).

References

    1. Li G.M. Mechanisms and functions of DNA mismatch repair. Cell Res. 2008;18:85–98. - PubMed
    1. Ellegren H. Microsatellites: simple sequences with complex evolution. Nat Rev Genet. 2004;5:435–445. - PubMed
    1. Shah S.N., Hile S.E., Eckert K.A. Defective mismatch repair, microsatellite mutation bias, and variability in clinical cancer phenotypes. Cancer Res. 2010;70:431–435. - PMC - PubMed
    1. Lynch H.T., Snyder C.L., Shaw T.G., Heinen C.D., Hitchins M.P. Milestones of Lynch syndrome: 1895-2015. Nat Rev Cancer. 2015;15:181–194. - PubMed
    1. Sinicrope F.A., Foster N.R., Thibodeau S.N., Marsoni S., Monges G., Labianca R., Kim G.P., Yothers G., Allegra C., Moore M.J., Gallinger S., Sargent D.J. DNA mismatch repair status and colon cancer recurrence and survival in clinical trials of 5-fluorouracil-based adjuvant therapy. J Natl Cancer Inst. 2011;103:863–875. - PMC - PubMed

Publication types