. 2019 Oct:40:101529.
doi: 10.1016/j.scr.2019.101529. Epub 2019 Aug 7.

Excision of the expanded GAA repeats corrects cardiomyopathy phenotypes of iPSC-derived Friedreich's ataxia cardiomyocytes

Affiliations

Excision of the expanded GAA repeats corrects cardiomyopathy phenotypes of iPSC-derived Friedreich's ataxia cardiomyocytes

Jixue Li et al. Stem Cell Res. 2019 Oct.

Abstract

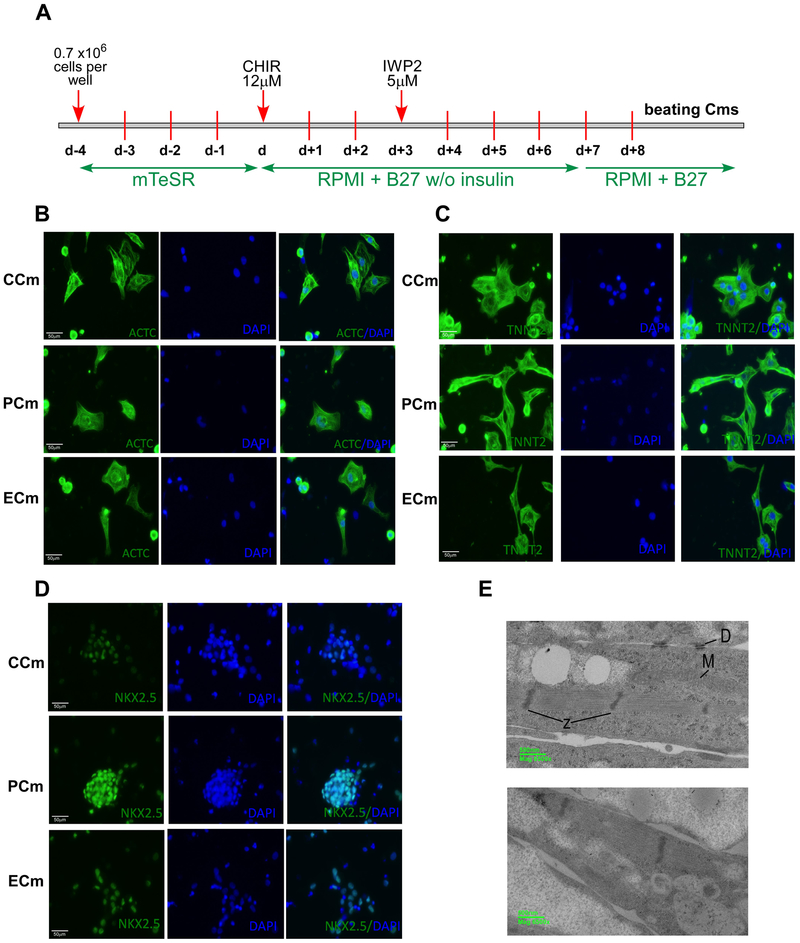
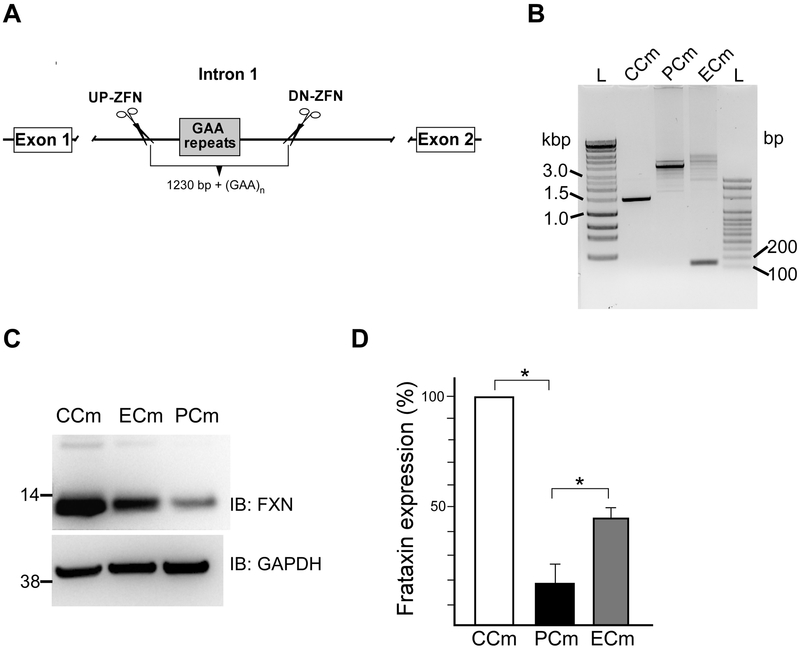
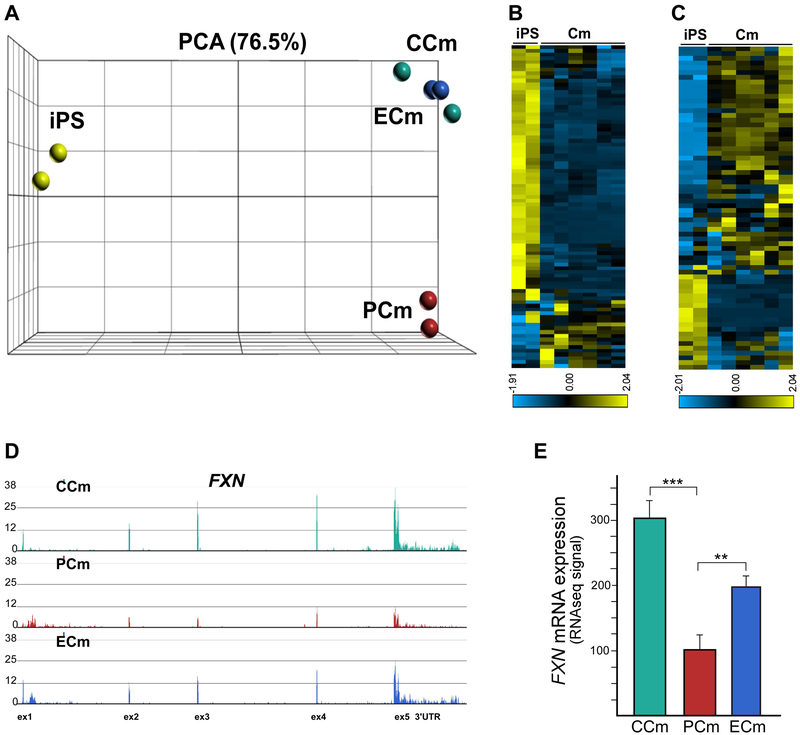
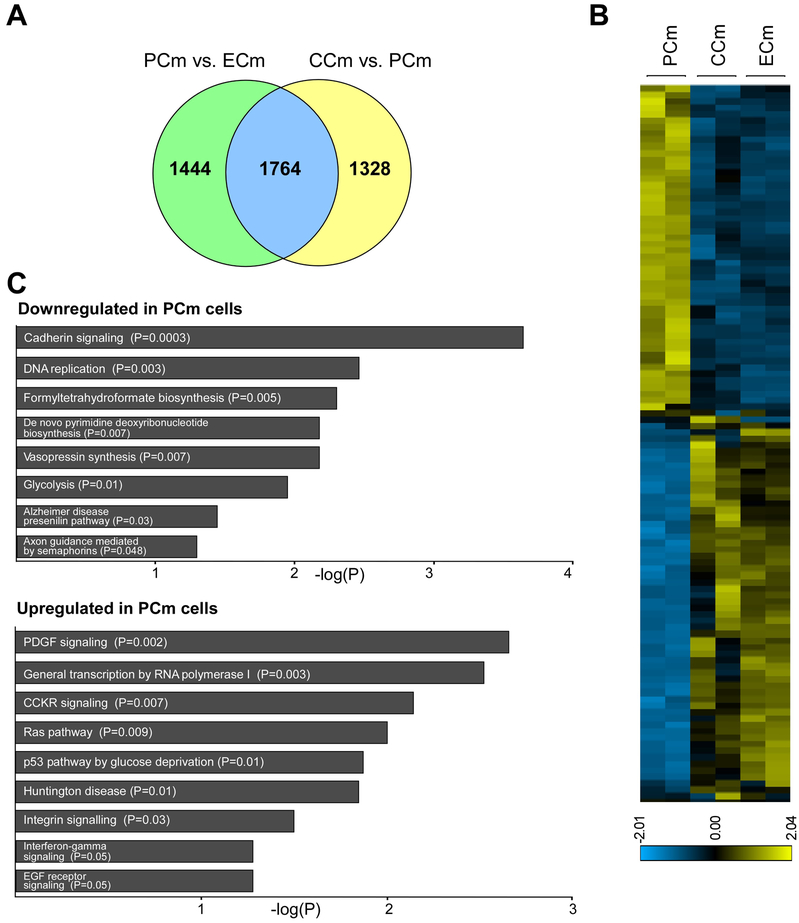
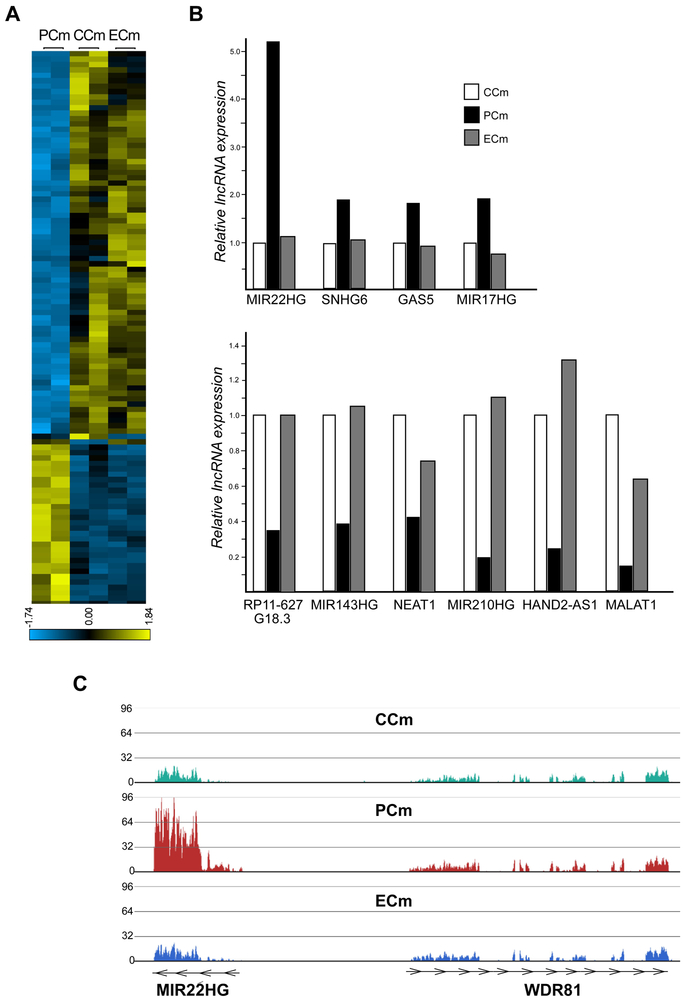
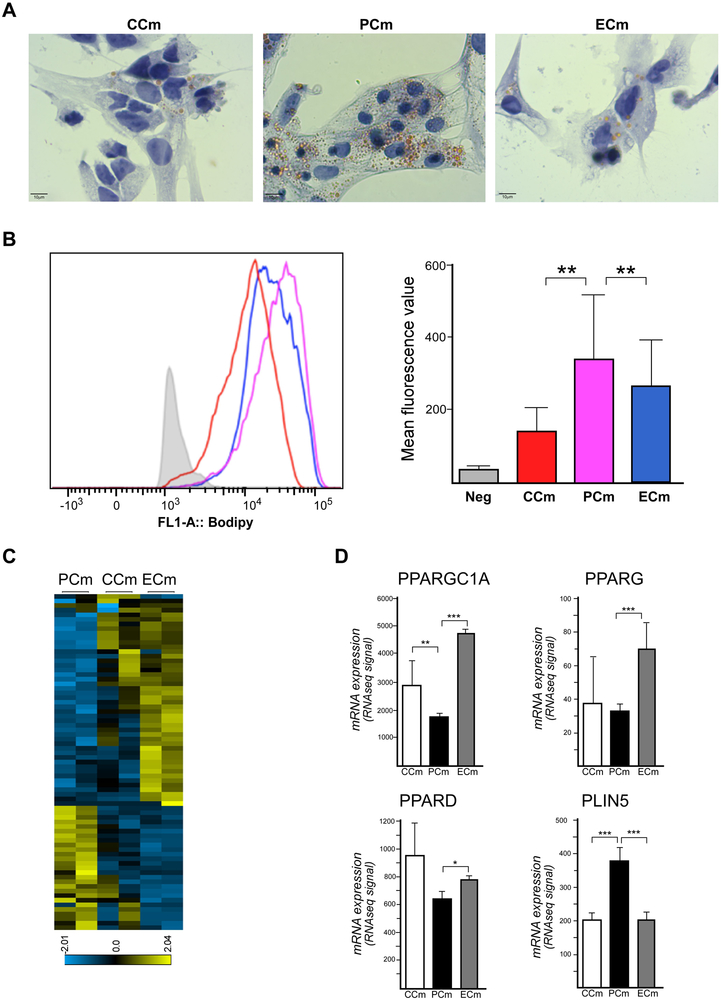
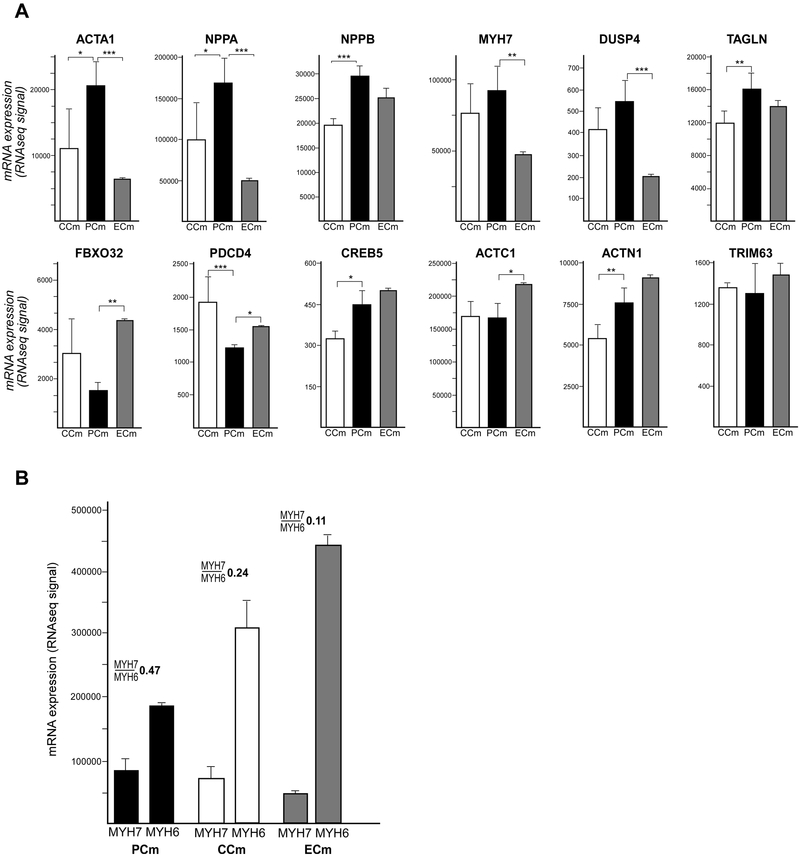
Friedreich's ataxia is caused by large homozygous, intronic expansions of GAA repeats in the frataxin (FXN) gene, resulting in severe downregulation of its expression. Pathogenic repeats are located in intron one, hence patients express unaffected FXN protein, albeit in low quantities. Although FRDA symptoms typically afflict the nervous system, hypertrophic cardiomyopathy is the predominant cause of death. Our studies were conducted using cardiomyocytes differentiated from induced pluripotent stem cells derived from control individuals, FRDA patients, and isogenic cells corrected by zinc finger nucleases-mediated excision of pathogenic expanded GAA repeats. This correction of the FXN gene removed the primary trigger of the transcription defect, upregulated frataxin expression, reduced pathological lipid accumulation observed in patient cardiomyocytes, and reversed gene expression signatures of FRDA cardiomyocytes. Transcriptome analyses revealed hypertrophy-specific expression signatures unique to FRDA cardiomyocytes, and emphasized similarities between unaffected and ZFN-corrected FRDA cardiomyocytes. Thus, the iPSC-derived FRDA cardiomyocytes exhibit various molecular defects characteristic for cellular models of cardiomyopathy that can be corrected by genome editing of the expanded GAA repeats. These results underscore the utility of genome editing in generating isogenic cellular models of FRDA and the potential of this approach as a future therapy for this disease.

Keywords: Cardiomyocytes; Friedreich's ataxia; GAA repeats; Genome editing; Isogenic iPSC; Lipid metabolism.


Conflict of interest statement

Declaration of interests

None

Figures

Figure 1
Figure 1. Characterization of cardiomyocytes differentiated from healthy (CCm), FRDA (PCm) and ZFN-edited (ECm) iPSCs.
(A) Timeline and major steps of iPSC differentiation into beating cardiomyocytes. See Supplemental Methods for details. (B-D) Expression of cardiac markers analyzed by immunostaining. Nuclei were stained by DAPI and merged images are shown. (B) ACTC1 (Actin, Alpha, Cardiac Muscle 1); (C) TNNT2 (Troponin T2, Cardiac Type); (D) NKX2.5 (NK2 Homeobox 5). (E) Electron microscopy images of Cm ultrastructure (PCm top panel and CCm bottom panel); M - mitochondria, D – desmosomes, and Z – Z-bands.
Figure 2
Figure 2. Editing of the expanded GAA repeats in FRDA cells.
(A) Schematic presentation of the editing strategy to excise intronic expanded GAAs using two ZFNs targeting regions upstream and downstream of the repeats. Details of the approach were described in (Li et al., 2015). (B) Amplification of GAA tracts using PCR. Short GAAs (~1500 bp band) are present in CCm cells while only expanded GAAs (~4000 bp corresponding to ~ 830 GAAs) are present in PCms. The amplified expanded GAA alleles are of similar length. In ECm cells, an expanded GAA allele is amplified as well as short DNA fragment ~180 bp corresponding to the edited allele (GAA repeats are excised along with ~ 1230 bp of flanking sequence). Somatic instability resulting from culturing of the iPSCs prior to cardiac differentiation is responsible for multiple fragments containing various lengths of the expanded GAAs in ECm and PCm cells. (C) Analysis of frataxin levels in CCm, PCm and ECm cells using western blot. (D) Quantitative analysis of frataxin protein expression. Presented data are based on three independent experiments conducted using two CCm lines, two PCm clones and two ECm clones. * indicates p≤0.05.
Figure 3
Figure 3. Transcriptome analysis of FRDA cardiomyocytes using RNAseq.
(A) Principle component analysis of eight samples based on RNAseq data. In addition to Cm analyses, data from two iPSC lines were included to validate cardiac commitment of Cm cells. (B) A heatmap display representing expression of an 89-gene signature of embryonic stem cells is shown for iPSC and Cm cell lines (Supplemental Table 2, Supplemental Figure 4). (C) Expression of a 79-gene KEGG Cardiac Muscle Contraction signature in iPS and Cm cell lines (Supplemental Table 2, Supplemental Figure 4). (D) Frataxin mRNA expression in CCm, PCm and ECm cells. Normalized RNAseq signal is shown for the FXN locus. Each track represents RNAseq data obtained from two cell lines in two separate RNAseq runs. (E) RNAseq signal quantitation shown as means with a signal range; ** and *** indicate p≤0.01 and p≤0.001, respectively.
Figure 4
Figure 4. Editing of the expanded GAAs partially corrects FRDA transcriptome.
(A) Venn diagram illustrating the comparison of differentially expressed genes between PCm and ECm cells (p<0.01) with genes differentially expressed between CCm and PCm cells (p<0.01). (B) A heatmap illustrating expression of the 1764 genes differentially expressed in both groups (PCm/ECm and PCm/CCm; Supplemental Table 3). (C) PANTHER pathways analysis of genes downregulated and upregulated in PCm versus CCm cells (p<0.05).
Figure 5
Figure 5. Correction of long non-coding RNA expression changes in FRDA Cms by excision of the expanded GAAs.
(A) A heatmap illustrating expression levels of 205 lncRNAs differentially expressed between CCms/PCms and PCms/ECms (p≤0.01; Supplemental Table 5, Supplemental Figure 8). (B) Relative expression values of selected lncRNAs associated with cardiovascular diseases are plotted as bar graphs (p≤0.01 for all CCms/PCms and PCms/ECms comparisons). (C) The normalized RNAseq signal at the MIR22HG locus is depicted for CCm, PCm and ECm cells. The neighboring WDR81 locus is shown for comparison. Each track represents RNAseq data obtained from two cell lines and two separate RNAseq runs.
Figure 6
Figure 6. Changes in lipid metabolism in FRDA Cms.
(A) Brightfield microscopy images are shown of CCm, PCm, and ECm cells stained with Oil Red O. (B) Quantitative flow cytometry traces for CCm (shown in red), PCm (purple), and ECm (blue) cells stained with BODIPY are shown as a measure of lipid accumulation. The fluorescence values were recorded and plotted in the bar graph. (C) A heatmap illustrates 109 lipid metabolism signature genes that are differentially expressed between PCm, CCm and ECm cells (p≤0.05; Supplemental Table 2). (D) Expression of selected critical lipid metabolism genes in CCm, PCm, and ECm cells. RNAseq signal quantitation is presented as a mean with a signal range; * p≤0.05, ** p≤0.01 and *** p≤0.001.
Figure 7
Figure 7. Expression signature of cardiac hypertrophy in PCm cells
(A) Expression values of a 12-gene cardiac hypertrophy signature (Carlson et al., 2013) are presented as mean with a signal range. Significant differences are indicated by asterisks: * p≤0.05, ** p≤0.01 and *** p≤0.001. (B) Changes in MYH7 and MYH6 expression for PCms compared to CCm and ECm cells along with the calculated MYH7/MYH6 expression ratio are shown by the bar graph.

References

    1. Aggarwal P, Turner A, Matter A, Kattman SJ, Stoddard A, Lorier R, Swanson BJ, Arnett DK, and Broeckel U, 2014. RNA expression profiling of human iPSC-derived cardiomyocytes in a cardiac hypertrophy model. PLoS One 9, e108051. - PMC - PubMed
    1. Batista PJ, and Chang HY, 2013. Long noncoding RNAs: cellular address codes in development and disease. Cell 152, 1298–1307. - PMC - PubMed
    1. Bhalla AD, Khodadadi-Jamayran A, Li Y, Lynch DR, and Napierala M, 2016. Deep sequencing of mitochondrial genomes reveals increased mutation load in Friedreich's ataxia. Annals of clinical and translational neurology 3, 523–536. - PMC - PubMed
    1. Bulteau AL, O'Neill HA, Kennedy MC, Ikeda-Saito M, Isaya G, and Szweda LI, 2004. Frataxin acts as an iron chaperone protein to modulate mitochondrial aconitase activity. Science 305, 242–245. - PubMed
    1. Campuzano V, Montermini L, Molto MD, Pianese L, Cossee M, Cavalcanti F, Monros E, Rodius F, Duclos F, Monticelli A, Zara F, Canizares J, Koutnikova H, Bidichandani SI, Gellera C, Brice A, Trouillas P, De Michele G, Filla A, De Frutos R, Palau F, Patel PI, De Donato S, Mandel JL, Cocozza S, Koenig M, and Pandolfo M, 1996. Friedreich's ataxia: Autosomal recessive disease caused by an intronic GAA triplet repeat expansion. Science 271, 1423–1427. - PubMed

Publication types

MeSH terms

Substances