. 2019 Sep 27:19:586-596.
doi: 10.1016/j.isci.2019.08.010. Epub 2019 Aug 8.

A System for Analog Control of Cell Culture Dynamics to Reveal Capabilities of Signaling Networks

Affiliations

A System for Analog Control of Cell Culture Dynamics to Reveal Capabilities of Signaling Networks

Chaitanya S Mokashi et al. iScience. .

Abstract

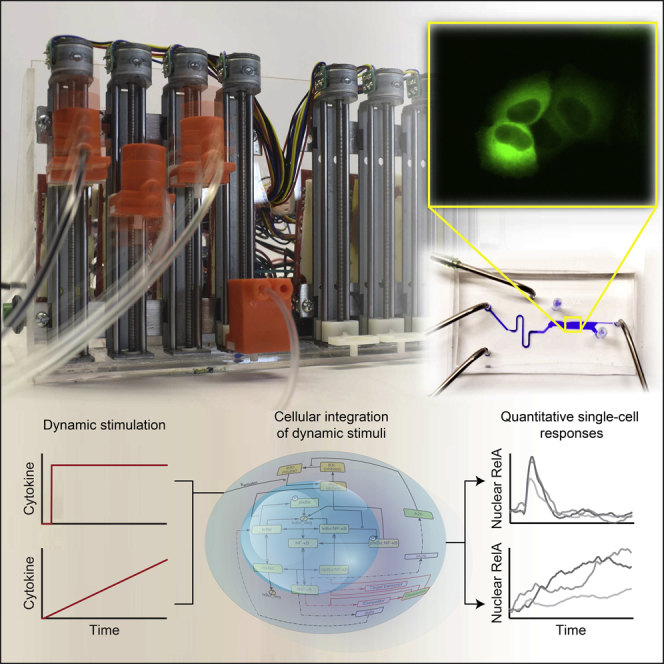
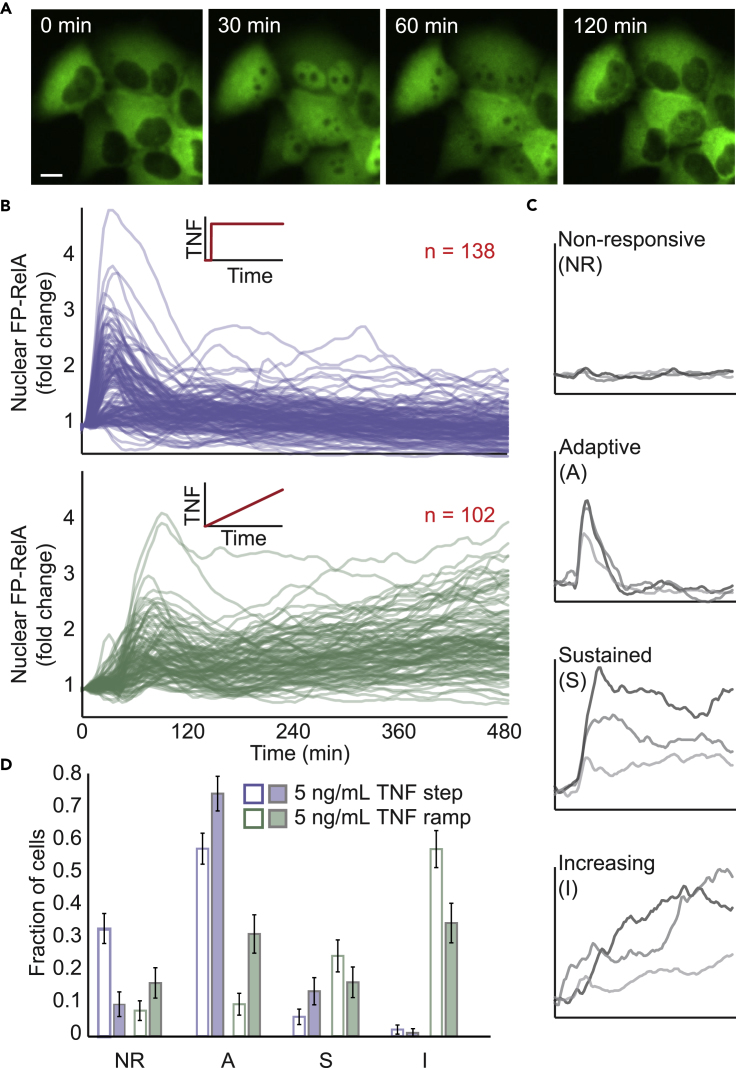
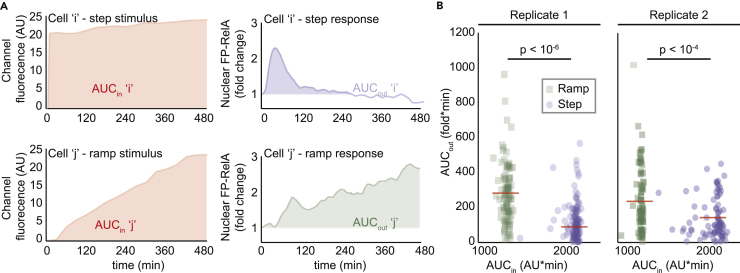
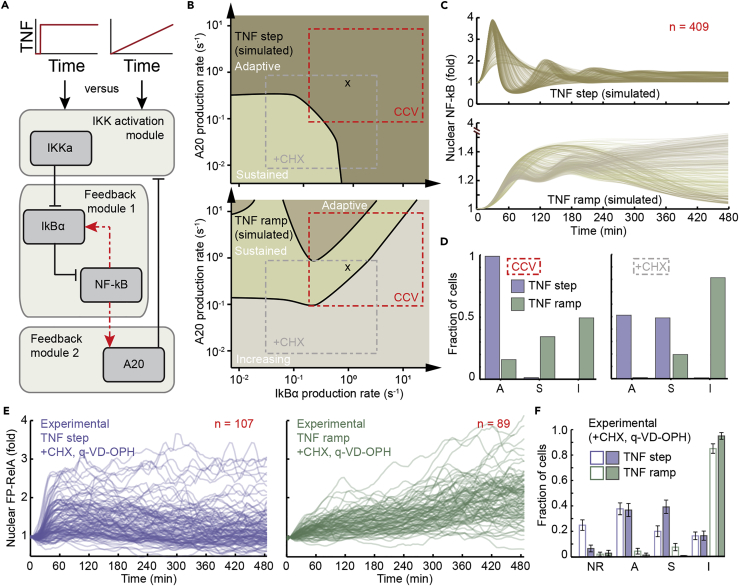
Cellular microenvironments are dynamic. When exposed to extracellular cues, such as changing concentrations of inflammatory cytokines, cells activate signaling networks that mediate fate decisions. Exploring responses broadly to time-varying microenvironments is essential to understand the information transmission capabilities of signaling networks and how dynamic milieus influence cell fate decisions. Here, we present a gravity-driven cell culture and demonstrate that the system accurately produces user-defined concentration profiles for one or more dynamic stimuli. As proof of principle, we monitor nuclear factor-κB activation in single cells exposed to dynamic cytokine stimulation and reveal context-dependent sensitivity and uncharacterized single-cell response classes distinct from persistent stimulation. Using computational modeling, we find that cell-to-cell variability in feedback rates within the signaling network contributes to different response classes. Models are validated using inhibitors to predictably modulate response classes in live cells exposed to dynamic stimuli. These hidden capabilities, uncovered through dynamic stimulation, provide opportunities to discover and manipulate signaling mechanisms.

Keywords: Biological Science Instrumentation; Complex Systems; Immunology; Mathematical Biosciences.


Conflict of interest statement

The authors declare no competing financial interests.

Figures

None
Graphical abstract
Figure 1
Figure 1
Gravity Pump and Cell Culture Chamber for Dynamic Stimulation (A) Top view of the dynamic stimulation device with three inlets (I1, I2, I3), two cell-seeding ports (SP1 and SP2), and an outlet (see also Data S1). Inlets I1 and I2 are followed by a raised mixer (inset) that dilutes stimulus to desired concentrations according to flow rates from I1 and I2. I3 controls the laminar interface position (LP) of the experimental band in the cell culture channel. Cells are seeded from SP2 into the cell culture channel and observed by time-lapse imaging. See also Figure S1. (B) Flow rates through the inlets (I1, I2 and I3) are controlled by hydrostatic pressure differences between corresponding reservoirs (R1, R2, and R3) and the outlet. In the default position (left), R3 is positioned higher such that the stimulus from the mixer is confined only to the mixer band (“M”). During experiment (center and right), R1 and R2 are positioned higher to move the LP over the experimental band (“E”). Volume fraction (Xc) of stimulus in the experimental band is determined by the relative positions of R1 and R2. Control band (“C”) is not exposed to stimulus during the experiment. (C) The “gravity pump” consists of eight vertically mounted stepper motors with screw-nut platforms and an Arduino microcontroller to control platform heights; 3D printed reservoirs (see also Data S2) on platforms 1–4 are connected to corresponding inlets via tubing. Differences between inlet (h1, h2, and h3) and outlet (h0) reservoir heights determine the hydrostatic driving pressure at each inlet. See also Video S1.
Figure 2
Figure 2
Automated Control of the Dynamic Stimulation System (A) Experiments are user defined by temporal profiles of volume fraction of cytokine (Xc; top left), laminar position (LP; top right), and flow rate (Qc; set to a constant value of Qc = 5 × 10−11 m3/s throughout each experiment). Using a physical model, the user-defined profiles for Xc, LP, and Qc are converted to time-varying reservoir heights (bottom left). Temporal profiles for reservoir heights are loaded on the gravity pump and run during the experiment. Green panel (bottom right) shows the predicted time-varying profile for Xc in the “E” band of the dynamic stimulation device. (B) Fluorescence intensity of Alexa 448-conjugated BSA (top) measured across the cell culture channel (yellow box in Figure 1A). Observed fluorescence in the “E” band matches predicted Xc within 5% error (bottom). See also Figure S2 and Video S2.
Figure 3
Figure 3
Modularity of the Dynamic Stimulation System (A) A variant device with four inlets to the mixer for simultaneous control of multiple distinct stimuli. Each inlet is connected to reservoirs containing growth medium or different stimuli. (B) Example experiment using reservoirs with Alexa 594- and Alexa 647-conjugated BSA (A594 or A647, respectively, in A) connected to two of the mixer inlets. The other inlets are connected to reservoirs with Medium only (M). Resulting fluorescence measured at the same point in the “E” band of the cell culture device shows that out-of-phase oscillations can be achieved.
Figure 4
Figure 4
NF-κB Pathway Responses to Step and Ramp Stimulation in Single Cells (A) Time-lapse images of FP-RelA-expressing HeLa cells exposed to TNF stimulation as a step-up to continuous 5 ng/mL at the 0-min time point. Scale bar, 10 μm. (B) Time courses of nuclear FP-RelA fold change measured in single cells exposed to TNF stimulation as a 5-ng/mL TNF step (top, see also Video S3) or a concentration ramp from 0 to 5 ng/mL (bottom) over an 8-h period for a representative experiment. Raw unprocessed time courses are shown in Figure S3. Inset numbers indicate the total number of cells per condition. (C) Time courses in (A) are classified into four cellular response modes: Non-responsive, Adaptive, Sustained, and Increasing. Representative single-cell responses are depicted for each. See also Figure S3. (D) Fraction of single cells in each response mode for step and ramp stimulation show statistically significant differences in their distributions (p value < 0.00001; Pearson's chi-squared test). Independent biological replicates are shown as open and closed bars (Replicate 1: 138 cells step and 102 cells ramp; Replicate 2: 87 cells step and 80 cells ramp). Error bars represent standard deviation of 5,000 bootstrap samples. See also Figures S3–S7.
Figure 5
Figure 5
Ramp Stimulation Produces Greater Responses Despite Smaller Aggregate TNF Exposure (A) For each cell, AUC of TNF exposure (AUCin, left column) and fold change AUC of nuclear FP-RelA response (AUCout, right column) are calculated. (B) Scatterplots for independent biological replicate experiments of AUCin (x axis) and AUCout (y axis) for both 8-h experiments (Replicate 1: 138 cells step and 102 cells ramp; Replicate 2: 87 cells step and 80 cells ramp; see also Figure 4) show that although ramp stimulus has less AUCin, it produces a greater cellular response. Differences between distributions for step and ramp stimuli are statistically significant based on permutation test (see also Figure S8).
Figure 6
Figure 6
Cell-to-Cell Variability in Negative Feedback Recapitulates Response Modes (A) Schematic of negative feedback modules within the D2FC computational model (Lee et al., 2014) of the NF-κB signaling network (see also Data S3). NF-κB-driven expression of genes that encode for IkBα and A20, respectively, acts to sequester NF-κB in the cytoplasm and to limit upstream kinase activity of IKK. The activated species is denoted as IKKa in the model. (B) Simulated single-cell responses to a TNF step (top) or TNF ramp (bottom) are classified into response modes across a range of production rates for IkBα and A20 to simulate cell-to-cell variability. Although variability was modeled by simulating different translation rates for negative feedback mediators, numerically identical results can be achieved by modeling variability in transcription. The default translation rates for IkBα and A20 in the D2FC are marked with an “x.” (C) Cell-to-cell variability (CCV) is simulated by sampling values for IkBα and A20 translation rates across a range of values (red box in B; see also Transparent Methods). For each sampled pair of translation rates single-cell time course responses for a TNF step (top) or TNF ramp (bottom) are simulated. Inset number indicates number of simulated single-cell trajectories. The y axis for the simulated TNF ramp (bottom) is scaled to assist with visualization of simulated time course responses. (D) Quantification of the fraction of single cells in Adaptive (A), Sustained (S), and Increasing (I) categories for simulated single-cell trajectories in boxes marked “CCV” (left) and “+CHX” (right) in (B) (see also Transparent Methods). The +CHX box simulates cell-to-cell variability in the presence of cycloheximide to inhibit protein translation. (E) Time courses of nuclear FP-RelA fold change measured in single cells exposed to TNF stimulation as a 5-ng/mL TNF step (left) or a concentration ramp from 0 to 5 ng/mL (right) over an 8-h period for a representative experiment. CHX (640 ng/mL) and caspase inhibitor (5 μM; q-VD-OPH) are introduced to the cell culture 30 min before TNF stimulation. Inset numbers indicate the total number of cells per condition. See also Figure S9. (F) Fraction of single cells in each response class for step and ramp stimulation are enriched for sustained and increasing responses, respectively, in the presence of CHX and q-VD-OPH (c.f. Figure 4D). Independent biological replicates are shown as open and closed bars (90 and 65 cells for step and ramp conditions, respectively, in replicate 2). Distributions for step and ramp stimulation in the presence of inhibitors show statistically significant changes when compared with step and ramp distributions, respectively, in the absence of inhibitors (Figure 4D; p value < 0.00001; Pearson's chi-squared test). Error bars represent standard deviation of 5,000 bootstrap samples.

References

    1. Adamson A., Boddington C., Downton P., Rowe W., Bagnall J., Lam C., Maya-Mendoza A., Schmidt L., Harper C.V., Spiller D.G. Signal transduction controls heterogeneous NF-kappaB dynamics and target gene expression through cytokine-specific refractory states. Nat. Commun. 2016;7:12057. - PMC - PubMed
    1. Albeck J.G., Mills G.B., Brugge J.S. Frequency-modulated pulses of ERK activity transmit quantitative proliferation signals. Mol. Cell. 2013;49:249–261. - PMC - PubMed
    1. Ashall L., Horton C.A., Nelson D.E., Paszek P., Harper C.V., Sillitoe K., Ryan S., Spiller D.G., Unitt J.F., Broomhead D.S. Pulsatile stimulation determines timing and specificity of NF-kB – dependent transcription. Science. 2009;324:242–246. - PMC - PubMed
    1. Bennett M.R., Pang W.L., Ostroff N.A., Baumgartner B.L., Nayak S., Tsimring L.S., Hasty J. Metabolic gene regulation in a dynamically changing environment. Nature. 2008;454:1119–1122. - PMC - PubMed
    1. Brimmo A., Goyette P.A., Alnemari R., Gervais T., Qasaimeh M.A. 3D printed microfluidic probes. Sci. Rep. 2018;8:10995. - PMC - PubMed