. 2019 Nov 5;30(5):917-936.e10.
doi: 10.1016/j.cmet.2019.07.015. Epub 2019 Aug 22.

Podoplanin-Expressing Macrophages Promote Lymphangiogenesis and Lymphoinvasion in Breast Cancer

Affiliations

Podoplanin-Expressing Macrophages Promote Lymphangiogenesis and Lymphoinvasion in Breast Cancer

Paweł Bieniasz-Krzywiec et al. Cell Metab. .

Abstract

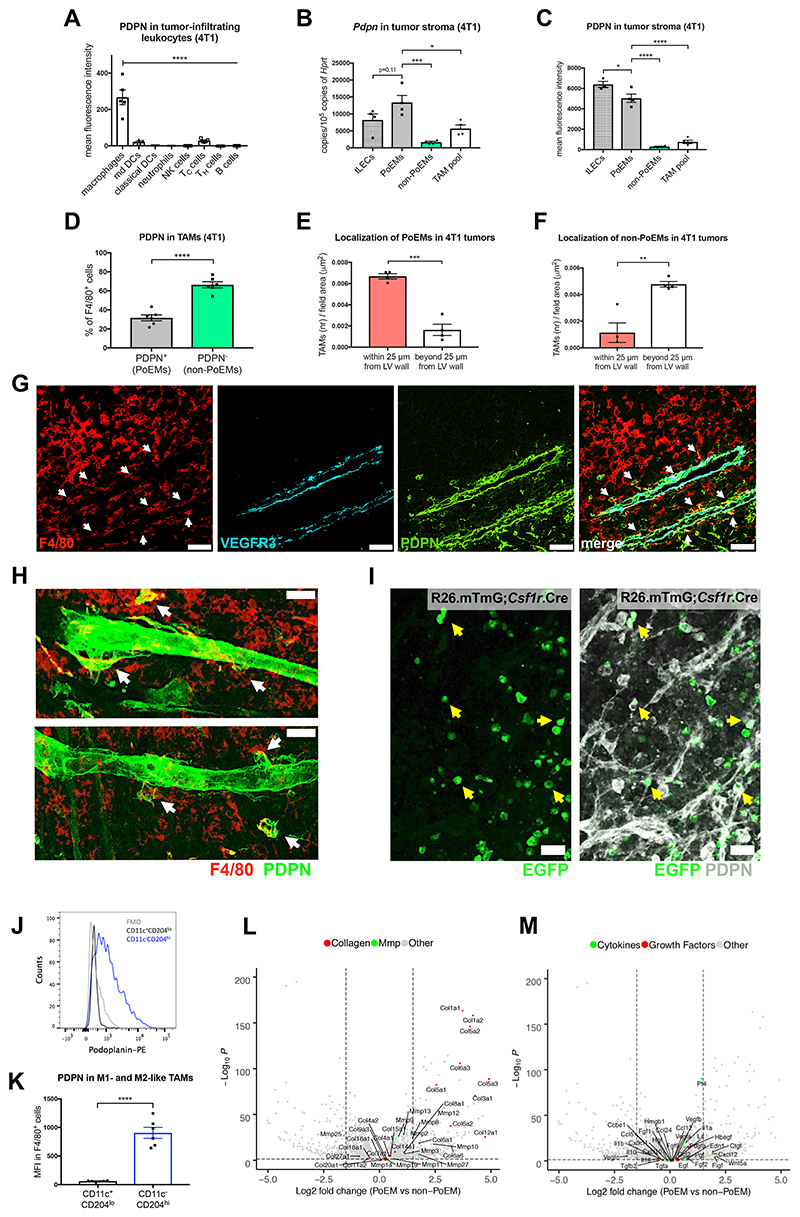
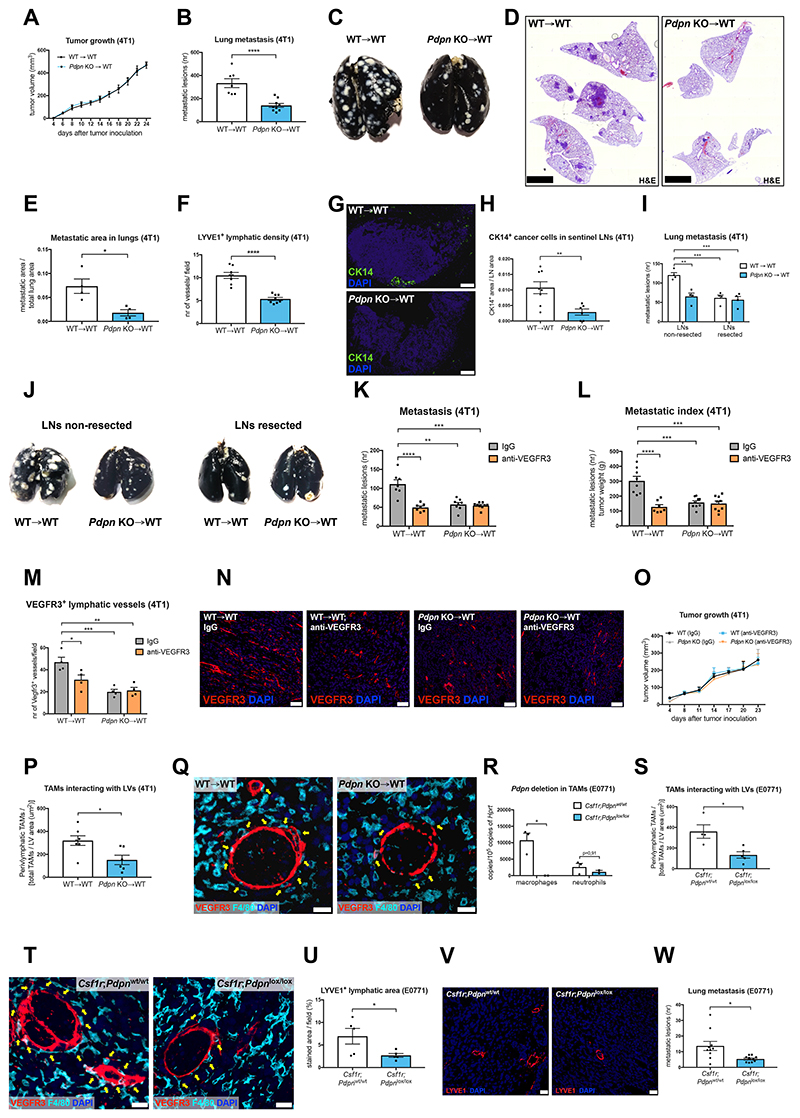
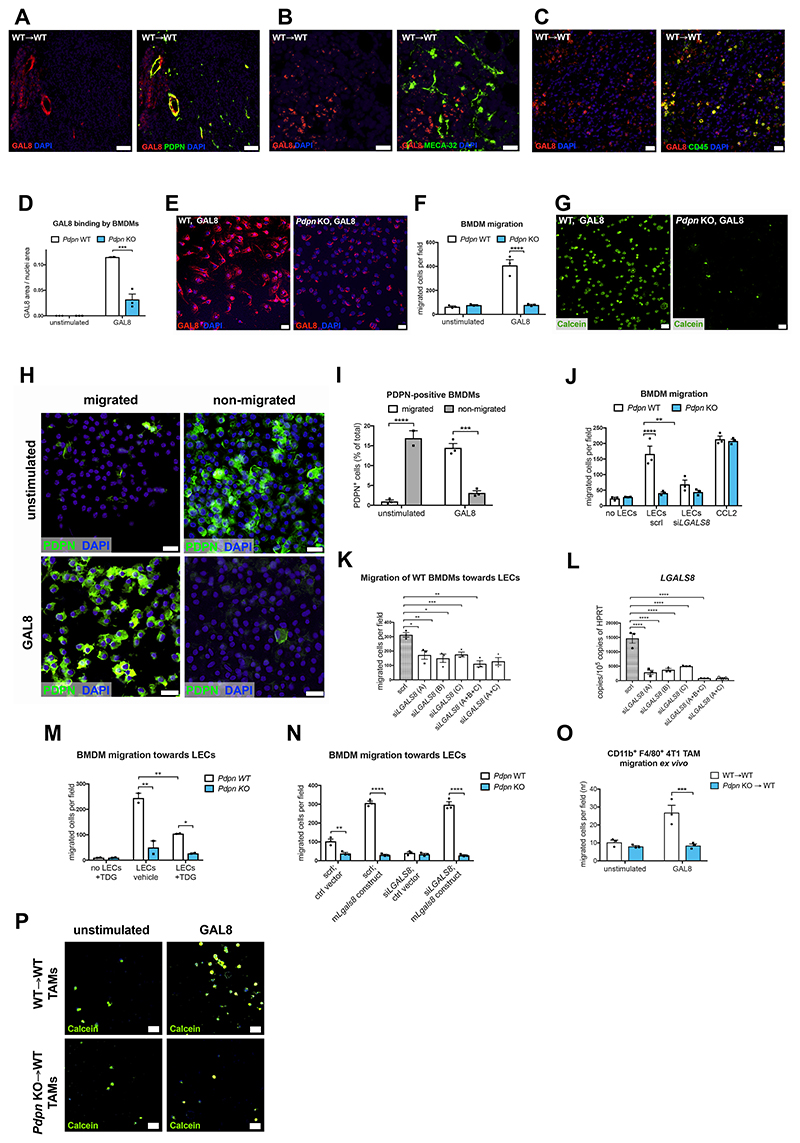
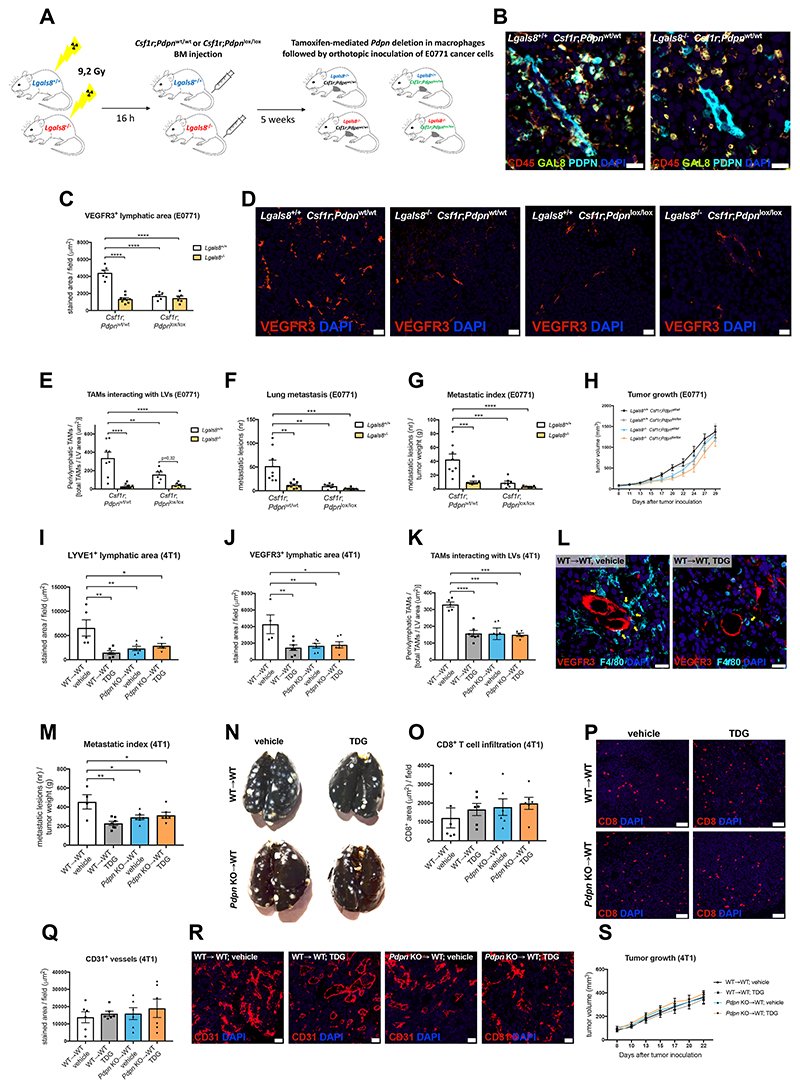
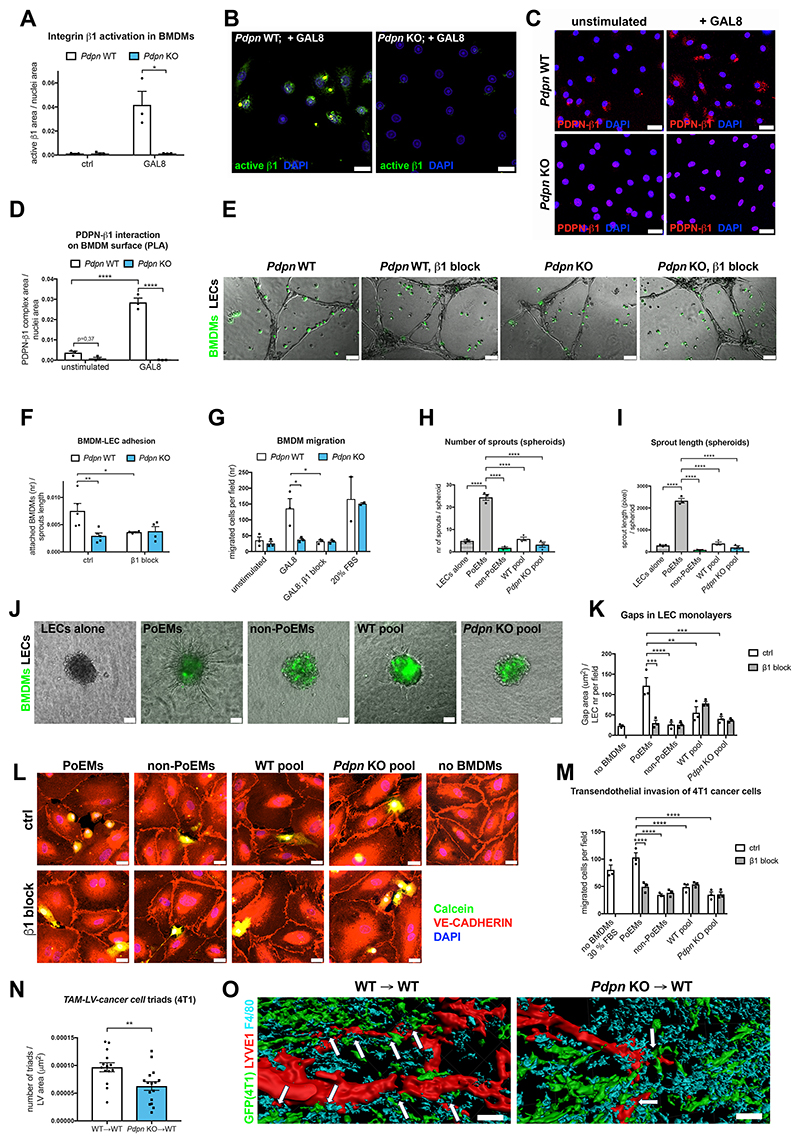
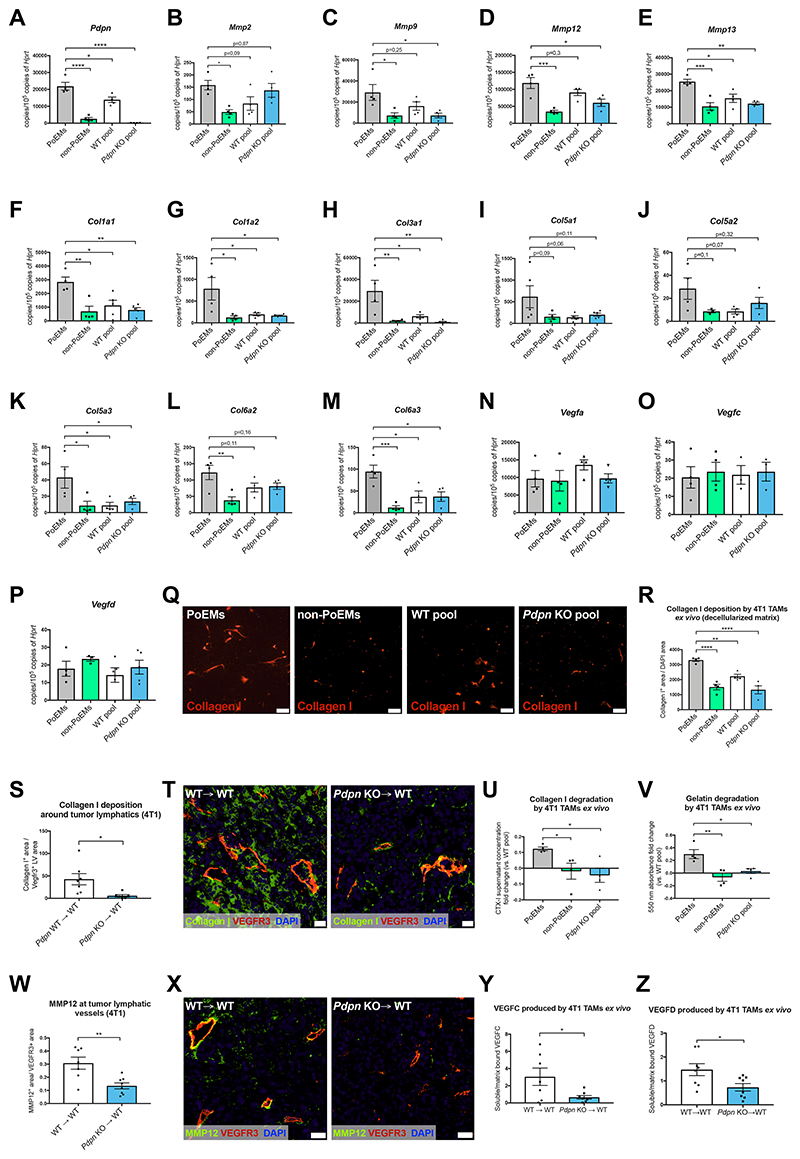
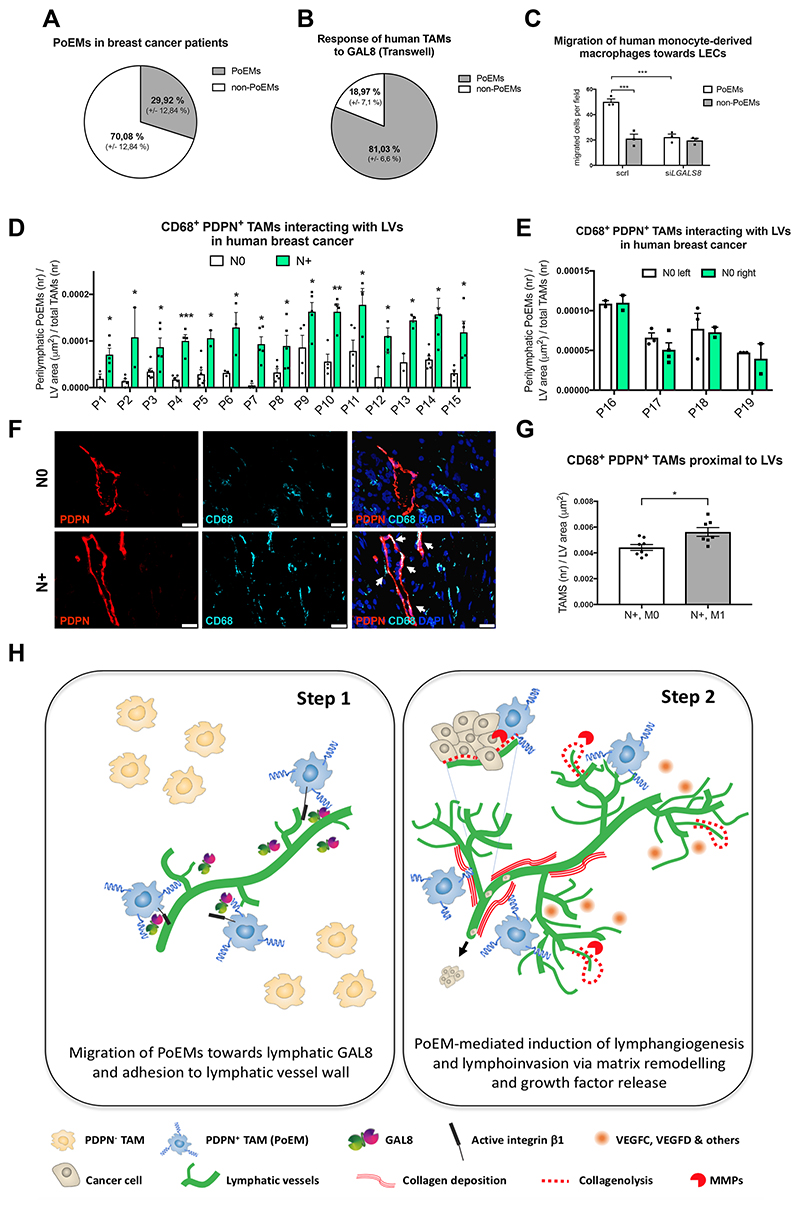
Among mammary tumor-infiltrating immune cells, the highest expression of podoplanin (PDPN) is found in a subset of tumor-associated macrophages (TAMs). We hereby demonstrate that PDPN is involved in the attachment of this TAM subset to lymphatic endothelial cells (LECs). Mechanistically, the binding of PDPN to LEC-derived galectin 8 (GAL8) in a glycosylation-dependent manner promotes the activation of pro-migratory integrin β1. When proximal to lymphatics, PDPN-expressing macrophages (PoEMs) stimulate local matrix remodeling and promote vessel growth and lymphoinvasion. Anti-integrin β1 blockade, macrophage-specific Pdpn knockout, or GAL8 inhibition impairs TAM adhesion to LECs, restraining lymphangiogenesis and reducing lymphatic cancer spread. In breast cancer patients, association of PoEMs with tumor lymphatic vessels correlates with incidences of lymph node and distant organ metastasis.

Keywords: breast cancer; lymph nodes; lymphangiogenesis; lymphoinvasion; metastasis; podoplanin; tumor-associated macrophages.


Figures

Figure 1
Figure 1. Podoplanin-expressing macrophages (PoEMs) represent a perilymphatic TAM subset.
(A-D) FACS analysis of the expression of PDPN in 4T1 tumor-infiltrating CD45+ immune cells: macrophages (CD11b+, F4/80+), monocyte-derived DCs (CD11b+, CD11c+, F4/80-), classical DCs (CD11b-, CD11c+), neutrophils (CD11b+, Ly6G+), NK cells (NKp46+), cytotoxic T cells (TCRβ+, CD4-, CD8+), T helper cells (TCRβ+, CD4+, CD8-) and B cells (CD19+) (A). qRT-PCR analysis of the expression of Pdpn mRNA in stromal populations sorted from 4T1 tumors: LECs (CD45-, CD31+, PDPN+), PoEMs (CD45+, CD11b+, F4/80+, PDPN+), non-PoEMs (CD45+, CD11b+, F4/80+, PDPN-) and total TAM pool (CD45+, CD11b+, F4/80+) (B). FACS analysis of the expression of PDPN in stromal populations in 4T1 tumors: LECs (CD45-, CD31+, PDPN+), PoEMs (CD45+, CD11b+, F4/80+, PDPN+), non-PoEMs (CD45+, CD11b+, F4/80+, PDPN-) and total TAM pool (CD45+, CD11b+, F4/80+) (C). FACS analysis of PDPN+ (PoEMs) and PDPN- (non-PoEMs) fractions in 4T1 TAMs (CD11b+, F4/80+) (D). (E-F) Immunofluorescent analysis of the localization of F4/80+, PDPN+ (E) or F4/80+, PDPN- (F) TAMs next to PDPN+, VEGFR3+ LVs (within a distance of 25 μm from lymphatic vessel wall) and far from PDPN+, VEGFR3+ LVs in 4T1 tumors. The number of cells was normalized per counting area (μm2). (G) Representative images of the localization of F4/80+, PDPN+ (white arrows) or F4/80+, PDPN- TAMs in the proximity and far from PDPN+, VEGFR3+ LVs in 4T1 tumors bore by WT→WT chimeras. (H) Representative confocal images of 100 μm 4T1 tumor sections demonstrating F4/80+, PDPN+ TAMs (white arrows) in close proximity to PDPN+ LVs. (I) Representative confocal images of thick E0771 tumor sections implanted in ROSAmT/mG;Csf1r.iCre mice, demonstrating EGFP+, PDPN+ macrophages (yellow arrows) in the proximity but not incorporated into PDPN+ LVs. mT/mG, membrane-Tomato/membrane-GFP. (J-K) FACS analysis of the expression of PDPN in 4T1-derived TAM (CD11b+, F480+) populations, namely M1-like (CD11chi, CD204lo) and M2-like (CD11clo, CD204hi). Similar results were obtained when gating for MHC II and CD206 for M1-like and M2-like populations (see Figure S1E-S1G). (L-M) Volcano plots showing the transcript distribution for several collagen subunits and MMPs (L) or cytokines and growth factors (M). The logarithms of the fold changes of individual genes (x axis) are plotted against the negative logarithm of their p-value to base 10 (y axis). Positive log2 (fold change) values represent upregulation in PoEMs (sorted as triple positive cells for CD11b, F4/80, PDPN) compared to non-PoEMs (CD11b+, F4/80+, PDPN- cells) out of the same tumor sample. Negative values represent downregulation. Dots above the horizontal dashed line represent differentially expressed genes with p<0,05 after correction for multiple testing. Statistical analysis: *P<0,05; **P<0,005; ***P<0,0005; ****P<0,00005. Graphs show mean ± standard error of the mean (SEM). Scale bars: 50 μm (G, H, I). DC, dendritic cells; PoEMs, Podoplanin-expressing macrophages; non-PoEMs, Podoplanin-negative macrophages; TAMs, tumor-associated macrophages; tLECs, tumor lymphatic endothelial cells.
Figure 2
Figure 2. Deletion of PDPN in TAMs inhibits tumor lymphatic growth and metastasis.
(A-E) 4T1 tumor growth (A), lung metastasis (B), representative images of black ink-injected lungs from 4T1 tumor-bearing mice (C), representative images of lung sections stained with hematoxylin-eosin (H&E) (D) and histologically assessed metastatic area in lungs (E) of WT→WT or Pdpn KO→WT chimeras. Data show representative values of 4 independent experiments. (F) Quantifications of 4T1 tumor sections stained for a lymphatic endothelial cell specific marker LYVE1. (G-H) Representative images and quantifications of inguinal lymph nodes from 4T1 tumor-bearing mice, stained for cytokeratin 14 (CK14) as a marker of cancer cells. (I-J) Quantification of lung metastasis (I) and representative images of black ink-injected lungs (J) from mice in which lymphadenectomy of tumor-draining lymph nodes was performed 7 days prior to 4T1 cell inoculation. (K-O) Quantification of lung metastasis (K), metastatic index (L), VEGFR3+ lymphatics in tumors (M), representative images of tumor sections stained for VEGFR3 (N) and 4T1 tumor growth (O) in WT→WT and Pdpn KO→WT mice treated with a VEGFR3-blocking antibody (Mf431C1) or with an isotype (rat IgG) control by bi-weekly intratumoral injections (40 μg per 1 g of body weight). (P-Q) Quantification (P) and representative images (Q) of F4/80+ TAMs (yellow arrows) directly interacting with VEGFR3+ LVs in 4T1 tumors. (R) qRT-PCR for Pdpn mRNA in CD11b+, F4/80+ TAMs and CD11b+, Ly6G+ neutrophils isolated from E0771 tumors bore by Csf1r;Pdpnwt/wt or Csf1r;Pdpnlox/lox mice. (S-T) Quantification (S) and representative images (T) of F4/80+ TAMs (yellow arrows) directly interacting with VEGFR3+ LVs in E0771 tumors. (U-V) Quantification (U) and representative images (V) of E0771 tumor sections stained for a lymphatic endothelial cell specific marker LYVE1. (W) E0771 lung metastasis. Statistical analysis: *P<0,05; **P<0,005; ***P<0,0005; ****P<0,00005. Graphs show mean ± SEM. Scale bars: 20 μm (N, Q, T); 50 μm (V); 100 μm (G); 2,5 mm (D). DAPI, 49,6-diamidino-2-phenylindole.
Figure 3
Figure 3. Perilymphatic macrophage localization is mediated by GAL8 expression in LECs.
(A-C) Representative images of 4T1 tumor sections stained for GAL8 and PDPN (A), GAL8 and MECA-32 (B) and GAL8 and CD45 (C). (D-E) Quantification (D) and representative images (E) of WT or Pdpn KO BMDMs stained for GAL8 upon 40’ incubation with recombinant murine GAL8 (0,5 μM) or PBS (unstimulated). (F-G) Quantification (F) and representative images (G) of WT or Pdpn KO Calcein-labelled BMDM migration through 8 μm pores (Transwell) in response to recombinant murine GAL8 (0,5 μM) or normal medium (unstimulated). (H-I) Representative images (H) and quantification (I) of WT BMDM migration through 8 μm pores (Transwell) in response to murine recombinant GAL8 (0,5 μM) or normal medium (unstimulated). Migrated and non-migrated BMDM fractions were stained for PDPN and DAPI. (J) Quantification of WT or Pdpn KO BMDM migration through 8 μm pores (Transwell) in response to soluble factors released by LECs (HMVECs, human microvascular endothelial cells) silenced (siLgals8) or not (scrl) for Lgals8, a gene encoding GAL8. CCL2 was used as a positive control. (K-L) Quantification of the migration of WT BMDMs through 8 μm pores in response to LEC-derived soluble factors (K). LECs were silenced for Lgals8 using 3 different siRNA probes separately or in combination (L). scrl, scrambled control. (M) Quantification of WT or Pdpn KO BMDMs migration through 8 μm pores in response to LEC-derived soluble factors. LECs were cultured with GAL8 inhibitor (TDG, 20mM). Data show representative values of two independent experiments. (N) Quantification of WT or Pdpn KO BMDM migration through 8 μm pores (Transwell) in response to soluble factors released by HMVECs, silenced (siLGALS8) or not (scrl) for LGALS8, a gene encoding GAL8. Prior to the migration assay, LECs were transduced with a viral vector carrying a plasmid overexpressing murine Lgals8 or a control plasmid (see Figure S6G-S6H). (O-P) Quantification (O) and representative images (P) of the migration of Calcein-labelled CD11b+, F4/80+ TAMs sorted from 4T1 tumors bore by WT→WT and Pdpn KO→WT chimeras. The migration through 8 μm pores occurred in response to recombinant murine GAL8. The graph shows values of three biological repetitions per condition. Statistical analysis: *P<0,05; **P<0,005; ***P<0,0005; ****P<0,00005. Graphs show mean ± SEM. Scale bars: 20 μm (B, C, E, G, H); 50 μm (A, M). CCL2, chemokine (C-C motif) ligand 2; DAPI, 49,6-diamidino-2-phenylindole; scrl, scrambled control; LEC, lymphatic endothelial cells; TDG, thiodigalactoside.
Figure 4
Figure 4. Genetic deletion of Lgals8 in lymphatics or pharmacologic inhibition of GAL8 prevents lymphatic growth and PoEM-dependent lymphoinvasion.
(A) Scheme illustrating generation of Csf1r;Pdpnwt/wt or Csf1r;Pdpnlox/lox chimeras upon lethal irradiation of Lgals8+/+ or Lgals8-/- mice and subsequent BM reconstitution. 5 weeks after the procedure, mice were injected intraperitoneally for 5 consecutive days with 1 mg of tamoxifen in order to ensure Pdpn deletion in Csf1r+ cells (macrophages) of the Csf1r;Pdpnlox/lox group. Next, the chimeras were orthotopically injected with E0771 breast cancer cells. Gy, Gray. (B) Representative images of E0771 tumor sections stained for CD45, GAL8 and PDPN, demonstrating that the deletion of GAL8 in Lgals8-/- Csf1r;Pdpnwt/wt chimeras is restricted to PDPN+ LVs. (C-D) Quantifications and representative images of E0771 tumor sections stained for a lymphatic endothelial cell marker VEGFR3. (E) Quantification of F4/80+ TAMs directly interacting with VEGFR3+ LVs in E0771 tumors, assed by immunostaining. (F-H) Lung metastasis (F), metastatic index (G) and E0771 tumor growth (H) of Csf1r;Pdpnwt/wt or Csf1r;Pdpnlox/lox BM chimeras generated in Lgals8+/+ or Lgals8-/- mice. (I-J) Quantifications of 4T1 tumor sections stained for lymphatic endothelial cell markers, i.e. LYVE1 (I) and VEGFR3 (J). The tumors were injected with a GAL8 inhibitor (TDG, 120 mg/kg body weight) or vehicle (PBS) 3 times per week throughout the experiment. (K-L) Quantification (K) and representative images (L) of F4/80+ TAMs (yellow arrows) directly interacting with VEGFR3+ LVs in 4T1 tumors injected tri-weekly with TDG (120 mg/kg) or vehicle (PBS). (M-N) Metastatic index (M) and representative images of black ink-injected lungs from 4T1 tumor-bearing mice (N). Tumors were injected tri-weekly with TDG (120 mg/kg) or vehicle (PBS). (O-P) Quantification (O) and representative images (P) of CD8+ T cells infiltrating 4T1 tumors injected tri-weekly with TDG (120 mg/kg) or vehicle (PBS). (Q-R) Quantification (Q) and representative images (R) of CD31+ blood vessels in 4T1 tumors injected tri-weekly with TDG (120 mg/kg) or vehicle (PBS). (S) 4T1 tumor growth in WT→WT and Pdpn KO→WT mice. The tumors were injected tri-weekly with TDG (120 mg/kg) or vehicle (PBS). Statistical analysis: *P<0,05; **P<0,005; ***P<0,0005; ****P<0,00005. Graphs show mean ± SEM. Scale bars: 20 μm (B, D, L, R); 50 μm (P). DAPI, 49,6-diamidino-2-phenylindole; TDG, thiodigalactoside.
Figure 5
Figure 5. PDPN-mediated adhesion of PoEMs to LECs promotes lymphatic growth and cancer cell lymphoinvasion
(A-B) Quantification (A) and representative images (B) of WT or Pdpn KO BMDMs stained for activated form of integrin β1 (9EG7) upon 40’ treatment with recombinant murine GAL8 (0,5 μM) or normal medium (ctrl). (C-D) Representative images (C) and quantification (D) of the proximity ligation assay (PLA) between PDPN and integrin β1 on the surface of WT or Pdpn KO BMDMs. BMDMs were treated for 40’ with recombinant murine GAL8 (0,5 μM) or normal medium (unstimulated) prior to the assay. (E-F) Representative images (E) and quantification (F) of WT or Pdpn KO Calcein-labelled BMDMs adhering to preformed lymphatic capillary-like structures (HMVECs). Prior to the assay, BMDMs were incubated for 20’ with an integrin β1-blocking antibody (HMβ1-1) or with an isotype control. (G) Quantification of Pdpn WT or Pdpn KO BMDM migration through 8 μm pores (Transwell) in response to murine recombinant GAL8 (0,5 μM). Prior to the migration, BMDMs were incubated for 20’ with an integrin β1 blocking antibody (HMβ1-1) or with an isotype control. (H-J) Quantifications of the number of sprouts (H), total sprout length (I) and representative images (J) LEC (HMVEC) spheroids embedded in collagen 1 with different sorted BMDM populations (or alone) for 24 h. (K-L) Quantification (K) and representative images (L) of intercellular gaps between HMVECs cultured in monolayers for 5 days and incubated together with different populations of sorted, Calcein-labelled BMDMs for 16 h. The co-cultures were fixed and stained for VE-CADHERIN, enabling the visualization of cell-cell junctions. (M) Quantification of Calcein-labelled 4T1 cancer cell migration through LEC monolayers (seeded on 8 μm pore-Transwells) incubated for 16 h with different populations of sorted BMDMs. Prior to the assay, BMDMs were incubated for 20’ with an integrin β1 blocking antibody (HMβ1-1) or with an isotype control. (N-O) Quantification (N) and representative 3D reconstructions (O) of confocal images of 4T1-GFP+ tumor sections stained for LYVE1, F4/80 and GFP. White arrows demonstrate the presence of TAMs-LVs-4T1 cancer cells triads. The numbers of triads were normalized per LYVE1+ lymphatic vessel area. The average number of triads per tumor and total lymphatic vessel area are shown in Figure S6T-S6U. Statistical analysis: *P<0,05; **P<0,005; ***P<0,0005; ****P<0,00005. Graphs show mean ± SEM. Scale bars: 20 μm (B, C, E, L); 40 μm (O). DAPI, 49,6-diamidino-2-phenylindole; PoEMs, Podoplanin-expressing macrophages; non-PoEMs, Podoplanin-negative macrophages.
Figure 6
Figure 6. PDPN in PoEMs is the upstream regulator of matrix remodeling, independent of GAL8 binding
(A-M) qRT-PCR analysis of the expression of Mmps and collagen subunits in CD11b+, F4/80+ TAM populations sorted from 4T1 tumors: PoEMs (PDPN+), non-PoEMs (PDPN-), total WT TAM pool and total Pdpn KO TAM pool (PDPN-). (N-P) qRT-PCR analysis of the expression of different vascular endothelial growth factors in CD11b+, F4/80+ TAM populations sorted from 4T1 tumors: PoEMs (PDPN+), non-PoEMs (PDPN-), total WT TAM pool and total Pdpn KO TAM pool (PDPN-). (Q-R) Representative images (Q) and quantifications (R) of Collagen I deposition (on decellularized matrix) by sorted 4T1 TAMs cultured ex vivo for 72 h, as assessed by IF. (S-T) Representative images (S) and quantifications (T) of Collagen I deposition around VEGFR3+ lymphatics in 4T1 tumors. The collagen I+ areas were normalized per VEGFR3+ LV area in each field. (U) Quantification of collagen I digestion by different 4T1 TAM populations cultured ex vivo for 72h, as assed by ELISA recognizing CTX-1 peptide in culture supernatants. The CTX-1 antigen concentrations were normalized vs. the mean concentration detected in the WT pool group. CTX-1, type I collagen cross-linked C-telopeptide. (V) Quantification of gelatin digestion by different 4T1 TAM populations cultured ex vivo for 72h, as assessed spectrophotometrically with the use of direct quenched (DQ), fluorescein-labelled gelatin. The presence of green fluorescence (indicating proteolytic digestion) was assessed in culture supernatants at 485 nm. (W-X) Representative images (W) and quantifications (X) of the MMP12+ areas around VEGFR3+ LVs in 4T1 tumors. (Y-Z) Quantification of VEGFC (Y) and VEGFD (Z) produced by 4T1 TAMs cultured ex vivo for 72 h on gelatin, as assessed by ELISA. The data are shown as the ratios of VEGFC or VEGFD concentrations in supernatants (soluble) vs. in gelatin (matrix-bound). VEGFC, vascular endothelial growth factor C; VEGFD, vascular endothelial growth factor D. Statistical analysis: *P<0,05; **P<0,005; ***P<0,0005; ****P<0,00005. Graphs show mean ± SEM. Scale bars: 20 μm (Q, T, X). IF, immunofluorescence; PoEMs, Podoplanin-expressing macrophages; non-PoEMs, Podoplanin-negative macrophages; DAPI, 49,6-diamidino-2-phenylindole.
Figure 7
Figure 7. Potential clinical relevance of PoEMs in breast cancer patients.
(A) FACS analysis of PDPN in human breast cancer macrophages (CD11b+, CD14+, HLA-DR+), representing the fraction of PoEMs out of total TAMs. (B) Quantification of PDPN+ cells (IF) among CD11b+, CD14+, HLA-DR+ TAMs (sorted from human breast tumor specimens) that have migrated through 8 μm pores (Transwell) towards murine recombinant GAL8 (0,5 μM). (C) Quantification of the migration of human monocyte-derived macrophages (CD11b+, CD14+) through 8 μm pores (Transwell) in response to soluble factors released by HMVECs. LECs were silenced (siLgals8) or not (scrl) for Lgals8, a gene encoding GAL8. scrl, scrambled control. (D-G) IF analysis of CD68+, PDPN+ TAMs interacting with PDPN+ LVs in paraffin-embedded human breast cancer samples obtained from patients with bilateral tumors, where N0 indicates lack and N+ presence of lymph node metastasis (D-F). In N+ positive tumors, the number of CD68+, PDPN+ TAMs interacting with PDPN+ LVs was subsequently correlated with the presence of distant organ metastasis (G). (H) In breast cancer, PDPN-expressing macrophages (PoEMs) represent 30% of the entire TAM population. Due to the highest expression of galectin 8 (GAL8) by the lymphatic vessels, PoEMs selectively migrate and interact with the lymphatic endothelium by means of PDPN expression. Binding of GAL8 to PDPN unleashes the clustering and activation of integrin β1, which is required for the chemotactic attraction and adhesion of PoEMs to lymphatic walls. Once there, PoEMs favor lymphangiogenesis via matrix remodeling and growth factors release. Next, they assist the intravasation of cancer cells into the lymphatic circulation, directly promoting tumor metastasis. Targeting PDPN on macrophages or GAL8 on the lymphatics efficiently impairs this cascade. Statistical analysis: *P<0,05; **P<0,005; ***P<0,0005. Graphs show mean ± SEM. Scale bar: 20 μm (F). PoEMs, Podoplanin-expressing macrophages; IF, immunofluorescence; N0, lymph node-negative; N+, lymph node-positive; P, patient; scrl, scrambled control.

References

    1. Acton SE, Astarita JL, Malhotra D, Lukacs-Kornek V, Franz B, Hess PR, Jakus Z, Kuligowski M, Fletcher AL, Elpek KG, et al. Podoplanin-rich stromal networks induce dendritic cell motility via activation of the C-type lectin receptor CLEC-2. Immunity. 2012;37:276–289. doi: 10.1016/j.immuni.2012.05.022. - DOI - PMC - PubMed
    1. Astarita JL, Acton SE, Turley SJ. Podoplanin: emerging functions in development, the immune system, and cancer. Front Immunol. 2012;3:283. doi: 10.3389/fimmu.2012.00283. - DOI - PMC - PubMed
    1. Ayoub JP, Verma S, Verma S. Advances in the management of metastatic breast cancer: options beyond first-line chemotherapy. Curr Oncol. 2012;19:91–105. doi: 10.3747/co.19.1024. - DOI - PMC - PubMed
    1. Barcus CE, O’Leary KA, Brockman JL, Rugowski DE, Liu Y, Garcia N, Yu M, Keely PJ, Eliceiri KW, Schuler LA. Elevated collagen-I augments tumor progressive signals, intravasation and metastasis of prolactin-induced estrogen receptor alpha positive mammary tumor cells. Breast Cancer Res. 2017;19:9. doi: 10.1186/s13058-017-0801-1. - DOI - PMC - PubMed
    1. Bergers G, Brekken R, McMahon G, Vu TH, Itoh T, Tamaki K, Tanzawa K, Thorpe P, Itohara S, Werb Z, et al. Matrix metalloproteinase-9 triggers the angiogenic switch during carcinogenesis. Nat Cell Biol. 2000;2:737–744. doi: 10.1038/35036374. - DOI - PMC - PubMed

MeSH terms