. 2019 Aug 6:10:1726.
doi: 10.3389/fmicb.2019.01726. eCollection 2019.

Diversity, Distribution and Co-occurrence Patterns of Bacterial Communities in a Karst Cave System

Affiliations

Diversity, Distribution and Co-occurrence Patterns of Bacterial Communities in a Karst Cave System

Hai-Zhen Zhu et al. Front Microbiol. .

Abstract

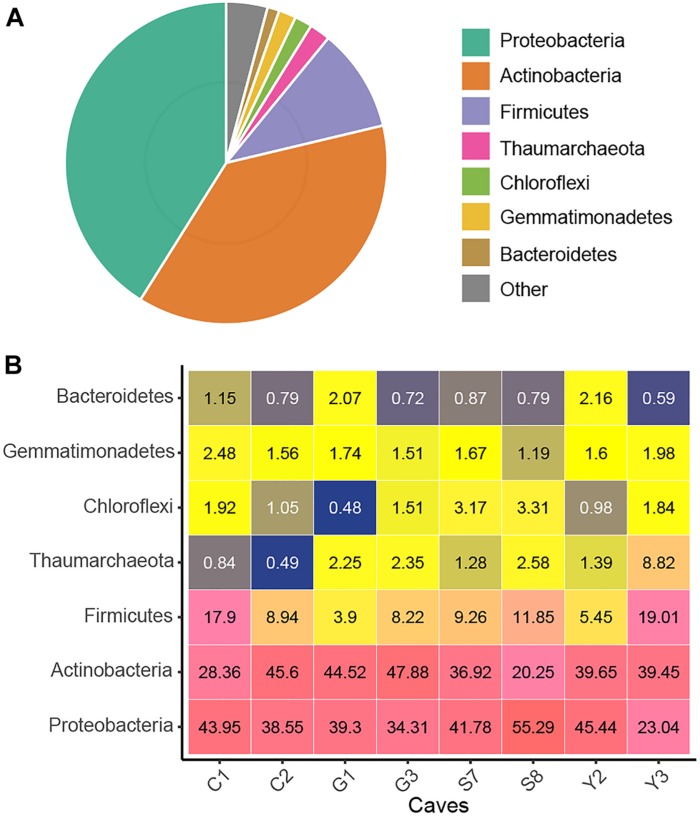
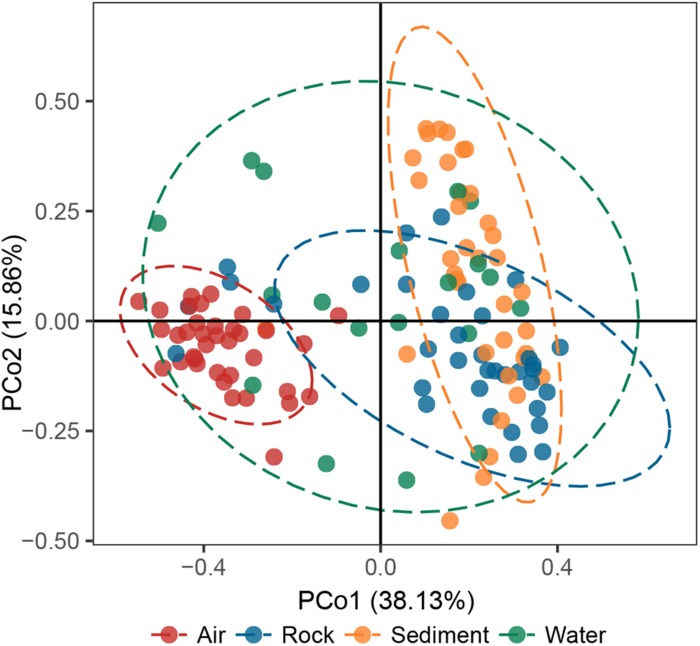
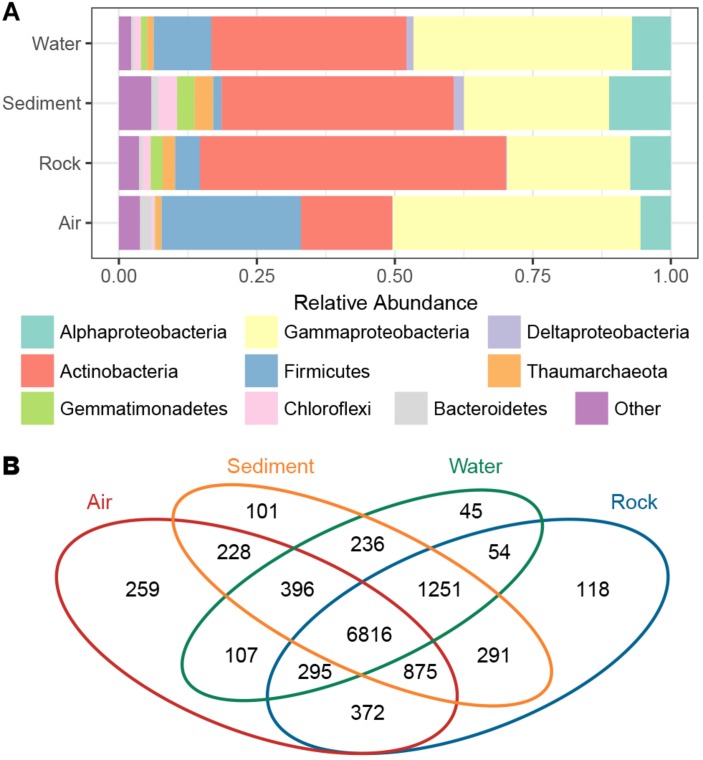
Caves are typified by their permanent darkness and a shortage of nutrients. Consequently, bacteria play an important role in sustaining such subsurface ecosystems by dominating primary production and fueling biogeochemical cycles. China has one of the world's largest areas of karst topography in the Yunnan-Guizhou Plateau, yet the bacteriomes in these karst caves remain unexplored. In this study, bacteriomes of eight karst caves in southwest China were examined, and co-occurrence networks of cave bacterial communities were constructed. Results revealed abundant and diversified bacterial communities in karst caves, with Proteobacteria, Actinobacteria, and Firmicutes being the most abundant phyla. Statistical analysis revealed no significant difference in bacteriomes among the eight caves. However, a PCoA plot did show that the bacterial communities of 128 cave samples clustered into groups corresponding to sampling types (air, water, rock, and sediment). These results suggest that the distribution of bacterial communities is driven more by sample types than the separate caves from which samples were collected. Further community-level composition analysis indicated that Proteobacteria were most dominant in water and air samples, while Actinobacteria dominated the sediment and rock samples. Co-occurrence analysis revealed highly modularized assembly patterns of the cave bacterial community, with Nitrosococcaceae wb1-P19, an uncultured group in Rokubacteriales, and an uncultured group in Gaiellales, being the top-three keystone members. These results not only expand our understanding of cave bacteriomes but also inspires functional exploration of bacterial strains in karst caves.

Keywords: bacterial diversity; bacteriomes; co-occurrence pattern; community composition and abundance; karst cave.


Figures

FIGURE 1
FIGURE 1
Taxonomic composition of the karst cave bacterial community. Pie chart showing the average relative abundances of all detected phylum in the whole dataset (A). Heatmap showing the average relative abundances (%) of the major cave bacterial phyla in each sampled cave (B); the number within each box represents the median abundance of the taxa in a given cave, taxa with low abundance are colored blue, those in higher abundance are yellow, while the highest are in pink.
FIGURE 2
FIGURE 2
Principal coordinates analysis (PCoA) ordination of variation based on weighted UniFrac dissimilarity. The dotted lines indicate the 95% confidence intervals grouped by cave niche.
FIGURE 3
FIGURE 3
The proportion of bacterial phyla/subphyla in the four cave niches (A). Venn diagram of the exclusive and shared OTUs found among the different cave niches (B).
FIGURE 4
FIGURE 4
Comparison of OTUs’ distribution between air samples and other samples (niches) from caves. CPM is counts per million, the dashed line is the 95% confidence level. Solid upward triangles are OTUs significantly enriched in air samples, hollow downward triangles are OTUs significantly depleted in air samples, solid points are those OTUs significantly unchanged in air samples compared with other types of samples. The size of triangles and points are proportional to the abundance of that OTU.
FIGURE 5
FIGURE 5
Indicator genera of different cave niches based on an IndVal analysis. Genera with an indicator value >0.6 and p < 0.05 were identified as indicators.
FIGURE 6
FIGURE 6
Network of co-occurring bacterial genera based on a correlation analysis for the cave environment. A connection denotes a strong (Spearman’s ρ > 0.6) and significant (p < 0.01) correlation. The nodes in network (A) are colored according to phylum, while the nodes in network (B) are colored with respect to modularity class. Node size is proportional to the betweenness centrality of each genus, and edge thickness is proportional to the weight of each correlation.

References

    1. Adam D., Maciejewska M., Naome A., Martinet L., Coppieters W., Karim L., et al. (2018). Isolation, characterization, and antibacterial activity of hard-to-culture Actinobacteria from cave moonmilk deposits. Antibiotics 7:28. 10.3390/antibiotics7020028 - DOI - PMC - PubMed
    1. Adetutu E. M., Krystal T., Esamaeil S., Steven B. (2012). Bacterial community survey of sediments at Naracoorte Caves, Australia. Int. J. Speleol. 41 137–147. 10.5038/1827-806X.41.2.2 - DOI
    1. Alonso L., Creuze-des-Chatelliers C., Trabac T., Dubost A., Moenne-Loccoz Y., Pommier T. (2018). Rock substrate rather than black stain alterations drives microbial community structure in the passage of Lascaux Cave. Microbiome 6:216. 10.1186/s40168-018-0599-9 - DOI - PMC - PubMed
    1. Axenovgibanov D. V., Voytsekhovskaya I. V., Tokovenko B. T., Protasov E. S., Gamaiunov S. V., Rebets Y. V., et al. (2016). Actinobacteria isolated from an underground lake and moonmilk speleothem from the biggest conglomeratic karstic cave in Siberia as sources of novel biologically active compounds. PloS One 11:e0149216. 10.1371/journal.pone.0149216 - DOI - PMC - PubMed
    1. Barberán A., Bates S. T., Casamayor E. O., Fierer N. (2011). Using network analysis to explore co-occurrence patterns in soil microbial communities. ISME J. 6 343–351. 10.1038/ismej.2011.119 - DOI - PMC - PubMed

LinkOut - more resources