. 2019 Aug 7:10:999.
doi: 10.3389/fpls.2019.00999. eCollection 2019.

Architectural Response of Wheat Cultivars to Row Spacing Reveals Altered Perception of Plant Density

Affiliations

Architectural Response of Wheat Cultivars to Row Spacing Reveals Altered Perception of Plant Density

Mariem Abichou et al. Front Plant Sci. .

Abstract

Achieving novel improvements in crop management may require changing interrow distance in cultivated fields. Such changes would benefit from a better understanding of plant responses to the spatial heterogeneity in their environment. Our work investigates the architectural plasticity of wheat plants in response to increasing row spacing and evaluates the hypothesis of a foraging behavior in response to neighboring plants. A field experiment was conducted with five commercial winter wheat cultivars possessing unique architectures, grown under narrow (NI, 17.5 cm) or wide interrows (WI, 35 cm) at the same population density (170 seeds/m2). We characterized the development (leaf emergence, tillering), the morphology (dimension of organs, leaf area index), and the geometry (ground cover, leaf angle, organ spreading, and orientation). All cultivars showed a lower number of emerged tillers in WI compared to NI, which was later partly compensated by lower tiller mortality. Besides, the upper leaf blades were larger in WI. Finally the leaf area index at flowering showed little difference between WI and NI treatments. The rate of leaf emergence and the final leaf number were higher in WI compared to NI, except for one cultivar. Around the start of stem elongation, pseudo-stems were more erect in WI, while around the time of flowering, stems were more inclined and leaves were more planophile. Cultivars differed in their degrees of responses, with one appearing to prospect more specifically within the interrow space in WI treatment. Altogether, our results suggest that altering interrow distance leads to changes in the perceived extent of competition by plants, with responses first mimicking the effect of a higher plant density and later the effect of a lower plant density. Only one cultivar showed responses that suggested a perception of the heterogeneity of the environment. These findings improve our understanding of plant responses to spatial heterogeneity and provide novel information to simulate light capture in plant 3D models, depending on cultivar behavior.

Keywords: architectural response; leaf angle; plasticity; row spacing effect; space prospection; stem angle; tillering; wheat.


Figures

FIGURE 1
FIGURE 1
Scheme illustrating the plant architectural traits analyzed (A, side view; B, top view). The analyzed traits depended on the plant axis. For both main stems and tillers we analyzed: (i) the horizontal spread of the axis “j,” which represents the horizontal distance between the higher leaf collar on the axis and the plant base (dstem(j)); (ii) the horizontal spread of the leaf rank at rank “i” on the axis “j,” which represents the horizontal distance between the tip of the leaf and the plant base (dleaf(ij)); (iii) the azimuth angle of the leaf at rank “i” on the axis “j” which represents the angle between the projection of the midrib on the horizontal plane and the row direction (θleaf(ij)); and (iv) the azimuth angle of the stem or pseudo-stem of the axis “j,” which represents the angle between the projection of the stem or pseudo-stem on the horizontal plane and the row direction (θstem(j)). Additionally, the following traits were analyzed for the main stems only: (i) the final blade length of the leaf at rank “i”(lblade(i)); (ii) the mature blade area of the leaf at rank “i” (ablade(i)); (iii) the length between the collar of the leaf at rank “i” and the plant base (lcol(i)); and (vi) the angle of insertion of the leaf at rank “i,” which represents the basal angle between the blade midrib and the bearing axis (ileaf(i)).
FIGURE 2
FIGURE 2
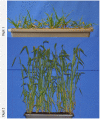
Photographs of segments of rows analyzed. Rows were collected from the field at 722°Cd (top) and 1272°Cd (bottom) and transplanted in pots to be digitalized in the laboratory. The treatment shown here is Renan-NI.
FIGURE 3
FIGURE 3
The number of axes per plant (A), the vertical ground cover GC(0°) (B), and the green plant area index PAIg (C), in WI treatments vs. NI treatments. Each color is associated with a cultivar, as indicated in the legend. Error bars represent the 95% confidence intervals of mean estimates and the dotted line represents the line 1:1. In (A), each symbol represents the mean value of the number of axes measured for 20–30 plants per treatment. Empty symbols are for end of tillering (∼870°Cd) and full symbols are for flowering. In (B), each symbol shows the mean value of GC(0) from analyzing six photographs covering each an area of 0.73 m2. Empty symbols represent measurements at 682°Cd (LS = 5.6) and full symbols represent measurements at 1565°Cd (after flag ligulation). In (C), circles show the PAIg estimated from oblique photographs: estimates at early stages are shown with empty circles (520°Cd, 532°Cd, 657°Cd, and 683°Cd) and estimates at later stages are shown with full circles (952°Cd, 1222°Cd, and 1555°Cd). Each circle shows the mean of values calculated from analyzing three photographs covering each area of 2.03 m2. Triangles represent the PAIg measured at flowering (1575°Cd) from scans of leaves and stems.
FIGURE 4
FIGURE 4
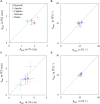
The rate of leaf emergence and the final leaf number of the main stem in WI treatments vs. NI treatments. Each color is associated with a cultivar, as indicated in the legend. The value of the rate of leaf emergence (A) was estimated from a linear model adjusted on the mean estimates of leaf stage. The data for final leaf number (B) are the mean values measured on 10 tagged plants, with error bars representing 95% confidence intervals of mean estimates. The dotted line represents the line 1:1.
FIGURE 5
FIGURE 5
Length of the main stem in WI treatments vs. NI treatments at the start of stem extension (870°Cd). (A) shows lcol(1), which represents the length from the base of the plant up to the highest collar and figure (B) shows lapex, the length from the base of plant to the summit of the apex. Each symbol represents the mean of values measured on 30 stems. Each color is associated with a cultivar, as indicated in the legend. Error bars represent 95% confidence intervals of mean estimates. The dotted line represents the line 1:1.
FIGURE 6
FIGURE 6
The cumulative area of the four upper blades of the main stem (A) and the mean leaf inclination angle α (B) in WI treatments vs. NI treatments. Each color is associated with a cultivar, as indicated in the legend. The dotted line represents the line 1:1. In (A), symbols represent the mean of values measured on 45 plants per treatment; error bars mark the 95% confidence intervals of the mean estimates. In (B), empty symbols represent measurements at the start of stem extension (722°Cd) while full symbols represent measurements close to ear emergence (1272°Cd); error bars mark the quarter of standard deviation of mean estimates of all triangles representing leaves (to make the figure easier to read).
FIGURE 7
FIGURE 7
The insertion angle (ileaf) averaged over the four upper leaves of the main stem vs. the thermal time from plant emergence. Each symbol represents the mean of values measured on 30 plants. Squares and solid lines represent the WI treatment, while triangles and dotted lines represent the NI treatment. Only leaf blades, having at least 20% green area, were taken into account. Error bars mark 95% confidence intervals of the mean estimates. The arrow indicates the second date of digitalization (1272°Cd), which is close to ear emergence date.
FIGURE 8
FIGURE 8
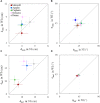
Horizontal spacing and azimuth orientation of stems and leaves in WI treatments vs. NI treatments, at 722°Cd. The stem spread (dstem; A), leaf spread (dleaf; C), stem azimuth angle (θstem; B), and leaf azimuth angle (θleaf; D). Symbols represent the mean values taking into account all axes, for 30–60 plants per treatment. Error bars represent 95% confidence intervals of the mean estimates. The dotted line represents the line 1:1.
FIGURE 9
FIGURE 9
Horizontal spacing and azimuth orientation of stems and leaves in WI treatments vs. NI treatments, at 1272°Cd. The stem spread (dstem; A), leaf spread (dleaf; C), stem azimuth angle (θstem; B), and leaf azimuth angle (θleaf; D). Symbols represent the mean values taking into account only well-developed axes, with hcol(1) > 10 cm, for 30–60 plants per treatment. Error bars represent 95% confidence intervals of the mean estimates. The dotted line represents the line 1:1.

References

    1. Abichou M., Dornbusch T., Chambon C., Gouache D., de Solan B., Andrieu B. (2018). Parametrizing wheat leaf and tiller dynamics for structural plant models. Field Crop Res. 218 213–230. 10.1016/j.fcr.2018.01.010 - DOI
    1. Adam B., Sinoquet H., Godin C., Donès N. (1999). 3A–Software for The Acquisition of Plant Architecture. Clermont-Ferrand: INRA.
    1. Alzueta I., Abeledo L. G., Mignone C. M., Miralles D. J. (2012). Differences between wheat and barley in leaf and tillering coordination under contrasting nitrogen and sulfur conditions. Eur. J. Agron. 41 92–102. 10.1016/j.eja.2012.04.002 - DOI
    1. Araus J. L., Reynolds M. P., Acevedo E. (1993). Leaf posture, grain-yield, growth, leaf structure, and carbon-isotope discrimination in wheat. Crop Sci. 33 1273–1279. 10.2135/cropsci1993.0011183X003300060032x - DOI
    1. Baccar R. (2011). Plasticity of Winter WHEAT ARCHItecture Modulated by Sowing Date and Plant Population DENsity and Its Effect on Septoria Tritici Epidemics. Ph.D. thesis, University AgroParisTech, Paris.

LinkOut - more resources