

Dominant role of the α-chain in rejection of tumor cells bearing a specific alloantigen in TCRα transgenic mice and in in vitro experiments
- PMID: 31448049
- PMCID: PMC6690675
- DOI: 10.18632/oncotarget.27093
Dominant role of the α-chain in rejection of tumor cells bearing a specific alloantigen in TCRα transgenic mice and in in vitro experiments
Abstract
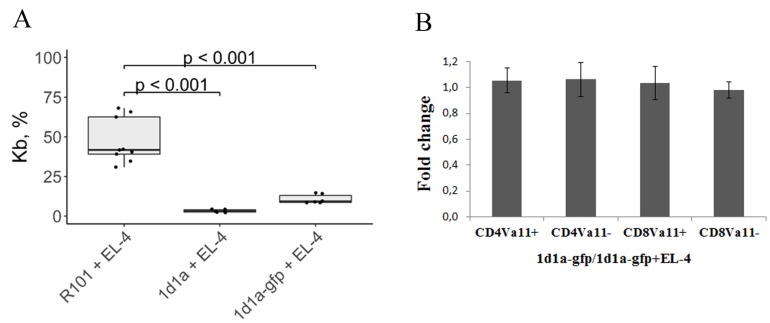
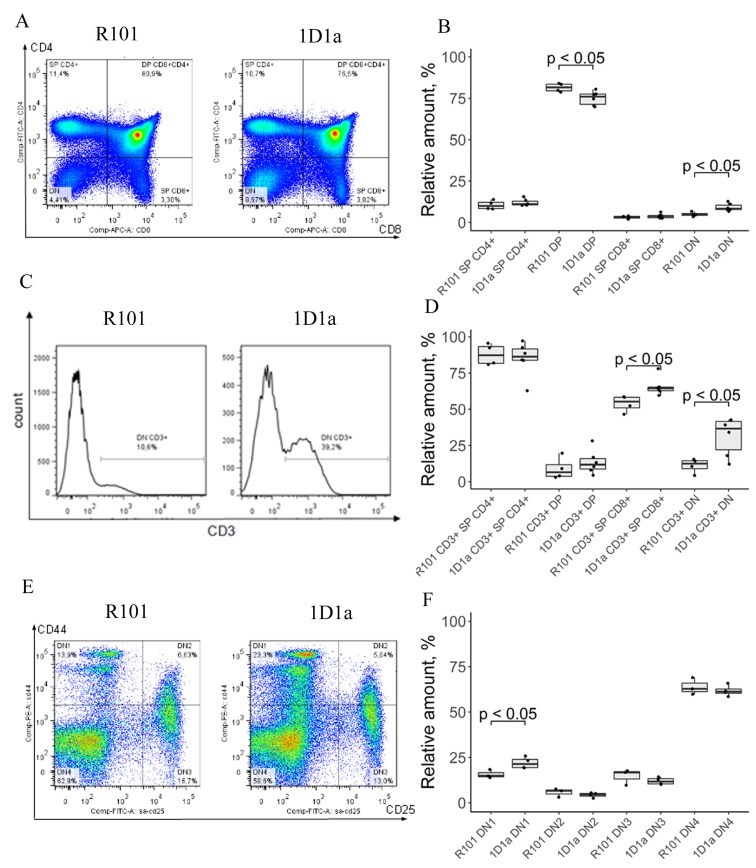
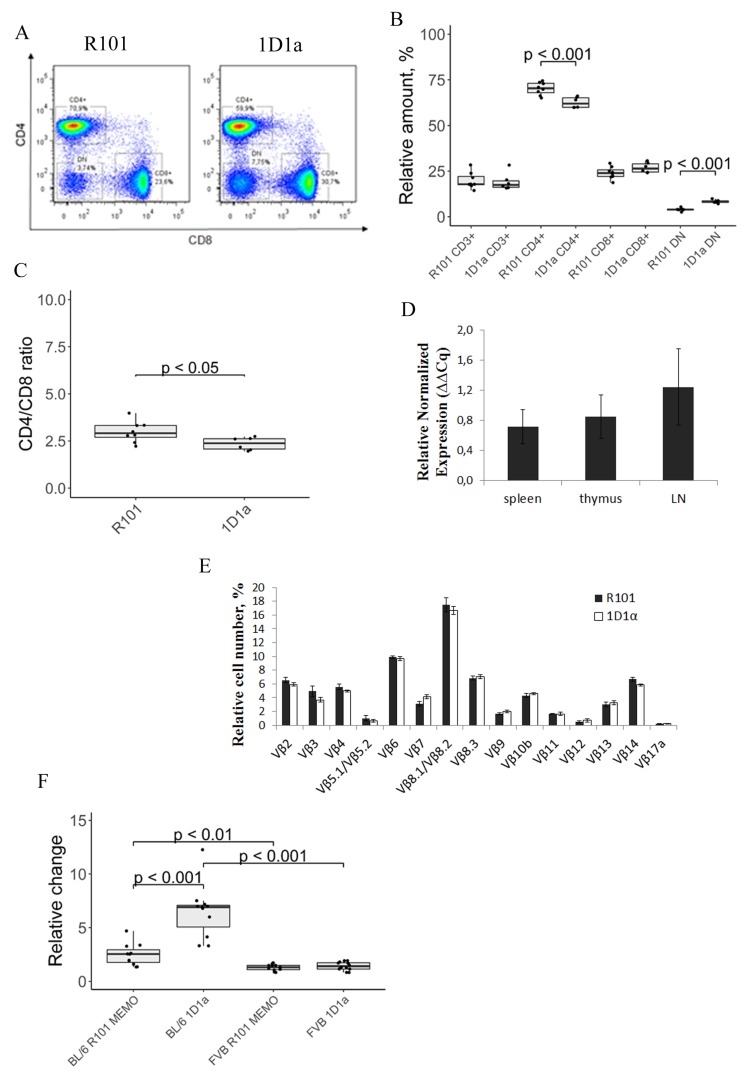
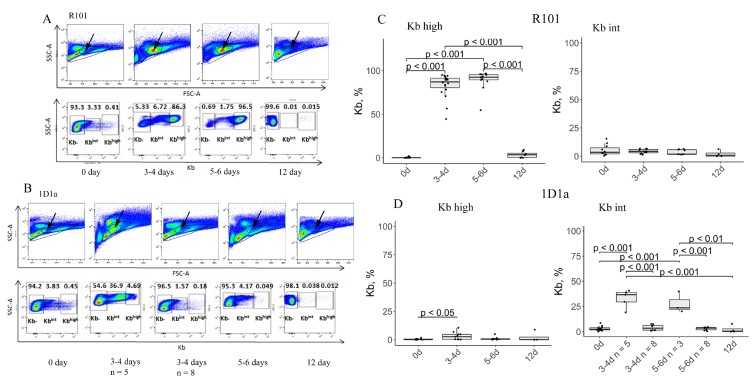
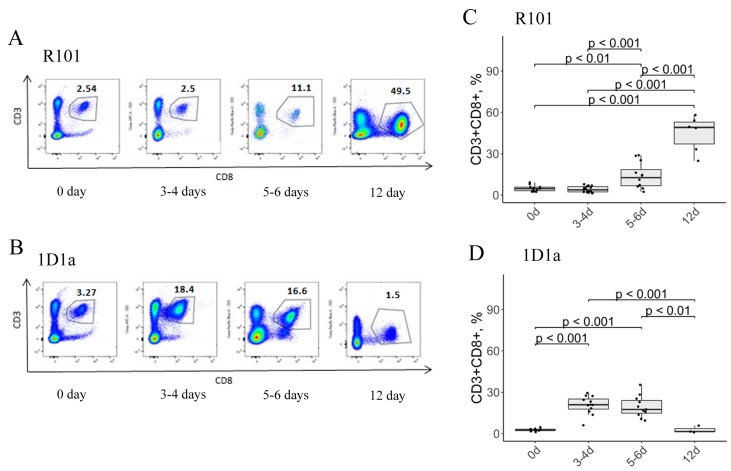
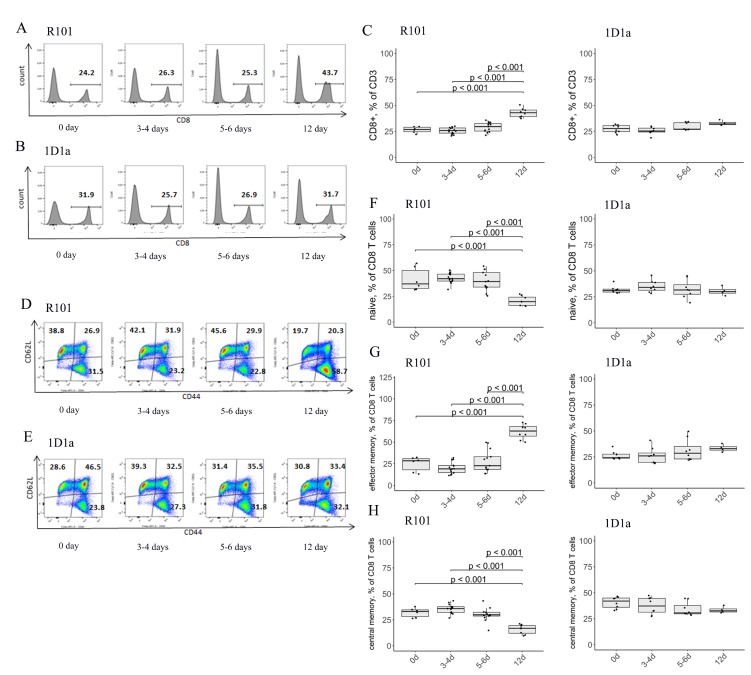
Both TCRα and TCRβ types of T-cell receptors contribute to antigen recognition. However, some TCRs have chain centricity, which means that either the α-chain or the β-chain dictates the peptide-MHC complex specificity. Most earlier reports investigated the role of well-studied β-chains in antigen recognition by TCRαβ. In a previous study, we identified TCRs specific to the H-2Kb molecule. In the present work, we generated transgenic mice carrying the α-chain of this TCR. We found that these transgenic mice rejected EL-4 tumor cells bearing alloantigen H-2Kb more effectively than wild-type mice and similarly to mice with established specific memory T cells. Moreover, we found that T cells transduced with this TCRα can inhibit EL-4 cell growth in vitro and in vivo. We also found that transgenic mice recruit fewer CD8 T cells into the peritoneal cavity at the peak of the immune response and had a significantly higher number of central memory CD8 T cells in the spleen of intact transgenic mice compared to intact wild-type control. These results indicate the ability of a single transgenic α-chain of the H-2Kb-specific TCR to determine specific recognition of the H-2Kb molecule by a repertoire of T lymphocytes and to rapidly reject H-2Kb-bearing lymphoma cells.
Keywords: TCRα; alloantigen; transgenic mice; tumor.
Conflict of interest statement
CONFLICTS OF INTEREST The authors declare no commercial or financial conflicts of interest.
Figures
Similar articles
-
Physiological and Functional Effects of Dominant Active TCRα Expression in Transgenic Mice.Int J Mol Sci. 2023 Mar 30;24(7):6527. doi: 10.3390/ijms24076527. Int J Mol Sci. 2023. PMID: 37047500 Free PMC article.
-
Macrophage MHC and T-cell receptors essential for rejection of allografted skin and lymphoma.Transplantation. 2013 Aug 15;96(3):251-7. doi: 10.1097/TP.0b013e3182985527. Transplantation. 2013. PMID: 23836286
-
Prevalent CD8(+) T cell response against one peptide/MHC complex in autoimmune diabetes.Proc Natl Acad Sci U S A. 1999 Aug 3;96(16):9311-6. doi: 10.1073/pnas.96.16.9311. Proc Natl Acad Sci U S A. 1999. PMID: 10430939 Free PMC article.
-
Thymic repertoire selection by superantigens: presentation by human and mouse MHC molecules.Thymus. 1994;23(1):1-13. Thymus. 1994. PMID: 7863543 Review.
-
MHC class I recognition by monocyte-/macrophage-specific receptors.Adv Immunol. 2014;124:207-47. doi: 10.1016/B978-0-12-800147-9.00007-8. Adv Immunol. 2014. PMID: 25175777 Review.
Cited by
-
Analysis of thymic generation of shared T-cell receptor α repertoire associated with recognition of tumor antigens shows no preference for neoantigens over wild-type antigens.Cancer Med. 2023 Jun;12(12):13486-13496. doi: 10.1002/cam4.6002. Epub 2023 Apr 28. Cancer Med. 2023. PMID: 37114587 Free PMC article.
-
T Cell Receptor Chain Centricity: The Phenomenon and Potential Applications in Cancer Immunotherapy.Int J Mol Sci. 2023 Oct 16;24(20):15211. doi: 10.3390/ijms242015211. Int J Mol Sci. 2023. PMID: 37894892 Free PMC article. Review.
-
Adoptive Immunotherapy Based on Chain-Centric TCRs in Treatment of Infectious Diseases.iScience. 2020 Nov 24;23(12):101854. doi: 10.1016/j.isci.2020.101854. eCollection 2020 Dec 18. iScience. 2020. PMID: 33313494 Free PMC article.
-
Unique features of the TCR repertoire of reactivated memory T cells in the experimental mouse tumor model.Comput Struct Biotechnol J. 2023 May 26;21:3196-3209. doi: 10.1016/j.csbj.2023.05.028. eCollection 2023. Comput Struct Biotechnol J. 2023. PMID: 37333858 Free PMC article.
-
Physiological and Functional Effects of Dominant Active TCRα Expression in Transgenic Mice.Int J Mol Sci. 2023 Mar 30;24(7):6527. doi: 10.3390/ijms24076527. Int J Mol Sci. 2023. PMID: 37047500 Free PMC article.
References
-
- Madi A, Poran A, Shifrut E, Reich-Zeliger S, Greenstein E, Zaretsky I, Arnon T, Laethem FV, Singer A, Lu J, Sun PD, Cohen IR, Friedman N. T cell receptor repertoires of mice and humans are clustered in similarity networks around conserved public CDR3 sequences. eLife. 2017; 6:e22057. 10.7554/eLife.22057. - DOI - PMC - PubMed
LinkOut - more resources
Full Text Sources
Molecular Biology Databases
Research Materials
