. 2019 Aug 6:7:540.
doi: 10.3389/fchem.2019.00540. eCollection 2019.

Accelerated Molecular Dynamics Simulation for Helical Proteins Folding in Explicit Water

Affiliations

Accelerated Molecular Dynamics Simulation for Helical Proteins Folding in Explicit Water

Lili Duan et al. Front Chem. .

Abstract

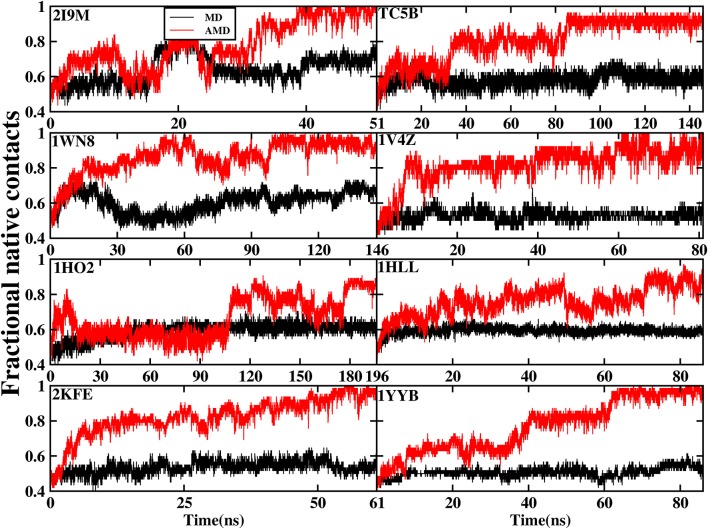
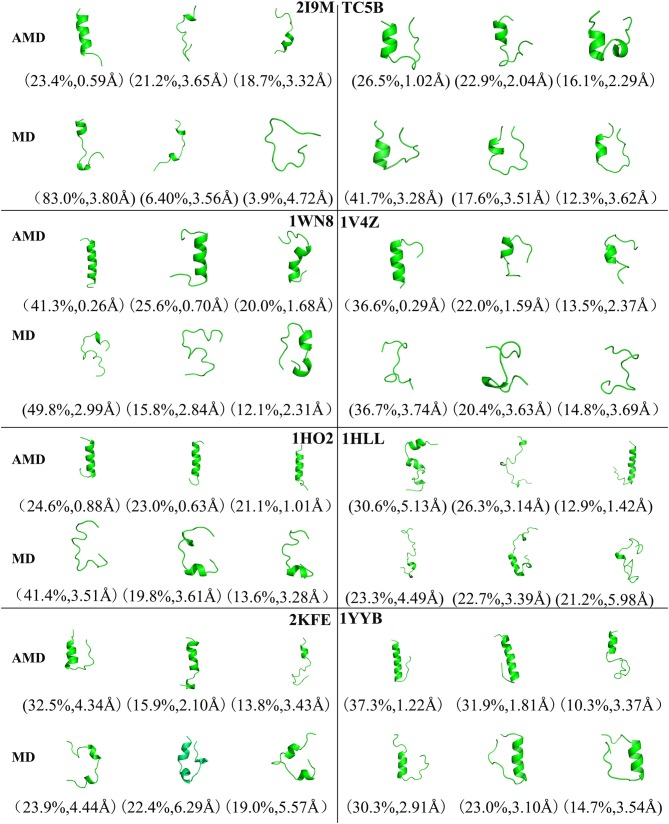
In this study, we examined the folding processes of eight helical proteins (2I9M, TC5B, 1WN8, 1V4Z, 1HO2, 1HLL, 2KFE, and 1YYB) at room temperature using the explicit solvent model under the AMBER14SB force field with the accelerated molecular dynamics (AMD) and traditional molecular dynamics (MD), respectively. We analyzed and compared the simulation results obtained by these two methods based on several aspects, such as root mean square deviation (RMSD), native contacts, cluster analysis, folding snapshots, free energy landscape, and the evolution of the radius of gyration, which showed that these eight proteins were successfully and consistently folded into the corresponding native structures by AMD simulations carried out at room temperature. In addition, the folding occurred in the range of 40~180 ns after starting from the linear structures of the eight proteins at 300 K. By contrast, these stable folding structures were not found when the traditional molecular dynamics (MD) simulation was used. At the same time, the influence of high temperatures (350, 400, and 450 K) is also further investigated. Study found that the simulation efficiency of AMD is higher than that of MD simulations, regardless of the temperature. Of these temperatures, 300 K is the most suitable temperature for protein folding for all systems. To further investigate the efficiency of AMD, another trajectory was simulated for eight proteins with the same linear structure but different random seeds at 300 K. Both AMD trajectories reached the correct folded structures. Our result clearly shows that AMD simulation are a highly efficient and reliable method for the study of protein folding.

Keywords: accelerated molecular dynamics simulation; explicit water; free energy landscape; helical protein; protein folding.


Figures

Figure 1
Figure 1
RMSD of helix structure of 2I9M, TC5B, 1WN8, 1V4Z, 1HO2, 1HLL, 2KFE, and 1YYB simulated by AMD and MD under the explicit solvent model at 300 K.
Figure 2
Figure 2
Folding of 2I9M, TC5B, 1WN8, 1V4Z, 1HO2, 1HLL, 2KFE, and 1YYB simulated by AMD and MD at 300 K: the structures with the lowest RMSD from the simulation of those system. The simulated structure (pink) are overlaid with the native structure (green).
Figure 3
Figure 3
The percentage of native contacts during AMD simulation and MD simulation at 300 K as a function of time for 2I9M, TC5B, 1WN8, 1V4Z, 1HO2, 1HLL, 2KFE, and 1YYB, respectively.
Figure 4
Figure 4
Representative structures of 2I9M, TC5B, 1WN8, 1V4Z, 1HO2, 1HLL, 2KFE, and 1YYB conformations selected from the top three occupied clusters using AMD simulation (top) and MD simulation (low) at 300 K. The population of clusters and the backbone RMSD of the cluster centers are indicated.
Figure 5
Figure 5
The evolution of the eight proteins (A) Snapshots of the intermediate conformation of 2I9M, TC5B, 1WN8, 1V4Z, 1HO2, 1HLL, 2KFE, and 1YYB at various simulation times using AMD simulation at 300 K. (B) Snapshots of the intermediate conformation of 2I9M, TC5B, 1WN8, 1V4Z, 1HO2, 1HLL, 2KFE, and 1YYB at various simulation times using MD simulation at 300 K. Here, the N terminal is always on the top.
Figure 6
Figure 6
The residues of the first formed helix structures of 2I9M, TC5B, 1WN8, 1V4Z, 1HO2, 1HLL, 2KFE, and 1YYB by AMD simulation at 300 K.
Figure 7
Figure 7
Free energy landscape as a function of RMSD and radius of gyration using AMD simulation and MD simulation for 2I9M, TC5B, 1WN8, 2KFE, and 1YYB during all the simulation time at 300 K, respectively. Those representative structures are also shown in the figure. The unit of free energy is kcal/mol.
Figure 8
Figure 8
The radius of gyration (Rg) of the helix structure as a function of simulation time using the AMD simulation (red) and MD simulation (black) at 300 K for 2I9M, TC5B, 1WN8, 2KFE, and 1YYB, respectively. Blue lines denote those experimental values.
Figure 9
Figure 9
Representative structures of 2I9M, TC5B, 1WN8, 1V4Z, 1HO2, 1HLL, 2KFE, and 1YYB conformations selected from the top three occupied clusters using AMD simulation (top) and MD simulation (low) at 350 K. The population of clusters and the backbone RMSD of the cluster centers are indicated.
Figure 10
Figure 10
Representative structures of 2I9M, TC5B, 1WN8, 1V4Z, 1HO2, 1HLL, 2KFE, and 1YYB conformations selected from the top three occupied clusters using AMD simulation (top) and MD simulation (low) at 400 K. The population of clusters and the backbone RMSD of the cluster centers are indicated.
Figure 11
Figure 11
Representative structures of 2I9M, TC5B, 1WN8, 1V4Z, 1HO2, 1HLL, 2KFE, and 1YYB conformations selected from the top three occupied clusters using AMD simulation (top) and MD simulation (low) at 450 K. The population of clusters and the backbone RMSD of the cluster centers are indicated.
Figure 12
Figure 12
RMSD of backbone atoms of 2I9M, TC5B, 1WN8, 1V4Z, 1HO2, 1HLL, 2KFE, and 1YYB as a function of MD simulation time from two MD trajectories. The red curve denotes the trajectory discussed in the current paper and the black curve denotes another trajectory with the same starting structure but different random seed for momentum.

References

    1. Andersen O. J., Risør M. W., Poulsen E. C., Nielsen N. C., Miao Y. L., Enghild J. J., et al. . (2017). Reactive center loop insertion in α-1-Antitrypsin captured by accelerated molecular dynamics simulation. Biochemistry 56, 634–646. 10.1021/acs.biochem.6b00839 - DOI - PubMed
    1. Berg B. A., Neuhaus T. (1992). Multicanonical ensemble: a new approach to simulate first-order phase transitions. Phys. Rev. Lett. 68:9. 10.1103/PhysRevLett.68.9 - DOI - PubMed
    1. Berne B. J., Straub J. E. (1997). Novel methods of sampling phase space in the simulation of biological systems. Curr. Opin. Struct. Biol. 7, 181–189. 10.1016/S0959-440X(97)80023-1 - DOI - PubMed
    1. Bernhardt N. A., Xi W., Wang W., Hansmann U. H. (2016). Simulating protein fold switching by replica exchange with tunneling. J. Chem. Theory Comput. 12, 5656–5666. 10.1021/acs.jctc.6b00826 - DOI - PubMed
    1. Bolhuis P. G., Chandler D., Dellago C., Geissler P. L. (2002). Transition path sampling: throwing ropes over rough mountain passes, in the dark. Annu. Rev. Phys. Chem. 53, 291–318. 10.1146/annurev.physchem.53.082301.113146 - DOI - PubMed