. 2019 Oct;18(19):2432-2446.
doi: 10.1080/15384101.2019.1648956. Epub 2019 Aug 25.

The involvement of FBP1 in prostate cancer cell epithelial mesenchymal transition, invasion and metastasis by regulating the MAPK signaling pathway

Affiliations

The involvement of FBP1 in prostate cancer cell epithelial mesenchymal transition, invasion and metastasis by regulating the MAPK signaling pathway

Yan-Ping Zhang et al. Cell Cycle. 2019 Oct.

Retraction in

Abstract

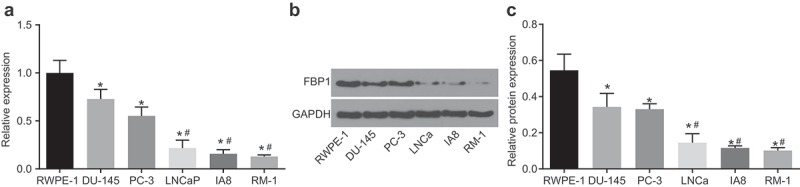
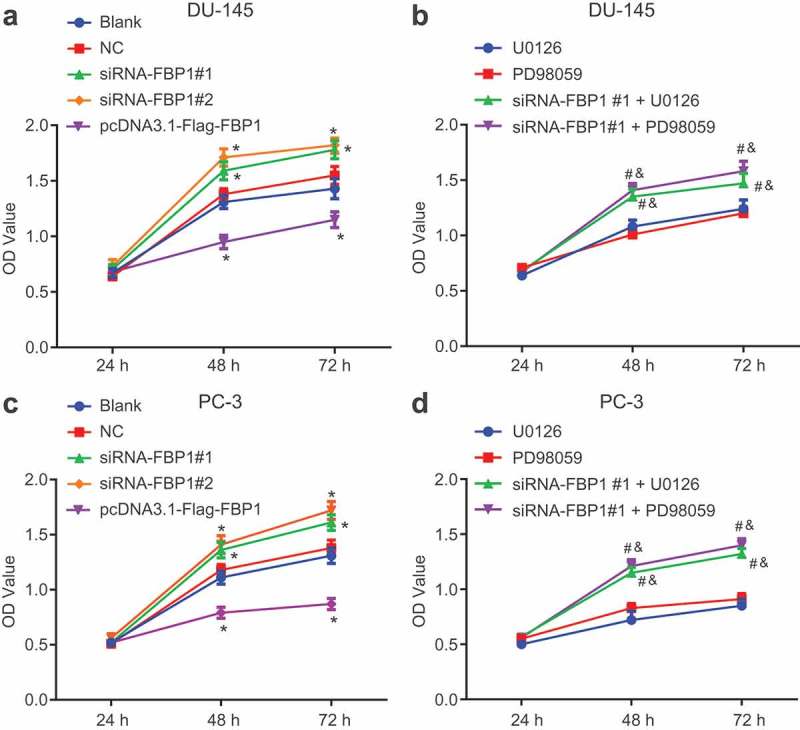
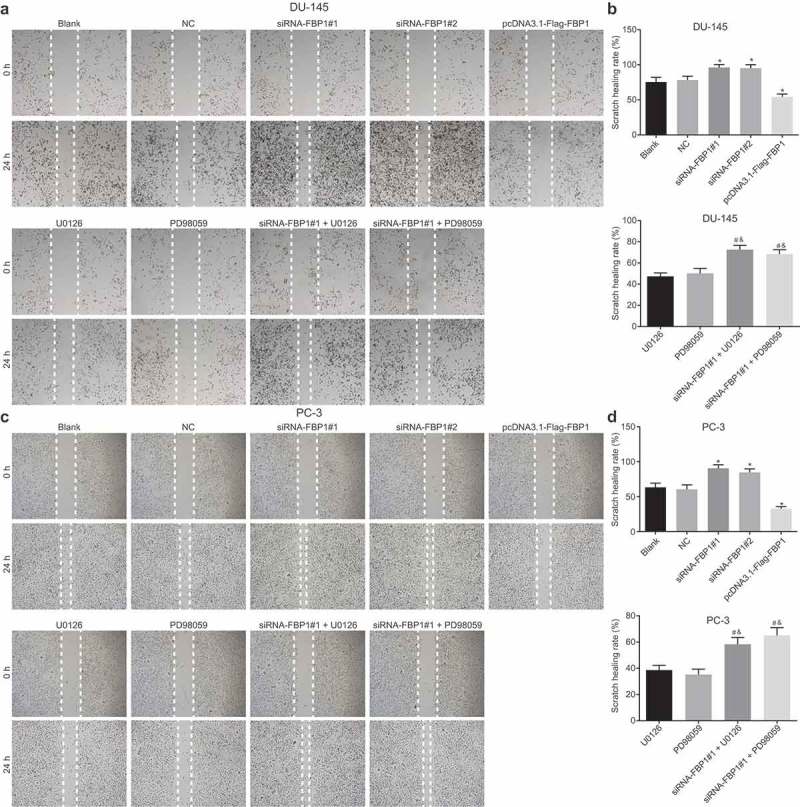
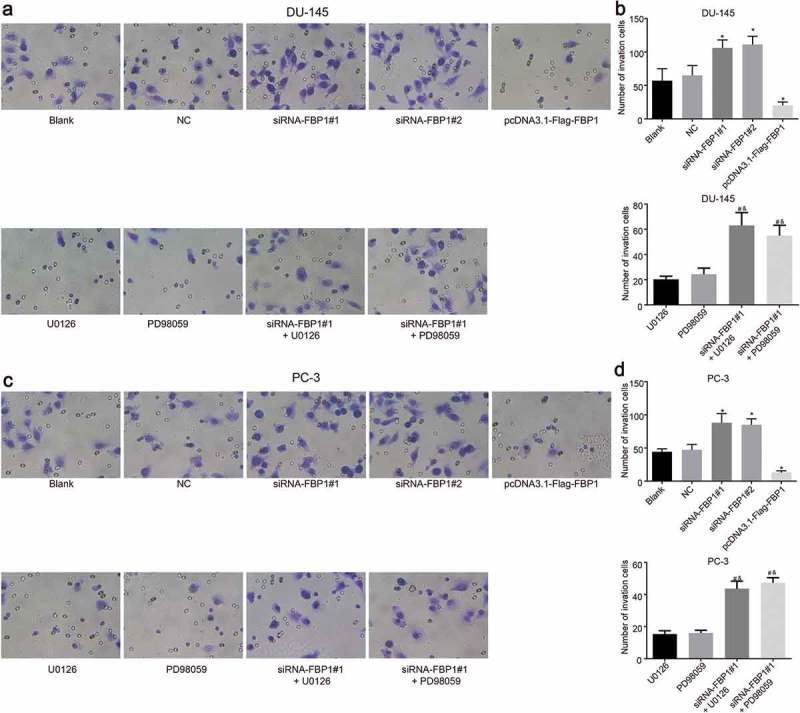
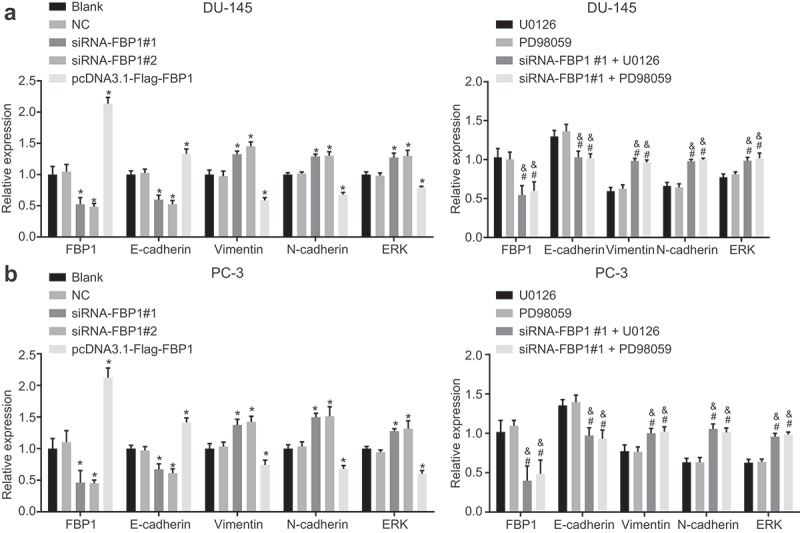
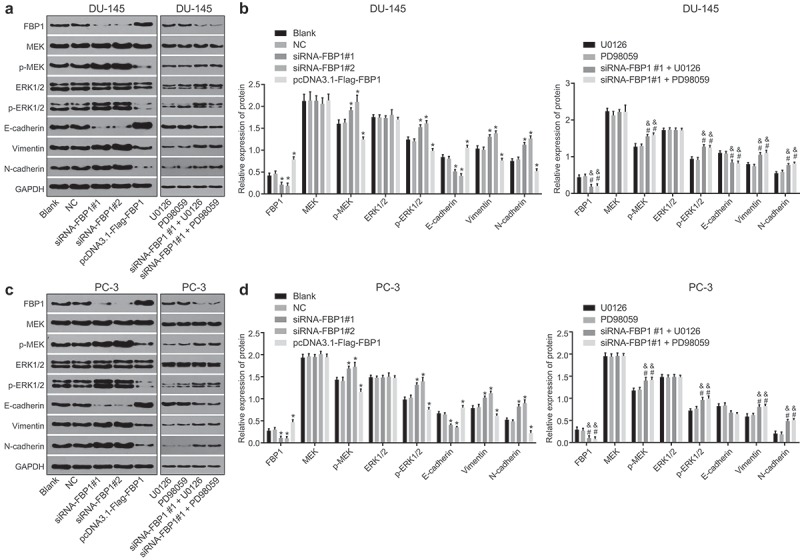
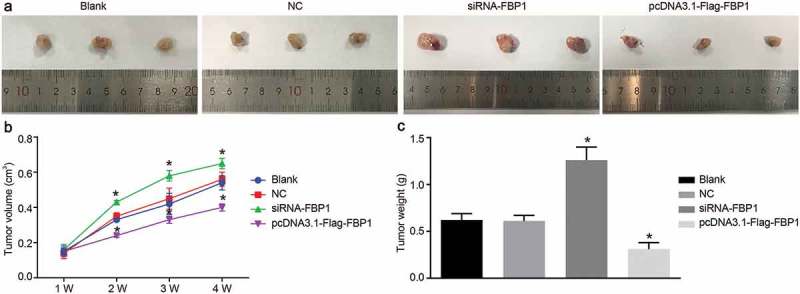
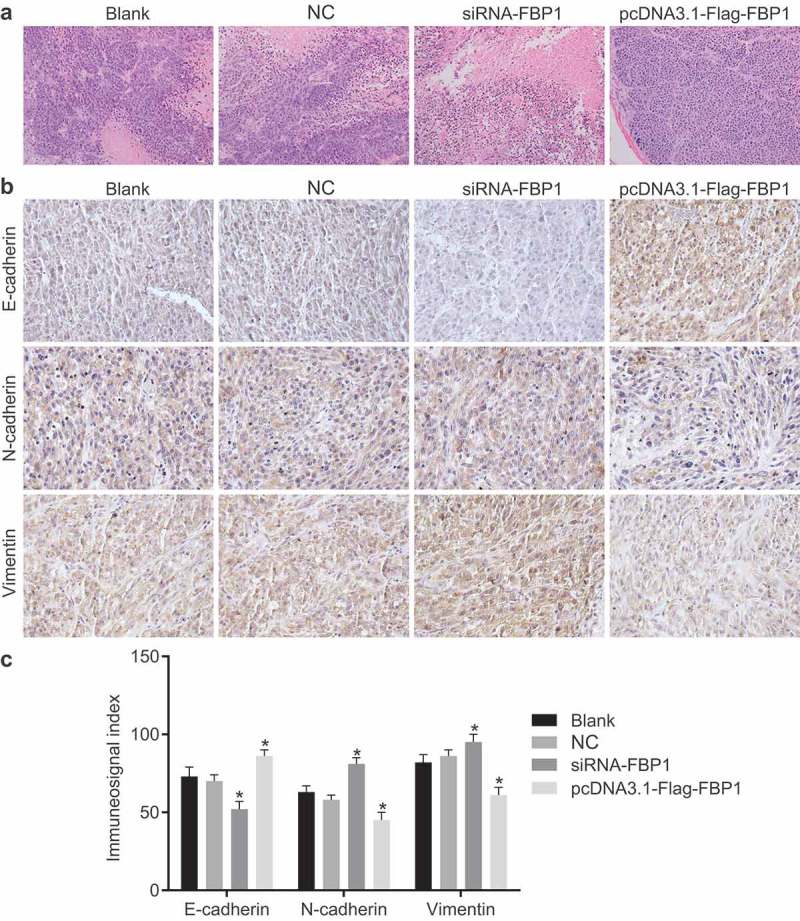
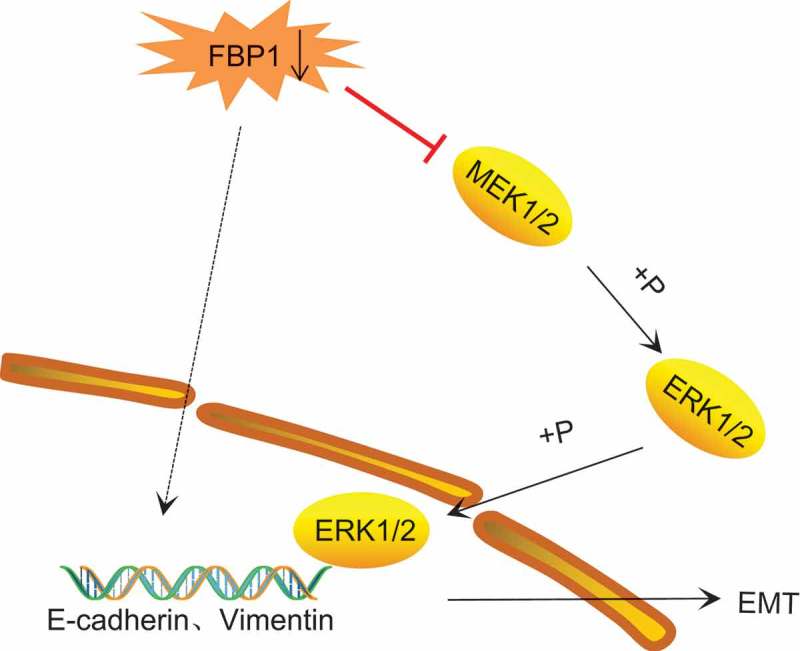
Prostate cancer (PCa) is a frequently occurring malignancy in males, and epithelial mesenchymal transition (EMT) plays a critical role in PCa metastasis. Thus, developing biomarkers inhibiting EMT may provide significance for treatment of PCa. Hence, the aim of the current study was to investigate the mechanism by which FBP1 gene silencing influences PCa cell EMT, invasion and metastasis by mediating the MAPK pathway. PCa cell lines exhibiting the highest FBP1 expression were selected and treated with plasmids of siRNA-FBP1 sequence 1 and 2, pcDNA3.1-Flag-FBP1 (over-expression plasmid of FBP1), U0126 (an inhibitor of the ERK signaling pathway) and PD98059 (an inhibitor of the MEK signaling pathway). Cell proliferation, migration and invasion were detected by MTT assay, wound healing assay and Transwell assay, respectively. The mRNA and protein expression of related factors of EMT and MAPK signaling were determined by RT-qPCR and western blot analysis, respectively. Xenograft tumor growth after inoculation of DU145 cells was regularly analyzed in the nude mice. The positive expression of EMT markers was determined by immunohistochemistry. DU-145 and PC-3 cells displaying the highest FBP1 expression were selected for further analysis. The PCa cells treated with siRNA-FBP1 exhibited increased proliferation, migration rate and invasion, in addition to facilitated xenograft tumor growth. Notably, siRNA-FBP1 was identified to accelerate PCa cell EMT by elevating the expression of Vimentin and N-cadherin while diminishing E-cadherin expression via activation of the MAPK signaling pathway. The aforementioned results were reversed in PCa cells treated by pcDNA3.1-Flag-FBP1. Evidence has been provided in this study that FBP1 gene silencing activates the MAPK pathway, which ultimately promotes cell EMT, invasion and metastasis in PCa.

Keywords: FBP1; MAPK signaling pathway; epithelial-mesenchymal transition; invasion; metastasis; prostate cancer.


Figures

Figure 1.
Figure 1.
The highest expression of FBP1 is identified in PCa PC-3 and DU-145 cell lines. A, mRNA expression of FBP1 in human normal prostatic epithelial cell line (RWPE-1) and PCa cell lines (DU-145, PC-3, RM-1, LNCaP and IA8) detected by RT-qPCR. B, western blot analysis of FBP1 protein level in human normal prostatic epithelial cell line (RWPE-1) and PCa cell lines (DU-145, PC-3, RM-1, LNCaP and IA8). The band intensity was assessed. The above data were measurement data, which were presented as mean ± standard deviation and analyzed by one-way ANOVA. The multiple comparison was analyzed by post-hoc Tukey test. The experiment was repeated in triplicates. * p < 0.05 vs. the RWPE-1 cell line; # p < 0.05 vs. the DU-145 cell line. RT-qPCR, reverse transcription quantitative polymerase chain reaction; PCa, prostate cancer; FBP1, fructose-bisphosphatase 1; ANOVA, analysis of variance.
Figure 2.
Figure 2.
FBP1 gene silencing promotes PCa cell proliferation. A, MTT detection for OD values of DU-145 cell line. B, MTT detection for OD values of PC-3 cell line. The PCa cell viability was measurement data, which were presented as mean ± standard deviation and analyzed by two-way analysis of variance. The multiple comparison was analyzed by post-hoc Tukey test. The experiment was repeated three times. * p < 0.05 vs. the blank group; # p < 0.05 vs. the U0126 group; & p < 0.05 vs. the PD98059 group. NC, negative control; FBP1, fructose-bisphosphatase 1; MTT, 3-(4,5-dimethylthiazol-2-yl)-2,5-diphenyltetrazolium bromide; PCa, prostate cancer; OD, optical density; ANOVA, analysis of variance.
Figure 3.
Figure 3.
FBP1 gene silencing promotes PCa cell migration. A-B, scratch images and migration rate of DU-145 cells at 0 h and 24 h based on wound healing assay. C-D, scratch images and migration rate of PC-3 cells at 0 h and 24 h according to wound healing assay. PCa cell migration rates were measurement data, which were presented as mean ± standard deviation and analyzed by one-way ANOVA. The multiple comparison was analyzed by post-hoc Tukey test. The experiment was repeated three times.* p < 0.05 vs. the blank group; # p < 0.05 vs. the U0126 group; & p < 0.05 vs. the PD98059 group. NC, negative control; FBP1, fructose-bisphosphatase 1; PCa, prostate cancer; ANOVA, analysis of variance.
Figure 4.
Figure 4.
FBP1 gene silencing promotes PCa cell invasion (× 400). A-B, Transwell invasive images and number of DU-145 cell. C-D, Transwell images and number of PC-3 cell. The number of migrating PCa cells was enumeration data, which were presented as mean ± standard deviation and analyzed by one-way ANOVA. The multiple comparison was analyzed by post-hoc Tukey test. The experiment was repeated three times. * p < 0.05 vs. the blank group; # p < 0.05 vs. the U0126 group; & p < 0.05 vs. the PD98059 group. FBP1, fructose-bisphosphatase 1; PCa, prostate cancer; ANOVA, analysis of variance.
Figure 5.
Figure 5.
FBP1 gene silencing up-regulates mRNA expression of ERK, N-cadherin and Vimentin and down-regulates that of E-cadherin. A, mRNA expression of FBP1, E-cadherin, Vimentin, N-cadherin and ERK in DU-145 cells detected by RT-qPCR. B, mRNA expression of FBP1, E-cadherin, Vimentin, N-cadherin and ERK in PC-3 cells measured by RT-qPCR. The mRNA expression determined by RT-qPCR was measurement data, which were presented as mean ± standard deviation and analyzed by one-way ANOVA. The multiple comparison was analyzed by post-hoc Tukey test. The experiment was repeated three times. *, p < 0.05 vs. the blank group; # p < 0.05 vs. the U0126 group; & p < 0.05 vs. the PD98059 group. NC, negative control; FBP1, fructose-bisphosphatase 1; ERK, extracellular regulated protein kinases; PCa, prostate cancer; RT-qPCR, reverse transcription quantitative polymerase chain reaction; ANOVA, analysis of variance.
Figure 6.
Figure 6.
FPB1 gene silencing increases protein expression of p-MEK, p-ERK1/2, Vimentin and N-cadherin while reduces that of E-cadherin. A-B, western blot analysis of FBP1, ERK1/2, E-cadherin, Vimentin and N-cadherin protein expression in DU-145 cells. The band intensity was assessed. C-D, western blot analysis of FBP1, ERK1/2, E-cadherin, Vimentin and N-cadherin protein expression in PC-3 cells. The band intensity was assessed. The protein expression determined by western blot analysis was measurement data, which were presented as mean ± standard deviation and analyzed by one-way ANOVA. The multiple comparison was analyzed by post-hoc Tukey test. The experiment was repeated three times. *, p < 0.05 vs. the blank group; # p < 0.05 vs. the U0126 group; & p < 0.05 vs. the PD98059 group. NC, negative control; FBP1, fructose-bisphosphatase 1; ERK1/2, extracellular regulated protein kinases; GAPDH, glyceraldehyde-3-phosphate dehydrogenase; PCa, prostate cancer; ANOVA, analysis of variance.
Figure 7.
Figure 7.
FBP1 gene silencing increases growth of PCa tumor. A, images of xenograft tumors in nude mice after subcutaneous inoculation of DU145 cells. B, growth curves for tumor volume in each group after subcutaneous inoculation of DU145 cells. C, relative tumor weight in each group after subcutaneous inoculation of DU145 cells. The growth results and relative weight of tumor was measurement data, which were presented as mean ± standard deviation and analyzed by one-way ANOVA. The multiple comparison was analyzed by post-hoc Tukey test. The experiment was repeated three times; the sample size for each group was 15 nude mice; *, p < 0.05 vs. the blank group; NC, negative control; FBP1, fructose-bisphosphatase 1; PCa, prostate cancer; ANOVA, analysis of variance.
Figure 8.
Figure 8.
Silencing of FBP1 promotes cell EMT in PCa. (a), HE staining images of xenograft tumor injected with DU145 cells from nude mice in each group (× 200). (b), immunohistochemistry staining results of E-cadherin, N-cadherin and Vimentin. (c), quantification of immunohistochemistry-staining results in Panel B. The positive expression of E-cadherin, N-cadherin and Vimentin was measurement data, which were presented as mean ± standard deviation and analyzed by one-way ANOVA. The multiple comparison was analyzed by post-hoc Tukey test. The experiment was repeated three times; the sample size for each group was 15 nude mice. * p < 0.05 vs. the blank group; NC, negative control; FBP1, fructose-bisphosphatase 1; PCa, prostate cancer; ANOVA, analysis of variance; HE, hematoxylin-eosin.
Figure 9.
Figure 9.
The mechanism map showing that FBP1 gene silencing activates of the MAPK signaling pathway, thereby promoting cell EMT. FBP1, fructose-bisphosphatase 1; MAPK, mitogen-activated protein kinase; EMT, epithelial-mesenchymal transition.

References

    1. Taylor BS, Schultz N, Hieronymus H, et al. Integrative genomic profiling of human prostate cancer. Cancer Cell. 2010;18(1):11–22. - PMC - PubMed
    1. Zhu LB, Zhao ST, Xu TZ, et al. Tumor necrosis factor-alpha-induced a disintegrin and metalloprotease 10 increases apoptosis resistance in prostate cancer cells. Oncol Lett. 2014;7(3):897–901. - PMC - PubMed
    1. Ye D, Zhu Y.. [Epidemiology of prostate cancer in China: an overview and clinical implication]. Zhonghua Wai Ke Za Zhi. 2015;53(4):249–252. - PubMed
    1. Scher HI, Fizazi K, Saad F, et al. Increased survival with enzalutamide in prostate cancer after chemotherapy. N Engl J Med. 2012;367(13):1187–1197. - PubMed
    1. Kapur S, Xiao H.. Extraconal orbital soft tissue metastasis secondary to prostate cancer: an unusual presentation. World J Oncol. 2014;5(3):139–143. - PMC - PubMed

Publication types

MeSH terms