

Clarin-2 is essential for hearing by maintaining stereocilia integrity and function
- PMID: 31448880
- PMCID: PMC6728604
- DOI: 10.15252/emmm.201910288
Clarin-2 is essential for hearing by maintaining stereocilia integrity and function
Abstract
Hearing relies on mechanically gated ion channels present in the actin-rich stereocilia bundles at the apical surface of cochlear hair cells. Our knowledge of the mechanisms underlying the formation and maintenance of the sound-receptive structure is limited. Utilizing a large-scale forward genetic screen in mice, genome mapping and gene complementation tests, we identified Clrn2 as a new deafness gene. The Clrn2clarinet/clarinet mice (p.Trp4* mutation) exhibit a progressive, early-onset hearing loss, with no overt retinal deficits. Utilizing data from the UK Biobank study, we could show that CLRN2 is involved in human non-syndromic progressive hearing loss. Our in-depth morphological, molecular and functional investigations establish that while it is not required for initial formation of cochlear sensory hair cell stereocilia bundles, clarin-2 is critical for maintaining normal bundle integrity and functioning. In the differentiating hair bundles, lack of clarin-2 leads to loss of mechano-electrical transduction, followed by selective progressive loss of the transducing stereocilia. Together, our findings demonstrate a key role for clarin-2 in mammalian hearing, providing insights into the interplay between mechano-electrical transduction and stereocilia maintenance.
Keywords: hair cells; mechanotransduction; mouse models; mutagenesis; stereocilia.
© 2019 The Authors. Published under the terms of the CC BY 4.0 license.
Conflict of interest statement
The authors declare that they have no conflict of interest.
Figures
- A
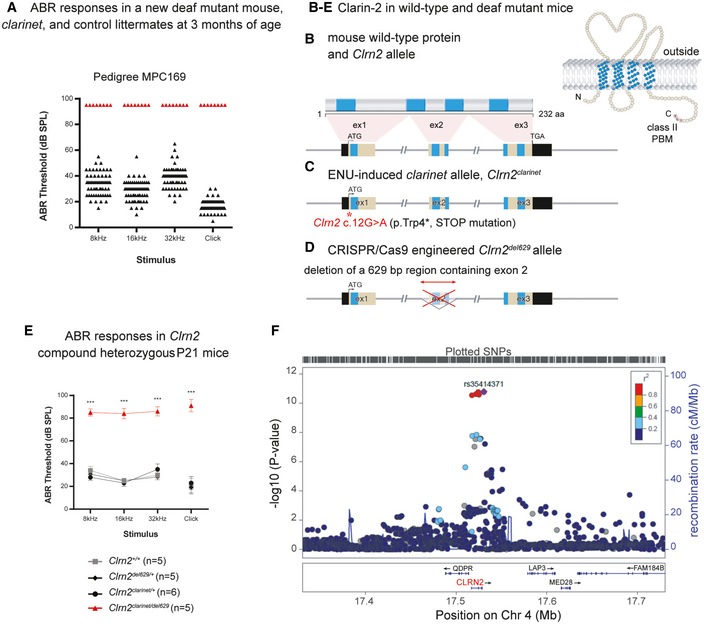
Identification of the ENU‐induced hearing loss pedigree MPC169, subsequently named clarinet. ABR phenotyping of pedigree Muta‐Ped‐C3PDE‐169 at 3 months of age identified 8 mice with elevated hearing thresholds (red triangles) compared to their normal hearing colony mates (n = 61, black triangles). Indeed, all eight affected mice were found to not respond to the highest intensity stimulus (90 dB SPL) at the three frequencies tested, or the click stimulus, and so their thresholds are shown as 95 dB SPL.
- B–D
The genomic structure of mouse Clrn2 (ENSMUST00000053250), and domains of the encoded tetraspan‐like glycoprotein (232 amino acids). Black‐filled boxes represent untranslated region of Clrn2. The positions of the transmembrane (TM) domains (blue) and the structure of Clrn2 clarinet (C) and Clrn2 del629 (D) alleles are indicated. The clarinet mutation, Clrn2 clarinet (c.12G > A) (red asterisk), is predicted to lead to a premature stop codon at position 4 (p.Trp4*) (C), whereas the Clrn2 del629 allele consists of a CRISPR/Cas9‐mediated 629 nucleotide deletion encompassing exon 2, leading to splicing of exon 1 to exon 3, which if translated would produce a protein lacking 2 (TM2 and TM3) of the 4 transmembrane domains (D).
- E
Averaged ABR thresholds for Clrn2 clarinet/del629 compound heterozygotes at P21, showing significantly elevated thresholds compared to Clrn2 +/+, Clrn2 clarinet/+ and Clrn2 del629/+ control colony mates. All five Clrn2 clarinet/del629 mice were found to not respond at the highest intensity stimulus (90 dB SPL) for at least one frequency/click stimulus. Data shown are mean ± SD ***P < 0.001, one‐way ANOVA (Please see Appendix Table S1 for exact P‐values).
- F
Regional plot of P‐values for SNP association with hearing difficulty around the CLRN2 gene locus. The genes within the region are annotated, and the direction of the transcripts is shown by arrows. Colouring is based on linkage disequilibrium (LD) across the region with the most associated SNP, rs35414371, shown in purple.
- A
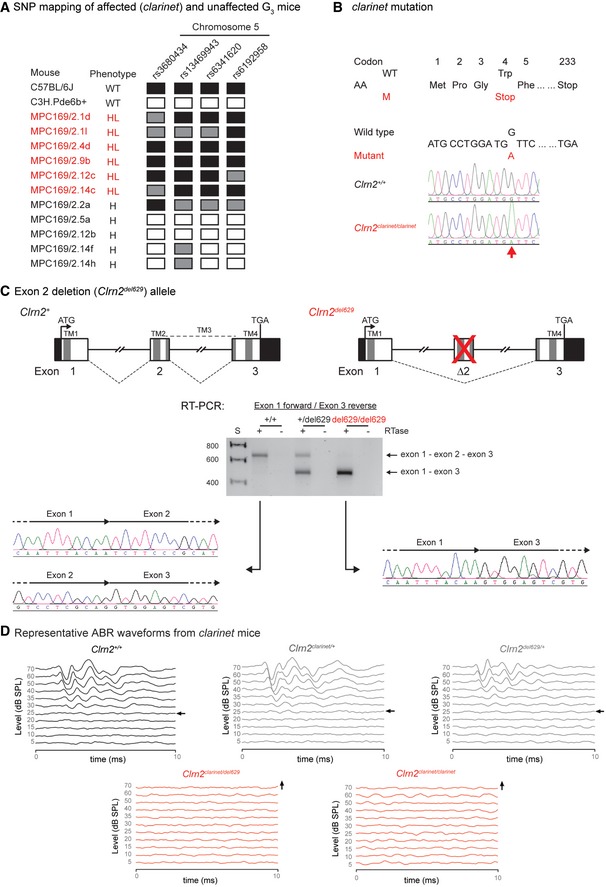
The clarinet mutation mapped to a ˜12 Mb region on Chromosome 5 between SNPs rs6341620 and rs6192958 (Chr5:37101560‐49346495, GRCm38), containing 110 genes.
- B
DNA sequencing identified a nucleotide transition (c.12G > A) in the Clrn2 gene at codon 4, thus altering the wild‐type (WT) sequence TGG, encoding a tryptophan (Trp), to the mutant (M) sequence TGA, encoding a premature stop codon (p.Trp4*). Electropherograms derived from a clarinet mutant mouse (Clrn2 clarinet/clarinet) and a wild‐type colony mate (Clrn2 +/+) control showing the sequence surrounding Clrn2 nucleotide 12 (indicated by an arrow).
- C
A second Clrn2 mutant allele (Clrn2 del629) was generated employing CRIPSR/Cas9 genome editing, deleting the second coding exon of the Clrn2 gene. Schematic representations of the genomic structure of the wild‐type (Clrn2 +) and mutant (Clrn2 del629) alleles are shown. Mouse Clrn2 consists of 3 exons, which are all in‐frame to each other, spanning 10.4 kb of genomic DNA. Wild‐type clarin‐2 is a 232 amino acid protein, containing 4 transmembrane (TM) domains (dark grey bars). TM1 is encoded by exon 1, TM2 and part of TM3 are encoded by exon 2, and TM4 is encoded by exon 3. The ATG (translation start) and the TGA (Stop) sites are in exons 1 and 3, respectively, and the 5′ and 3′ untranslated regions are shown as black. RT–PCR of RNA extracted from cochleae of Clrn2 +/+, Clrn2 +/del629 and Clrn2 del629/del629 mice, using oligonucleotide primers designed to exon 1 (forward primer) and exon 3 (reverse primer) of the Clrn2 gene, confirms deletion of exon 2 in the mutant mice and identifies aberrant splicing of exon 1 to exon 3, which are in‐frame. As such, the Clrn2 del629/del629 transcript has the potential to generate a shorter clarin‐2 isoform, but this would be missing two of the four transmembrane domains that define the tetraspan clarin‐2 protein.
- D
Averaged ABR click waveforms for Clrn2 +/+, Clrn2 clarinet/+, Clrn2 del629/+, Clrn2 clarinet/del629 and Clrn2 clarinet/clarinet mice at P21. Arrows indicate the sound intensity at which the auditory threshold was called.
- A
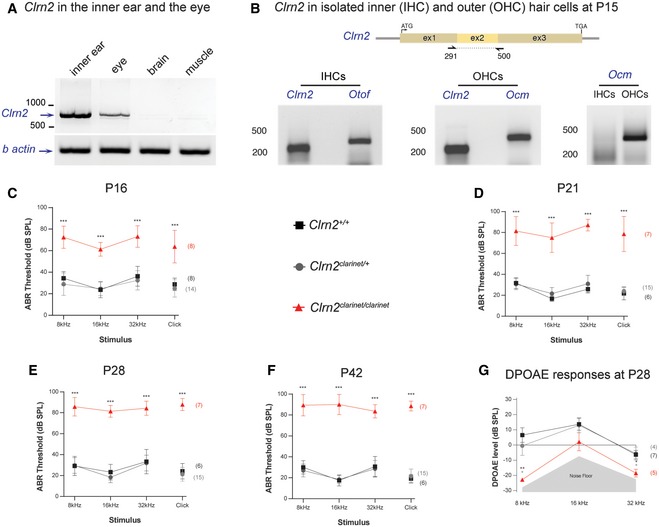
RT–PCR analysis in P30 mice showing the presence of Clrn2 transcripts in the inner ear and eye, but not in brain or muscle. β‐actin was used as a positive control.
- B
Clrn2 transcripts could be detected in both inner (IHCs) and outer (OHCs) hair cells of P15 wild‐type mice. Otoferlin (Otof) and oncomodulin (Ocm) transcripts were used as positive controls for IHCs and OHCs, respectively. Ocm transcripts were only present in the OHC lysate, demonstrating that the IHC sample had not been contaminated with OHCs.
- C–F
Auditory phenotyping of clarinet mice at P16 (C), P21 (D), P28 (E) and P42 (F). ABR threshold measurements show that Clrn2 clarinet/clarinet mice (red) exhibit a severe‐to‐profound hearing loss affecting all frequencies tested. At 16 kHz in Clrn2 clarinet/clarinet mice, the mean ABR hearing thresholds vary from 55–65 dB SPL at P16, 60–90 dB SPL at P21 and to 80–100 dB SPL at P28 and P42. Age‐matched Clrn2 +/+ (black) and Clrn2 clarinet/+ (grey) controls display thresholds within the expected range (15–45 dB SPL) at all frequencies and timepoints tested. At P16, all eight Clrn2 clarinet/clarinet mice exhibited recordable ABR responses for each frequency tested and the click stimulus. For the longitudinal ABR study, at P21 and P28 three of the seven Clrn2 clarinet/clarinet mice were found to not respond at the highest intensity stimulus (90 dB SPL) for at least one frequency‐specific/click stimulus. By P42, five of the Clrn2 clarinet/clarinet mice were found to not respond at the highest intensity stimulus (90 dB SPL) for at least two frequency‐specific/click stimuli. ABR data shown are mean ± SD ***P < 0.001, one‐way ANOVA.
- G
Averaged DPOAE responses for clarinet mice at P28, showing significantly reduced responses in Clrn2 clarinet/clarinet mutants at all frequencies tested. DPOAE data shown are mean ± SD. *P < 0.02, **P < 0.01, one‐way ANOVA. Please see Appendix Table S1 for exact P‐values.
- A
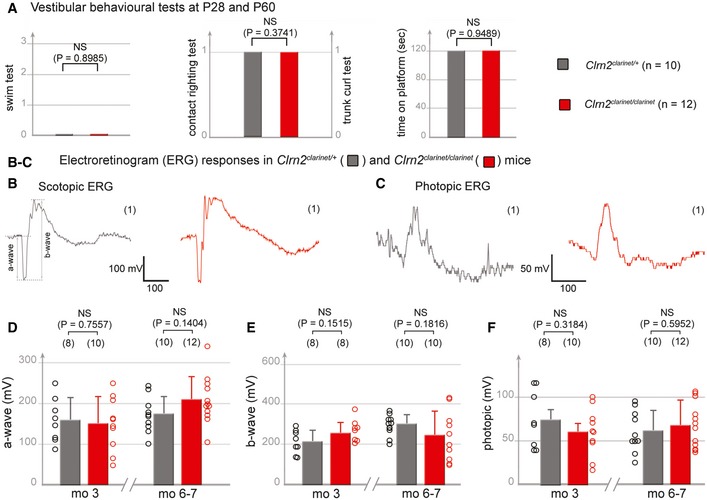
Vestibular behavioural tests (swim tests, contact‐righting, trunk‐curl and platform). The Clrn2 clarinet/clarinet mice (red, P28, n = 5, and P60, n = 7) have no vestibular dysfunction, displaying similar performances to age‐matched control Clrn2 clarinet/+ mice (grey, P28, n = 3, and P60, n = 7) (Student's t‐test was used for the platform assay, and the Pearson's Chi‐squared test for other experiments). Being similar, the values at P28 and P60 were combined.
- B–F
Electroretinogram (ERG) measurements from control Clrn2 clarinet/+ (grey) and mutant Clrn2 clarinet/clarinet (red) mice. Each trace in (B, C) is representative of an ERG response from the eye of age‐matched Clrn2 clarinet/+ and Clrn2 clarinet/clarinet mice, showing no significant difference in a‐ or b‐wave amplitudes. (D–F) The lack of change in ERG amplitude responses in Clrn2 clarinet/clarinet mice (aged 3 or 6–7 months), regardless of the test conditions: scotopic (D, E) or photopic (F) indicates normal photoreceptor kinetics and no change in the sensitivity of photoreceptor cells. The data shown are mean ± SEM. (NS) indicates a statistically non‐significant difference (P > 0.1, Student's t‐test).
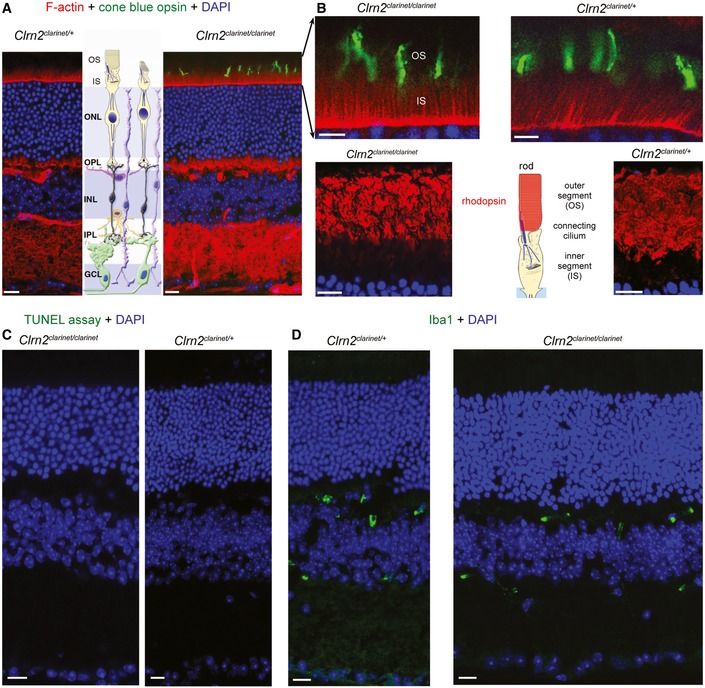
- A–D
Representative retinal cryosections of Clrn2 clarinet/+ and Clrn2 clarinet/clarinet mice at 7 months. Phalloidin and DAPI staining show the retina have a normal thickness and architecture, with a normal photoreceptor cells layer organization (A). Focusing on photoreceptor cells, we found no difference in the distribution of cone opsin or rhodopsin, which were confined to the outer segments of cones and rods, respectively, in Clrn2 clarinet/+ and Clrn2 clarinet/clarinet mice (B). The absence of morphological or functional abnormalities in Clrn2 clarinet/clarinet mice is consistent with absence of TUNEL‐positive nuclei (C) and normal distribution of Iba‐1, a gliosis marker (D). IS/OS, inner segment and outer segment; ONL, outer nuclear layer; OPL, outer plexiform layer; INL, inner nuclear layer; IPL, inner plexiform layer; GCL, ganglion cell layer. Scale bars, 20 μm.
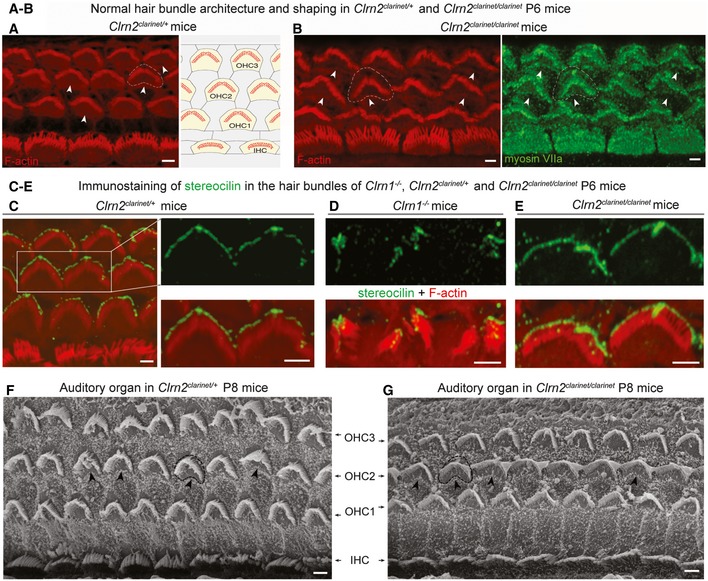
- A, B
Confocal microscopy images of whole‐mount preparations of mid‐basal cochlear sensory epithelia from Clrn2 clarinet/+ (A) and Clrn2 clarinet/clarinet (B) P6 mice immunostained for actin. Despite lack of clarin‐2, the developing sensory epithelium of mutants is similar to that of heterozygous controls.
- C–E
Confocal microscopy images of whole‐mount preparations of cochlear sensory epithelia from Clrn2 clarinet/+ (C), Clrn1 −/− (D) and Clrn2 clarinet/clarinet (E) P6 mice immunostained for stereocilin (green) and actin (red). Unlike the fragmented immunostaining in Clrn1 −/− mice (mirroring the fragmentation of the hair bundle), stereocilin immunostaining in Clrn2 clarinet/clarinet mice reflects the normally V‐shaped bundles of OHCs, similar to Clrn2 clarinet/+ OHCs.
- F, G
Representative scanning electron micrographs of the sensory epithelium of Clrn2 clarinet/+ (F) and Clrn2 clarinet/clarinet (G) P8 mice, showing no apparent differences in the gross patterning of IHCs and OHCs.
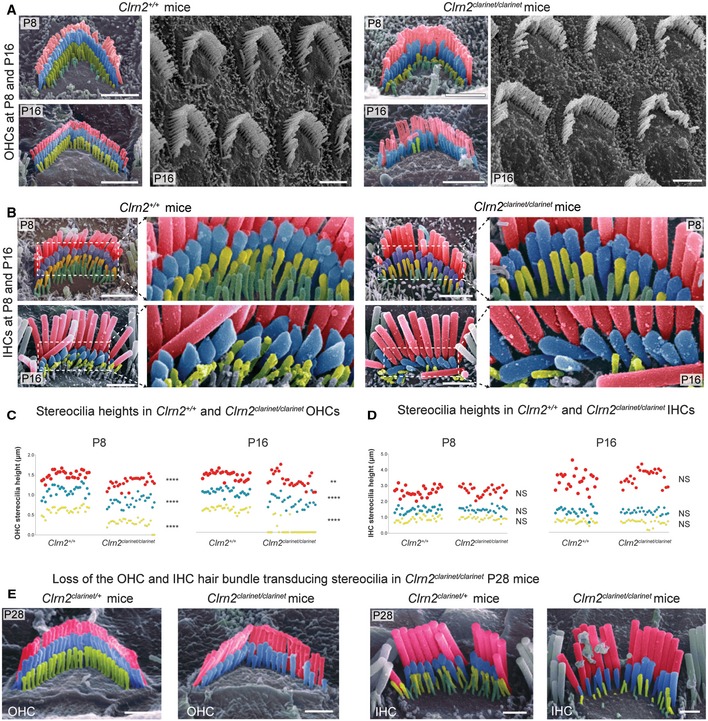
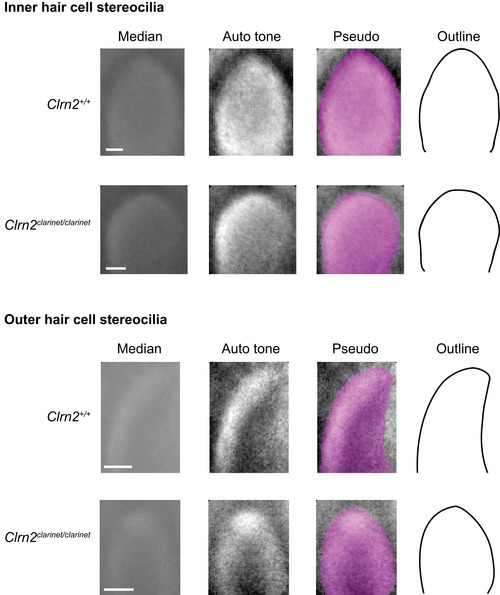
- A, B
Pseudo‐coloured scanning electron micrographs of individual outer and inner hair cell bundles from clarinet mice at P8 and P16, showing that gross morphology of OHC and IHC bundles is similar between Clrn2 +/+ and Clrn2 clarinet/clarinet mice. Representative images from the mid‐region of the cochlear spiral are shown, and close‐up views illustrate the three full rows, tallest (red), middle (blue) and short (yellow), of stereocilia in IHC and OHC hair bundles. At P8 and P16 (upper panels in A and B), the three stereocilia rows are observed in Clrn2 clarinet/clarinet OHCs (A) and IHCs (B), although the shortest and middle rows of IHC stereocilia appear less prolate compared to controls.
- C, D
Distribution of individual stereocilia measures across genotypes at P8 and P16. (C) The OHC stereocilia measurements at both P8 and P16 (C) show a significant difference in height of Clrn2 +/+ stereocilia compared to Clrn2 clarinet/clarinet in: e.g. for the shortest row at P8: Clrn2 +/+: 0.6188 ± 0.0944 p.μm (n = 27); Clrn2 clarinet/clarinet: 0.2948 ± 0.1029 p.μm (n = 27) (P < 0.0001, Mann–Whitney ranks comparison), and at P16: Clrn2 +/+: 0.579 ± 0.06179 p.μm (n = 27); Clrn2 clarinet/clarinet: 0.07282 ± 0.1626 p.μm (n = 27) (P < 0.0001, Mann–Whitney ranks comparison). Note the amount of value points equal to zero at P16. (D) Conversely, IHC stereocilia measurements at P8 and P16 did not show a difference between Clrn2 +/+ and Clrn2 clarinet/clarinet in: for the shortest row at P8: Clrn2 +/+: 0.8808 ± 0.1753 p.μm (n = 27); Clrn2 clarinet/clarinet: 0.9313 ± 0.1217 p.μm (n = 27) (P = 0.2244, unpaired t‐test); and at P16: Clrn2 +/+: 0.6784 ± 0.1171 p.μm (n = 23); Clrn2 clarinet/clarinet: 0.6063 ± 0.1855 p.μm (n = 26) (P = 0.2436, Mann–Whitney ranks comparison). **P < 0.01; ****P < 0.0001; NS P > 0.05.
- E
Pseudo‐coloured scanning electron micrographs of individual OHC (left panels) and IHC (right panels) hair bundles from clarinet mice at P28. Clrn2 clarinet/clarinet mutants have only two rows of OHC stereocilia, and the middle row of stereocilia is less uniform in height compared to controls. The middle and short rows of stereocilia in Clrn2 clarinet/clarinet IHC bundles appear fewer in number, and heterogeneous in height.
- A
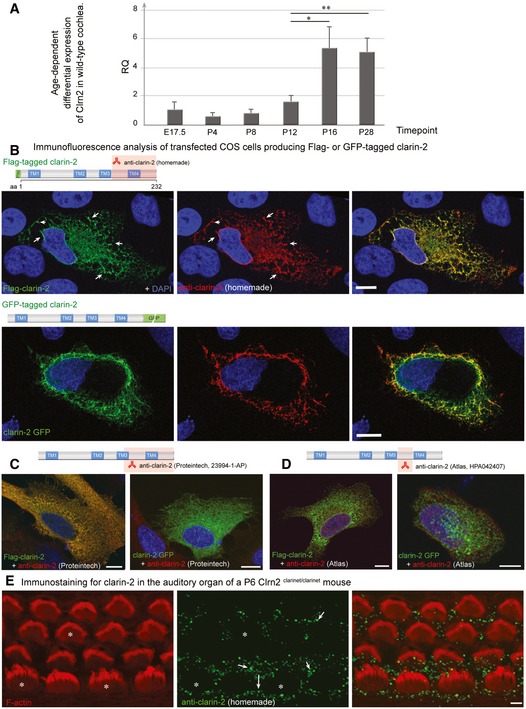
RT–PCR analysis. To assess the temporal expression of Clrn2 in the cochlea, cochlear RNA was extracted from wild‐type mice at several perinatal and early postnatal timepoints and utilized for qRT–PCR studies to determine the abundance of Clrn2 transcripts. Values were calculated relative to expression level at P4. Expression is constant during embryonic and early postnatal timepoints (E17.5 to P12), then increases ˜3‐fold between P12 and P16. RQ: relative quantification (arbitrary units). For each timepoint, the data shown are mean ± SD of 5 biological replicates. *P < 0.05, **P < 0.01, one‐way ANOVA.
- B–D
Clarin‐2 expression and test of anti‐clarin‐2 antibodies. Transfected HeLa cells producing FLAG‐ or GFP‐tagged clarin‐2 (green) were labelled by the anti‐clarin‐2 antibodies (green): homemade (B), commercial Proteintech (23994‐1‐AP) (C) or Atlas (HPA042407) (D). Only the homemade antibody clearly labelled the two over‐expressed clarin‐2 fusion proteins (overlapping immunostaining in yellow‐some highlighted by arrows, B). Conversely, none of the commercial antibodies could detect the GFP‐tagged clarin‐2, as visualized by the lack of yellow staining in the left panels in (C) (Proteintech) and (D) (Atlas).
- E
Immunostaining using anti‐clarin‐2 homemade antibody showed no specific staining in the F‐actin‐labelled hair cells (asterisks). The white arrows indicate the presence of non‐specific immunostaining over the supporting cells.
- A
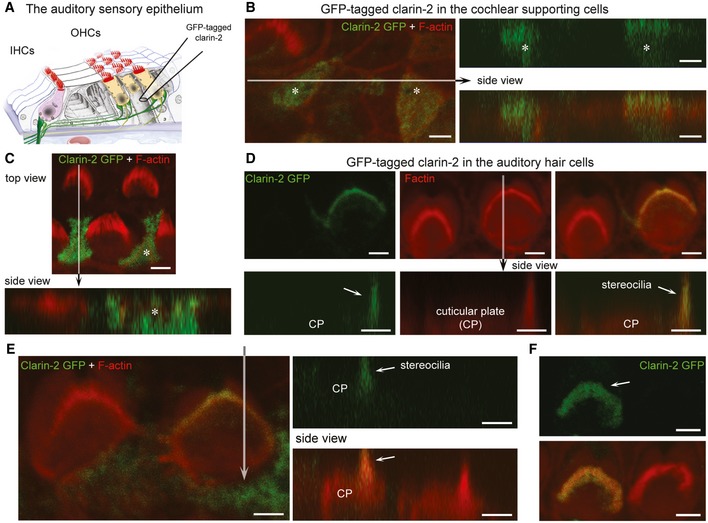
Schematic representation of the auditory sensory organ, illustrating the positioning of the electrode used for injectoporation of GFP‐tagged clarin‐2 construct into cochlear supporting and hair cells.
- B–F
Top and side views of representative images of supporting cells (asterisk) and hair cells expressing clarin‐2. In supporting cells, GFP‐tagged clarin‐2 (green) was distributed diffusely throughout the cytoplasm (B, C). By contrast, in all injectoporated hair cells, the majority of clarin‐2 was observed in the apical stereocilia (D–F). Arrows indicate position of the hair bundle stereocilia. Scale bars, 2 μm.
- A–D
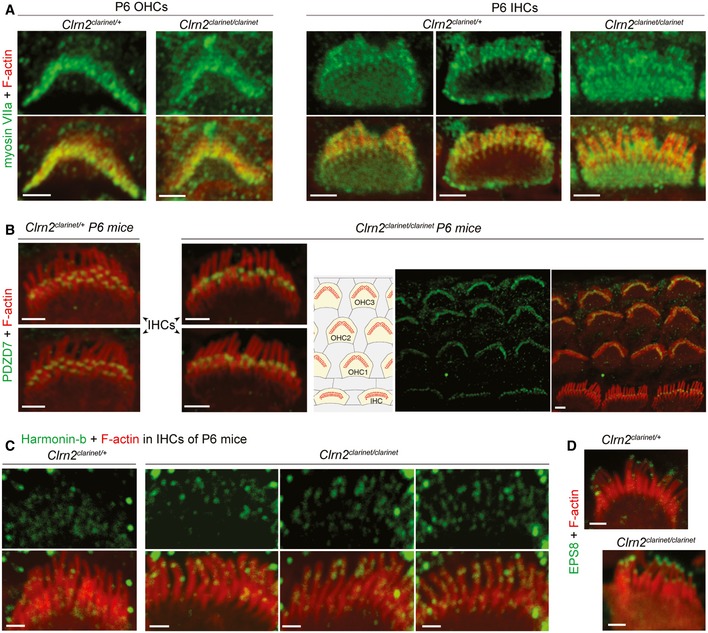
Confocal images of whole‐mount preparations of cochlear sensory epithelia from Clrn2 clarinet/+ and Clrn2 clarinet/clarinet P6 mice immunostained for the Usher 1B protein myosin VIIa (green in A) and actin (red), PDZD7 (green in B) and actin (red). The PDZD7 immunostaining is normally restricted to the base of stereocilia in both Clrn2 clarinet/+ and Clrn2 clarinet/clarinet mice. (C) Examples of IHCs from Clrn2 clarinet/+ and Clrn2 clarinet/clarinet P6 mice, showing the change in harmonin‐b localization in the absence of Clrn2. (D) EPS8 immunostaining (green) illustrating the protein enrichment at the tips of actin‐labelled stereocilia (red) in both Clrn2 clarinet/+ and Clrn2 clarinet/clarinet IHCs. Scale bars, 2 μm.
- A, B
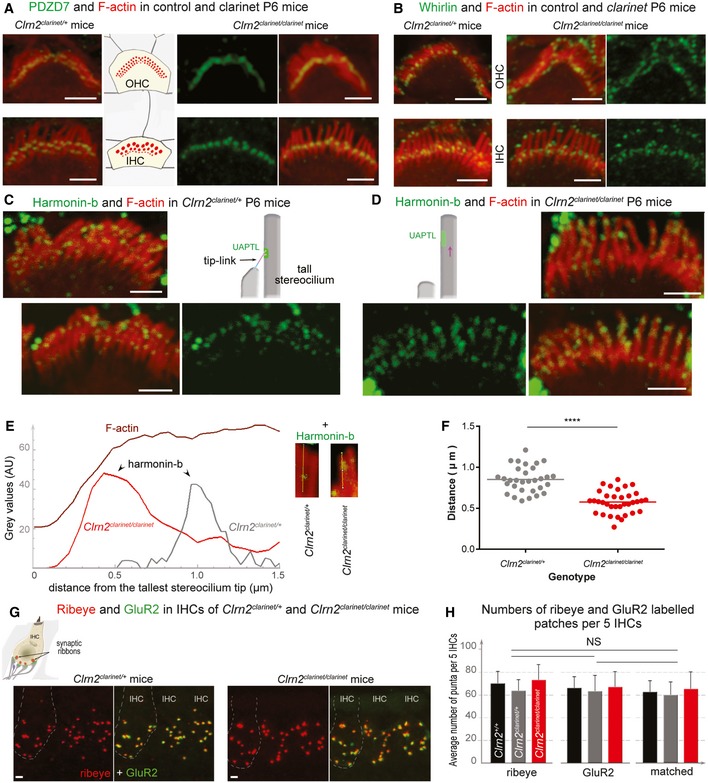
Confocal images of IHC and OHC hair bundles of Clrn2 clarinet/clarinet mice and heterozygous littermates at P6 immunostained for PDZD7 (A, green) and whirlin (B, green) and actin (red in both figures). The PDZD7 immunostaining is normally restricted to the base of stereocilia in both Clrn2 clarinet/+ and Clrn2 clarinet/clarinet P6 mice (A). Whirlin immunostaining is properly located at the stereocilia tips of IHC and OHC hair bundles (B).
- C–F
Harmonin‐b immunostaining in IHC hair bundles. In Clrn2 clarinet/clarinet mice (D), the harmonin‐b immunoreactive puncta (green) were still observable on the stereocilia, but unlike in age‐matched heterozygote littermates (C), were located much closer to the tip of stereocilia (indicated by the purple arrow). The two diagrams in (C) and (D) illustrate the position of harmonin‐b immunostaining (green) corresponding to the site of the upper attachment point of the tip link (UAPTL), facing the tip link. The bright green signal outside stereociliary bundles are non‐specific. The change of harmonin‐b localization along the stereocilium in Clrn2 clarinet/clarinet mice is illustrated further by line scan (E) and quantification (F) analyses. The insets in (E) show images of individual stereocilia used for the line scan signal analysis. The harmonin‐b immunoreactive puncta were located within 850 ± 28 nm (mean ± SEM) distance from the tip of the tallest stereocilia in Clrn2 clarinet/+ mice (n = 31 hair bundles from 5 mice) (F), and within 575 ± 23 nm in Clrn2 clarinet/clarinet mice (n = 35 hair bundles from 5 mice). Individual data points are shown and mean indicated by a horizontal bar. ****P < 0.0001, Student's t‐test.
- G, H
(G) Cochlear whole mounts from P21 clarinet mice, labelled with the IHC pre‐synaptic ribbon marker Ribeye (red) and the post‐synaptic density marker GluR2 (green), showing a similar number of total and matched Ribeye‐positive and GluR2‐positive puncta in Clrn2 clarinet/clarinet mutant cochleae compared to Clrn2 clarinet/+ littermates, which is reflected in puncta counted per five hair cells (H) n = 4 per genotype. Data shown are mean ± SD, one‐way ANOVA.
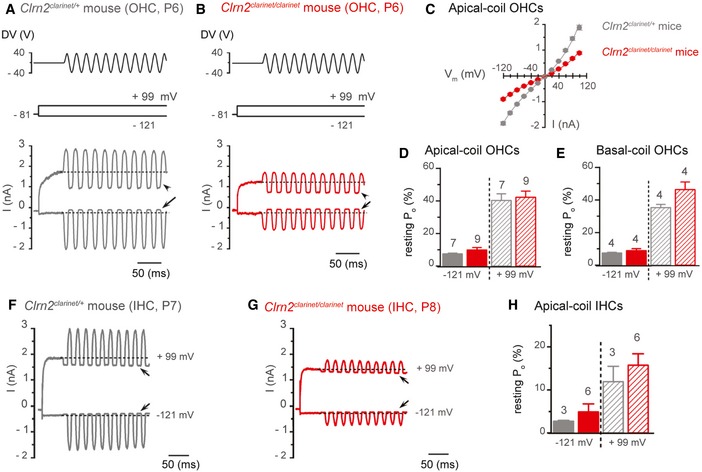
- A, B
Saturating MET currents recorded from P6 Clrn2 clarinet/+ (A) and Clrn2 clarinet/clarinet (B) apical‐coil OHCs by applying sinusoidal force stimuli of 50 Hz to the hair bundles at −121 mV and +99 mV. The driver voltage (DV) signal of ± 40 V to the fluid jet is shown above the traces (positive deflections of the DV are excitatory). The holding potential was −81 mV. Extracellular Ca2+ concentration was 1.3 mM. Arrows and arrowheads indicate the closure of the MET currents (i.e. resting MET current) elicited during inhibitory bundle displacements at hyperpolarized and depolarized membrane potentials, respectively. Dashed lines indicate the holding current, which is the current at the holding membrane potential.
- C
Average peak‐to‐peak current–voltage curves recorded from Clrn2 clarinet/+ (grey, P6, n = 7) and Clrn2 clarinet/clarinet (red, P6‐7, n = 9) apical‐coil OHCs.
- D, E
Resting open probability (P o) of the MET current at the membrane potential of −121 mV and +99 mV from apical‐ (D) and basal‐coil (E) OHCs. Number of OHCs investigated is shown above the columns. Data shown are mean ± SEM.
- F, G
Saturating MET currents recorded from a P7 Clrn2 clarinet/+ (F) and a P8 Clrn2 clarinet/clarinet (G) apical‐coil IHC using the same experimental protocol described above.
- H
Average P o of the MET current measured in apical‐coil IHCs at the membrane potential of −121 mV and +99 mV from Clrn2 clarinet/+ (P7, n = 3) and Clrn2 clarinet/clarinet (P7‐8, n = 6) apical‐coil IHCs. Data shown are mean ± SEM.
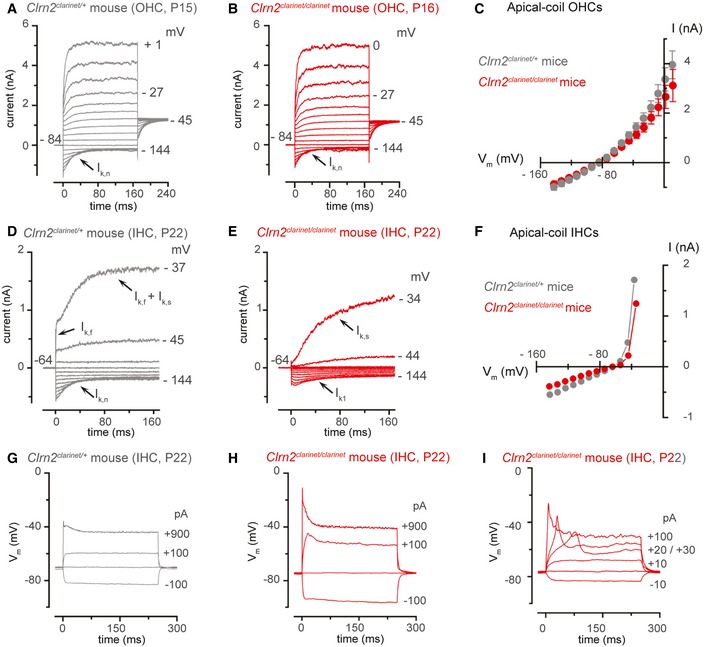
- A, B
Potassium currents recorded from mature Clrn2 clarinet/+ (A, P15) and Clrn2 clarinet/clarinet (B, P16) apical‐coil OHCs. Currents were elicited by depolarizing voltage steps (10 mV nominal increments) from −144 mV to more depolarized values from the holding potential of −84 mV. Note that the current characteristic of mature OHCs. The size of I K,n, measured in isolation as the deactivating tail currents (difference between instantaneous and steady‐state inward currents) for voltage steps from the holding potential to −124 mV, was 545 ± 115 pA (n = 5) in Clrn2 clarinet/+ and 595 ± 67 pA (n = 7) in Clrn2 clarinet/clarinet OHCs.
- C
Average peak current–voltage relation for the total K+ current recorded from Clrn2 clarinet/+ (P15‐16, n = 7) and Clrn2 clarinet/clarinet (P15‐16, n = 5) OHCs. Data shown are mean ± SEM.
- D, E
Potassium currents recorded from P22 mature Clrn2 clarinet/+ and Clrn2 clarinet/clarinet apical‐coil IHCs, respectively, using the same voltage protocol described above. Holding potential of −64 mV.
- F
Peak current–voltage relation for the total K+ current recorded from the IHCs shown in panel (A) and (B).
- G–I
Voltage responses from P22 Clrn2 clarinet/+ (G) and Clrn2 clarinet/clarinet (H,I) IHCs. Note that Ca2+‐dependent action potentials could be induced in mature IHCs (I).
References
-
- Aarnisalo AA, Pietola L, Joensuu J, Isosomppi J, Aarnisalo P, Dinculescu A, Lewin AS, Flannery J, Hauswirth WW, Sankila EM et al (2007) Anti‐clarin‐1 AAV‐delivered ribozyme induced apoptosis in the mouse cochlea. Hear Res 230: 9–16 - PubMed
-
- Adato A, Vreugde S, Joensuu T, Avidan N, Hamalainen R, Belenkiy O, Olender T, Bonne‐Tamir B, Ben‐Asher E, Espinos C et al (2002) USH3A transcripts encode clarin‐1, a four‐transmembrane‐domain protein with a possible role in sensory synapses. Eur J Hum Genet 10: 339–350 - PubMed
-
- Bariani P, De Chiffre L, Hansen HN, Horsewell A (2005) Investigation on the traceability of three dimensional scanning electron microscope measurements based on the stereo‐pair technique. Prec Eng 29: 219–228
Publication types
MeSH terms
Grants and funding
LinkOut - more resources
Full Text Sources
Molecular Biology Databases
