. 2019 Sep 17;58(37):3838-3847.
doi: 10.1021/acs.biochem.9b00394. Epub 2019 Sep 3.

APOBEC3A Loop 1 Is a Determinant for Single-Stranded DNA Binding and Deamination

Affiliations

APOBEC3A Loop 1 Is a Determinant for Single-Stranded DNA Binding and Deamination

Samantha J Ziegler et al. Biochemistry. .

Abstract

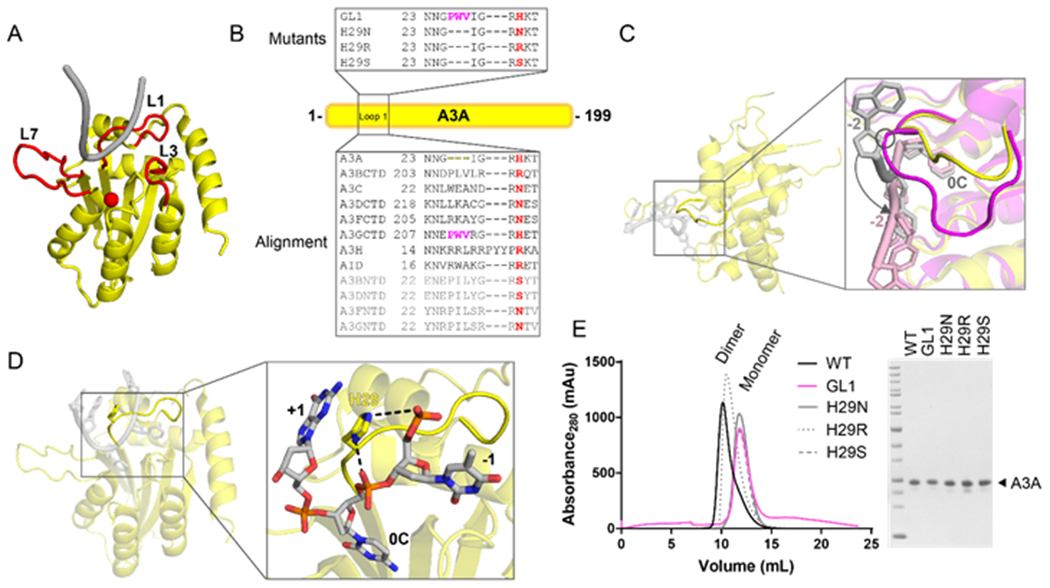
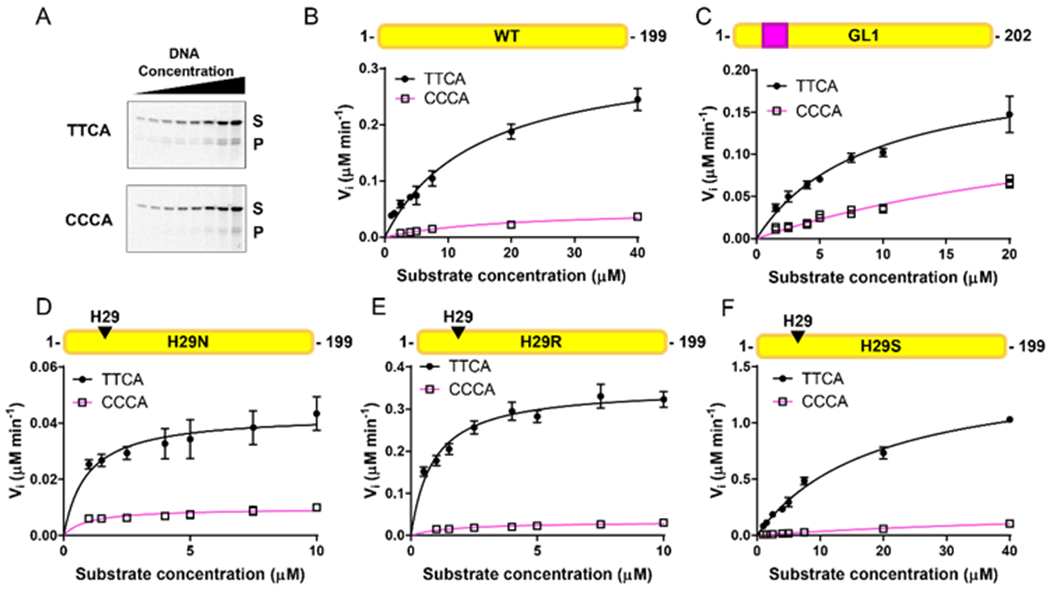
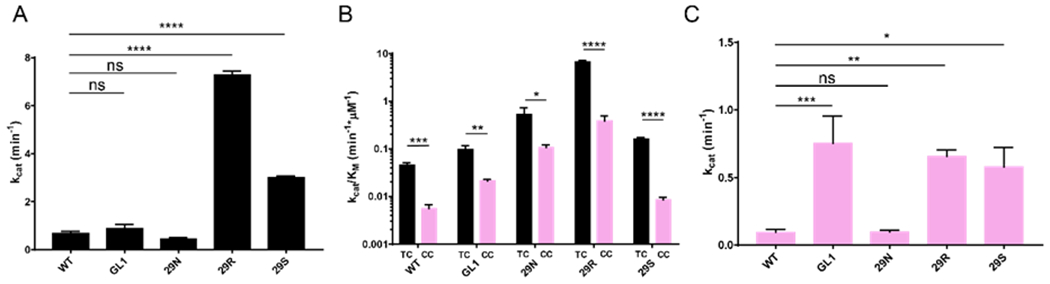
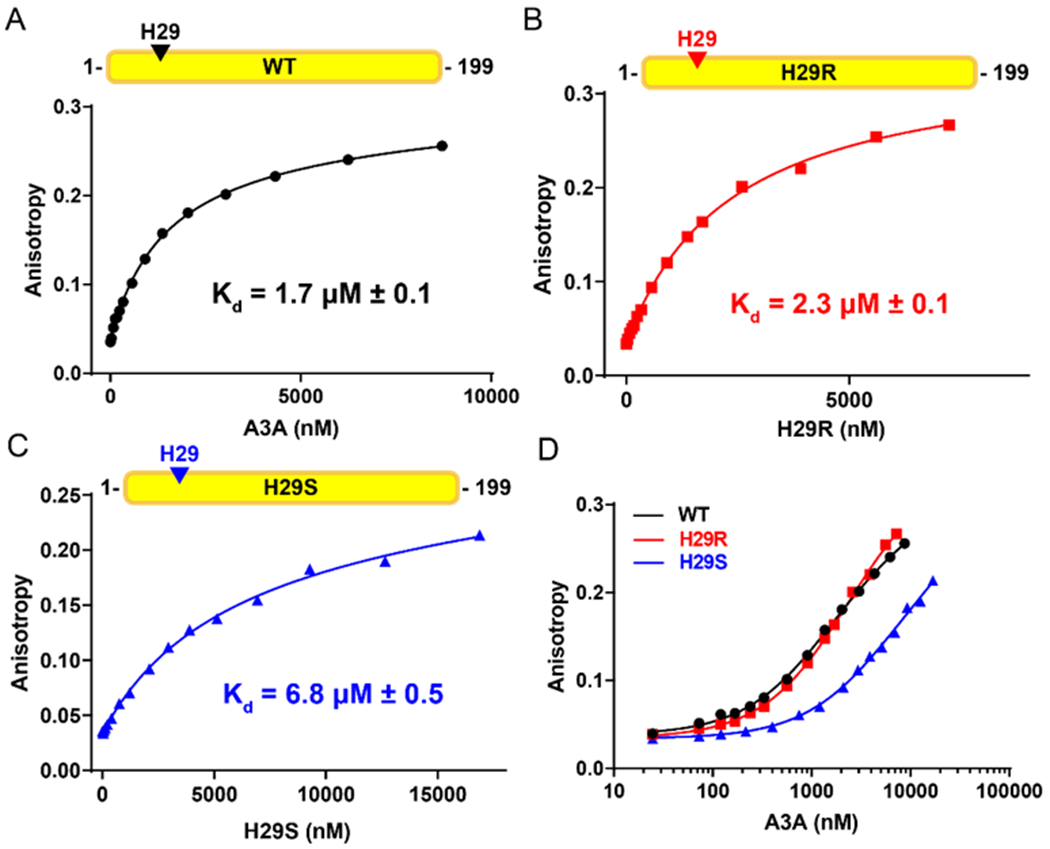
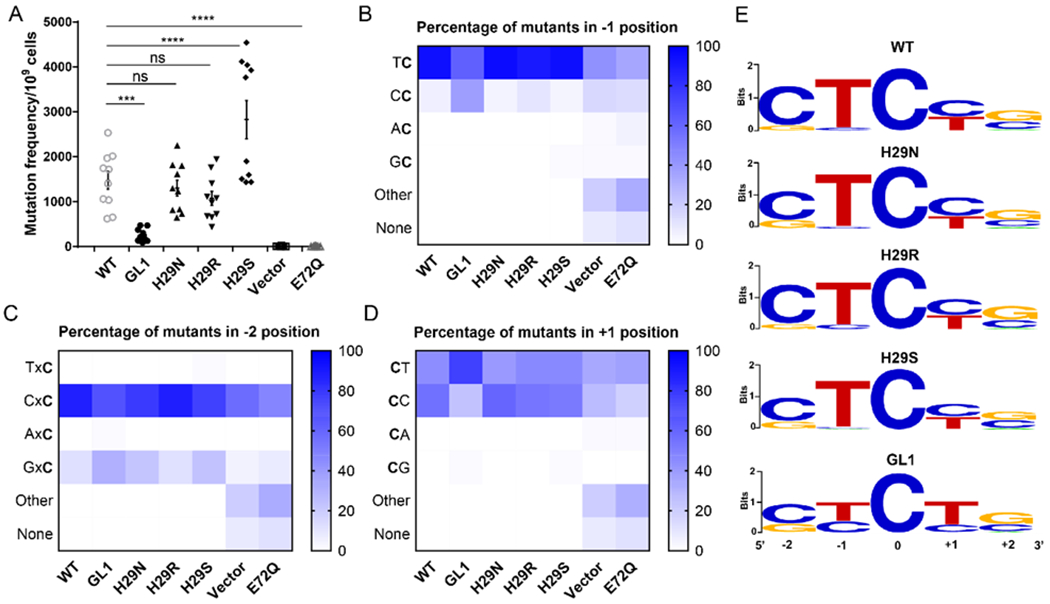
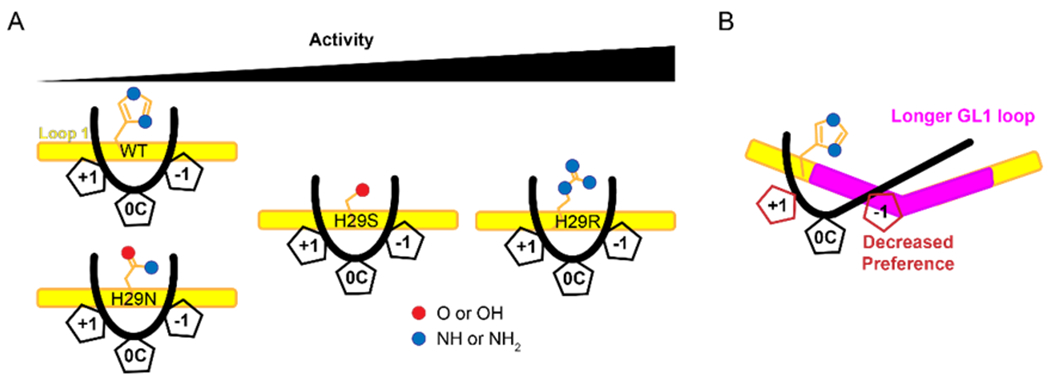
The apolipoprotein B mRNA editing enzyme catalytic polypeptide-like 3 (APOBEC3 or A3) family of proteins functions in the innate immune system. The A3 proteins are interferon inducible and hypermutate deoxycytidine to deoxyuridine in foreign single-stranded DNA (ssDNA). However, this deaminase activity cannot discriminate between foreign and host ssDNA at the biochemical level, which presents a significant danger when A3 proteins gain access to the nucleus. Interestingly, this A3 capability can be harnessed when coupled with novel CRISPR-Cas9 proteins to create a targeted base editor. Specifically, A3A has been used in vitro to revert mutations associated with disease states. Recent structural studies have shown the importance of loop regions of A3A and A3G in ssDNA recognition and positioning for deamination. In this work, we further examined loop 1 of A3A to determine how it affects substrate selection, as well as the efficiency of deamination, in the hopes of advancing the potential of A3A in base editing technology. We found that mutating residue H29 enhanced deamination activity without changing substrate specificity. Also interestingly, we found that increasing the length of loop 1 decreases substrate specificity. Overall, these results lead to a better understanding of substrate recognition and deamination by A3A and the A3 family of proteins.


Figures

Figure 1.
Figure 1.
A3A construct design and purification. (A) The structure of A3A (PDBID 5KEG, 5SWW) with the DNA-interacting loops highlighted in red, the catalytic zinc shown as a red sphere, and the DNA shown in gray. (B) Sequence alignment of human A3 family proteins and AID in the boxed region below A3A (yellow bar). Residue 29 is highlighted in red, the three residues used to make the GL1 construct are highlighted in magenta. The N-terminal domain sequences are in light gray. The mutants used in these experiments are in the box above the A3A bar. (C) The structure of A3A bound to ssDNA (PDBID 5KEG, 5SWW, yellow protein with gray DNA). The zoom window shows the overlay of the A3A-DNA (PDB ID 5KEG, 5SWW, yellow-gray) and A3G-DNA (PDB ID 6BUX, magenta-pink) structures to emphasize how loop length affects the DNA orientation. A potential clash between A3G loop 1 and the DNA from A3A is circled for emphasis and the location difference between the two substrates is shown by an arrow. (D) The structure of A3A bound to ssDNA (PDBID 5KEG, 5SWW). The zoom window shows that H29 sits within the U-turn of the DNA to interact with the backbone of the deaminated cytidine and the −1 nucleotide (hydrogen bonding represented by dashed lines). H29 also stacks with the +1 nucleotide. (E) Size exclusion chromatogram (left) of the purified mutants used in this study, with the SDS-PAGE analysis (right) to show purity.
Figure 2.
Figure 2.
WT and loop 1 mutants of A3A deaminate TTCA substrate more efficiently than CCCA substrate. (A) Example gel images of the WT A3A deamination assays with the TTCA substrate in the top panel and the CCCA substrate in the bottom panel. The full-length substrate is labelled with S and the product band is labelled with P. Images of all gels are included in Figure S1. (B-F) Michaelis-Menten plots of the loop 1 mutants tested. TTCA substrate curves are shown using circles and black lines. CCCA substrate curves are shown using squares and pink lines. The data represent the average of three replicates and the bars indicate the standard deviation. For all of the CCCA substrate curves, the error bars are small enough to be obscured by the symbols.
Figure 3.
Figure 3.
H29 point mutations affect A3A catalytic activity in vitro. (A) Comparison of catalytic activity between WT A3A and mutants on the TTCA substrate shows that H29R and H29S are significantly more active than WT A3A. (B) Catalytic efficiency, shown on a logarithmic scale, of each A3A construct on substrates containing either the TTCA hotspot or the CCCA hotspot indicates that all proteins prefer the TTCA substrate. (C) Comparison of catalytic activity between WT A3A and mutants on the CCCA substrate shows that GL1, H29R, and H29S are significantly more active than WT A3A. Significance was determined using a 2-way ANOVA to determine the difference between kcat values and a student’s t-test to determine the difference between the kcat/KM of TTCA vs. CCCA for each A3A mutant: ns – no significance, * P < 0.05, ** P < 0.005, *** P < 0.0005 , **** P < 0.0001. The standard deviation is presented for all measurements.
Figure 4.
Figure 4.
H29R mutation does not affect A3A substrate binding affinity. (A-C) Fluorescence anisotropy of WT A3A (A), H29R (B), and H29S (C) binding to a 5’-fluorescently labeled 15-nucleotide ssDNA substrate (Table S1). The measurements of each titration point were done in triplicate and the standard deviation of each point was calculated (the error bars are small enough to be obscured by the symbols). The dissociation constant (Kd) is shown on each graph. (D) Log scale anisotropy curves to compare affinities between WT (black), H29R (red), and H29S (blue).
Figure 5.
Figure 5.
The point mutations in A3A do not change substrate preference. (A) Rifampicin assay colony counts. Ten replicates of the experiment were counted and averaged, with the error bars representing the SEM. The stars represent the level of statistical significance: ns = no significance, * P<0.05, ** P<0.005, *** P<0.0005, **** P<0.0001. (B-D) Sequence analysis of a portion of the RpoB gene from five colonies from each replicate (50 colonies total) from each A3A mutant. These samples were sequenced and analyzed for a change in preference in the −1, −2, and +1 positions of the hotspot. The percentage of preference for each of the four nucleotides was calculated in the −1 (B), −2 (C), and +1 (D) positions, and is displayed on a scale of white for 0% to dark blue for 100%. GL1 was statistically significantly (as calculated by a 1-way ANOVA with multiple comparisons) different compared to WT at both the −1 and +1 positions. There was no statistical significant difference between WT A3A and the H29 point mutants at any of the hotspot positions. (E) Sequence logo representations of the most preferred hotspot for each A3A mutant.
Figure 6.
Figure 6.
Model of A3A loop 1 interactions with ssDNA (A) Loop 1 of WT A3A holds the substrate in an optimal position to deaminate cytidine. When residue 29 is mutated, there is no change to the preference in the hotspot, but the catalytic efficiency is affected. (B) A longer loop 1 affects the preference for both the −1 and+1 nucleotides. The length of the loop does not change the efficiency of A3A.

Similar articles

Cited by

References

    1. Alexandrov LB, Nik-Zainal S, Wedge DC, Aparicio SA, Behjati S, Biankin AV, Bignell GR, Bolli N, Borg A, Borresen-Dale AL, Boyault S, Burkhardt B, Butler AP, Caldas C, Davies HR, Desmedt C, Eils R, Eyfjord JE, Foekens JA, Greaves M, Hosoda F, Hutter B, Ilicic T, Imbeaud S, Imielinski M, Jager N, Jones DT, Jones D, Knappskog S, Kool M, Lakhani SR, Lopez-Otin C, Martin S, Munshi NC, Nakamura H, Northcott PA, Pajic M, Papaemmanuil E, Paradiso A, Pearson JV, Puente XS, Raine K, Ramakrishna M, Richardson AL, Richter J, Rosenstiel P, Schlesner M, Schumacher TN, Span PN, Teague JW, Totoki Y, Tutt AN, Valdes-Mas R, van Buuren MM, van ‘t Veer L, Vincent-Salomon A, Waddell N, Yates LR, Australian Pancreatic Cancer Genome, I., Consortium, I. B. C., Consortium, I. M.-S., PedBrain I, Zucman-Rossi J, Futreal PA, McDermott U, Lichter P., Meyerson M., Grimmond SM, Siebert R, Campo E, Shibata T, Pfister SM, Campbell PJ, and Stratton MR (2013) Signatures of mutational processes in human cancer, Nature 500, 415–421. - PMC - PubMed
    1. Burns MB, Lackey L, Carpenter MA, Rathore A, Land AM, Leonard B, Refsland EW, Kotandeniya D, Tretyakova N, Nikas JB, Yee D, Temiz NA, Donohue DE, McDougle RM, Brown WL, Law EK, and Harris RS (2013) APOBEC3B is an enzymatic source of mutation in breast cancer, Nature 494, 366–370. - PMC - PubMed
    1. Harris RS, and Dudley JP (2015) APOBECs and virus restriction, Virology 479-480, 131–145. - PMC - PubMed
    1. Roberts SA, Lawrence MS, Klimczak LJ, Grimm SA, Fargo D, Stojanov P, Kiezun A, Kryukov GV, Carter SL, Saksena G, Harris S, Shah RR, Resnick MA, Getz G, and Gordenin DA (2013) An APOBEC cytidine deaminase mutagenesis pattern is widespread in human cancers, Nat Genet 45, 970–976. - PMC - PubMed
    1. Harris RS, Petersen-Mahrt SK, and Neuberger MS (2002) RNA editing enzyme APOBEC1 and some of its homologs can act as DNA mutators, Mol Cell 10, 1247–1253. - PubMed

Publication types