. 2019 Sep;12(9):e007284.
doi: 10.1161/CIRCEP.119.007284. Epub 2019 Aug 27.

Age and Sex Estimation Using Artificial Intelligence From Standard 12-Lead ECGs

Affiliations

Age and Sex Estimation Using Artificial Intelligence From Standard 12-Lead ECGs

Zachi I Attia et al. Circ Arrhythm Electrophysiol. 2019 Sep.

Abstract

Background: Sex and age have long been known to affect the ECG. Several biologic variables and anatomic factors may contribute to sex and age-related differences on the ECG. We hypothesized that a convolutional neural network (CNN) could be trained through a process called deep learning to predict a person's age and self-reported sex using only 12-lead ECG signals. We further hypothesized that discrepancies between CNN-predicted age and chronological age may serve as a physiological measure of health.

Methods: We trained CNNs using 10-second samples of 12-lead ECG signals from 499 727 patients to predict sex and age. The networks were tested on a separate cohort of 275 056 patients. Subsequently, 100 randomly selected patients with multiple ECGs over the course of decades were identified to assess within-individual accuracy of CNN age estimation.

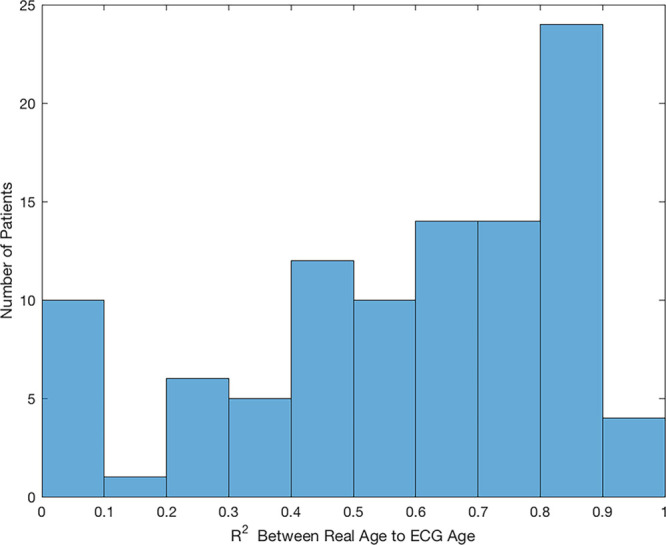
Results: Of 275 056 patients tested, 52% were males and mean age was 58.6±16.2 years. For sex classification, the model obtained 90.4% classification accuracy with an area under the curve of 0.97 in the independent test data. Age was estimated as a continuous variable with an average error of 6.9±5.6 years (R-squared =0.7). Among 100 patients with multiple ECGs over the course of at least 2 decades of life, most patients (51%) had an average error between real age and CNN-predicted age of <7 years. Major factors seen among patients with a CNN-predicted age that exceeded chronologic age by >7 years included: low ejection fraction, hypertension, and coronary disease (P<0.01). In the 27% of patients where correlation was >0.8 between CNN-predicted and chronologic age, no incident events occurred over follow-up (33±12 years).

Conclusions: Applying artificial intelligence to the ECG allows prediction of patient sex and estimation of age. The ability of an artificial intelligence algorithm to determine physiological age, with further validation, may serve as a measure of overall health.

Keywords: artificial intelligence; coronary disease; electrocardiography; hypertension; neural network.


Figures

Figure 1.
Figure 1.
Construction of neural network architecture. Shown is the construction of the neural network architecture for the age and sex networks. Further details are discussed under the methods section.
Figure 2.
Figure 2.
Receiver operating characteristic (ROC) of sex classification. A, Shown is the ROC curve for sex classification in the validation set. Overall area under the curve (AUC) was 0.97. B, Shows a separate network derived from specific ECG features—QRS duration, area of the T wave under V4, the time to peak of the P wave in lead I, the QTc interval, and the area under the P wave in lead I.
Figure 3.
Figure 3.
Convolutional neural network (CNN)-predicted age vs reported age. A, Shown is the estimated CNN-predicted ECG age (blue) vs the reported chronologic age (in years; red—identity line). The model R squared was 0.7 with a Pearson correlation of r=0.837. B, Demonstrates a multi-group classification to the age (in years) groups of 18 to 25, 25 to 50, 50 to 75, and 75 and accuracy of CNN-predicted age (x axis—estimated age) vs the actual age (y axis) in terms of the percentage of patients with a specific actual age who had a specific corresponding CNN-predicted age within a similar range (eg, a patient from 18–25 y of age having a CNN-predicted age from 18–25 y).
Figure 4.
Figure 4.
R-squared distribution for correlation between convolutional neural network (CNN)-predicted age and chronologic age. Shown is the distribution of the number of patients with specific R-squared values correlating CNN-predicted age (listed as ECG age in x axis) with chronologic age. Higher R squared values suggest a closer linear correlation between ages while low R squared values suggest poor correlation over time.
Figure 5.
Figure 5.
Correlation between convolutional neural network (CNN) predicted age and chronologic age in different patients. A, Shown is the correlation of CNN-predicted age (in years) with chronologic age (in years) at every year of life in an otherwise healthy patient. Note the linear association of age. Also note that the CNN-predicted age is younger than the chronological age. B, Shows correlation between CNN-predicted age and chronologic age in a woman with pulmonary hypertension with incident major hospitalizations. She was chronically managed with beta-blockers but developed supraventricular tachycardia and acute pulmonary embolus at age 22. In the second year, she developed acute cardiogenic and hemodynamic shock due to endocarditis and acute right ventricular failure. Thereafter, she was well controlled on medications for her pulmonary hypertension without further major incident events. With stabilization of her medical condition her CNN-predicted age dropped and matched her chronological age after age 23. C, shows an example of a patient with multiple incident myocardial infarctions, low ejection fraction, and eventual cardiac transplant. Before age 54, he had numerous myocardial infarctions, and CNN-predicted age significantly surpassed actual age. At age 54, he underwent a heart transplant from a donor who died at the age of 16, with subsequent decrease in CNN-predicted age to 50 y. He remained well for several years with subsequent loss of weight to normal weight and cessation of blood pressure and diabetes mellitus medications at the age of 60, with further drop in CNN-predicted age to below chronologic age.
Figure 6.
Figure 6.
Example electrocardiograms from patients comparing actual age and sex against CNN-predicted age and sex. Shown are 4 examples of patient ECGs. Patient (A) is a moderately healthy man without significant cardiovascular disease whose CNN-predicted age and sex were similar to actual. Similarly, patient (C) is a moderately healthy woman without significant cardiovascular disease whose CNN-predicted age and sex were similar to actual. Patient (B) is a man with history of myocardial infarction, hypertension, and diabetes mellitus whose CNN-predicted age was >10 y above his actual age. Finally, patient (D) is a very healthy 85 y old woman with no significant diseases who underwent a routine stress test as part of a general check-up.
Figure 7.
Figure 7.
Potential use of linear regression modeling of ECG-estimated age progression as a biomarker. Shown are examples from 2 patients—one whose ECG-estimated age increased faster than chronologic age (A) and one whose ECG-estimated age increased slower than chronologic age (B). In these 2 patients’ cases, patient (A) had an incident MI around age 50 and eventually developed a low ejection fraction. Patient (B) had hospitalizations in his late 60s for infectious and cancer issues but had no significant cardiovascular disease later in life along with resolution of his infectious and cancer diagnoses. The patient in (A) died at the age of 65 due to cardiovascular causes while the patient in (B) is still alive at the age of 85.

References

    1. Holmvang L, Lüscher MS, Clemmensen P, Thygesen K, Grande P. Very early risk stratification using combined ECG and biochemical assessment in patients with unstable coronary artery disease (A thrombin inhibition in myocardial ischemia [TRIM] substudy). The TRIM Study Group. Circulation. 1998;98:2004–2009. doi: 10.1161/01.cir.98.19.2004. - PubMed
    1. Voss A, Dietz R, Fiehring H, Kleiner HJ, Kurths J, Saparin P, Vossing HJ, Witt A. High resolution ECG, heart rate variability and nonlinear dynamics: tools for high risk stratification.. Proceedings of Computers in Cardiology Conference; 1993. pp. 261–264.
    1. Attia ZI, DeSimone CV, Dillon JJ, Sapir Y, Somers VK, Dugan JL, Bruce CJ, Ackerman MJ, Asirvatham SJ, Striemer BL, Bukartyk J, Scott CG, Bennet KE, Ladewig DJ, Gilles EJ, Sadot D, Geva AB, Friedman PA. Novel bloodless potassium determination using a signal-processed single-lead ECG. J Am Heart Assoc. 2016;5:e002746. - PMC - PubMed
    1. Attia ZI, Kapa S, Lopez-Jimenez F, McKie PM, Ladewig DJ, Satam G, Pellikka PA, Enriquez-Sarano M, Noseworthy PA, Munger TM, Asirvatham SJ, Scott CG, Carter RE, Friedman PA. Screening for cardiac contractile dysfunction using an artificial intelligence-enabled electrocardiogram. Nat Med. 2019;25:70–74. doi: 10.1038/s41591-018-0240-2. - PubMed
    1. Hossain SM, Ali AA, Rahman M, Ertin E, Epstein D, Kennedy A, Preston K, Umbricht A, Chen Y, Kumar S. Identifying drug (cocaine) intake events from acute physiological response in the presence of free-living physical activity. IPSN. 2014;2014:71–82. - PMC - PubMed

Publication types