. 2019 Aug 27:8:e46188.
doi: 10.7554/eLife.46188.

Merging organoid and organ-on-a-chip technology to generate complex multi-layer tissue models in a human retina-on-a-chip platform

Affiliations

Merging organoid and organ-on-a-chip technology to generate complex multi-layer tissue models in a human retina-on-a-chip platform

Kevin Achberger et al. Elife. .

Abstract

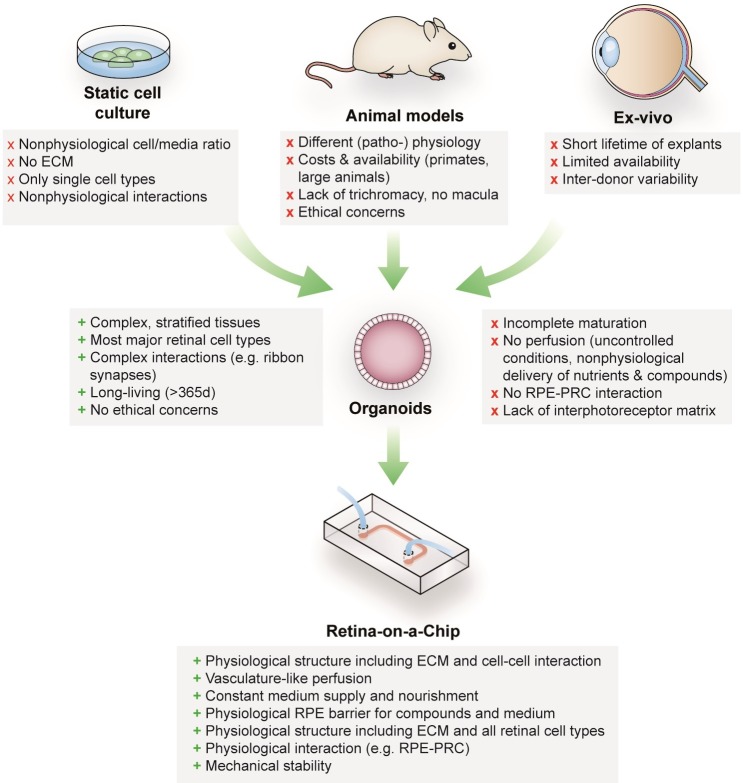
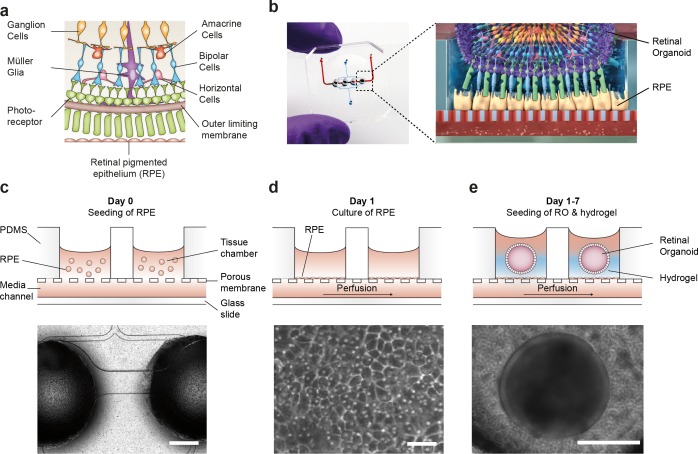
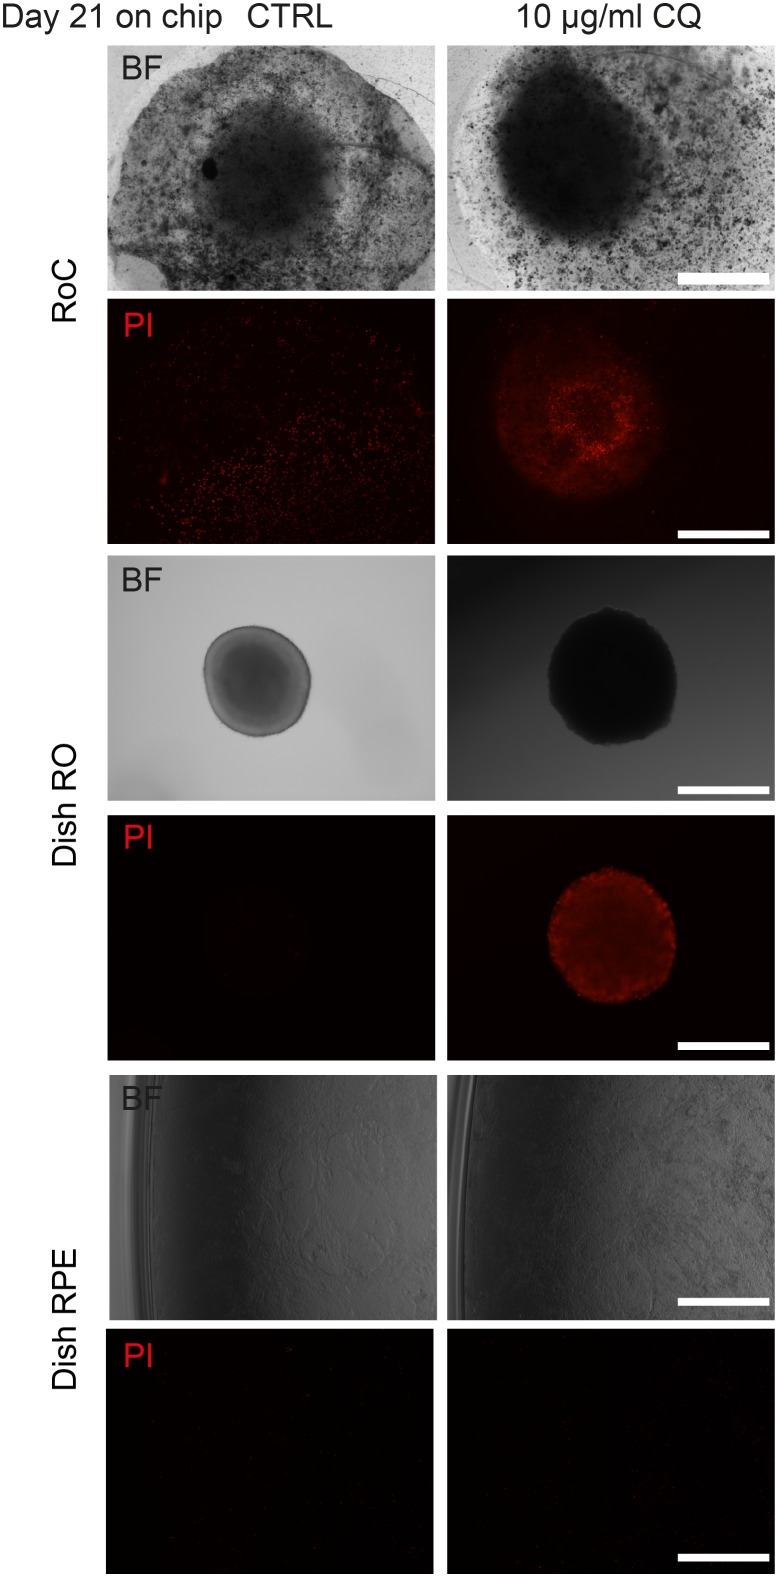
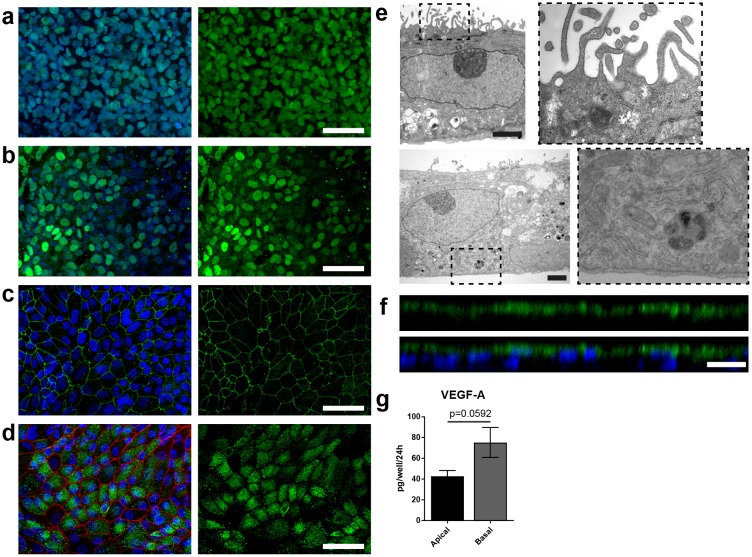
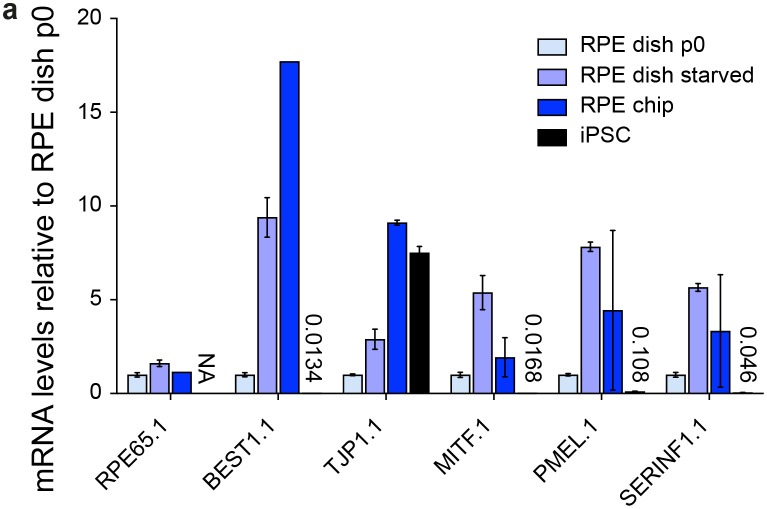
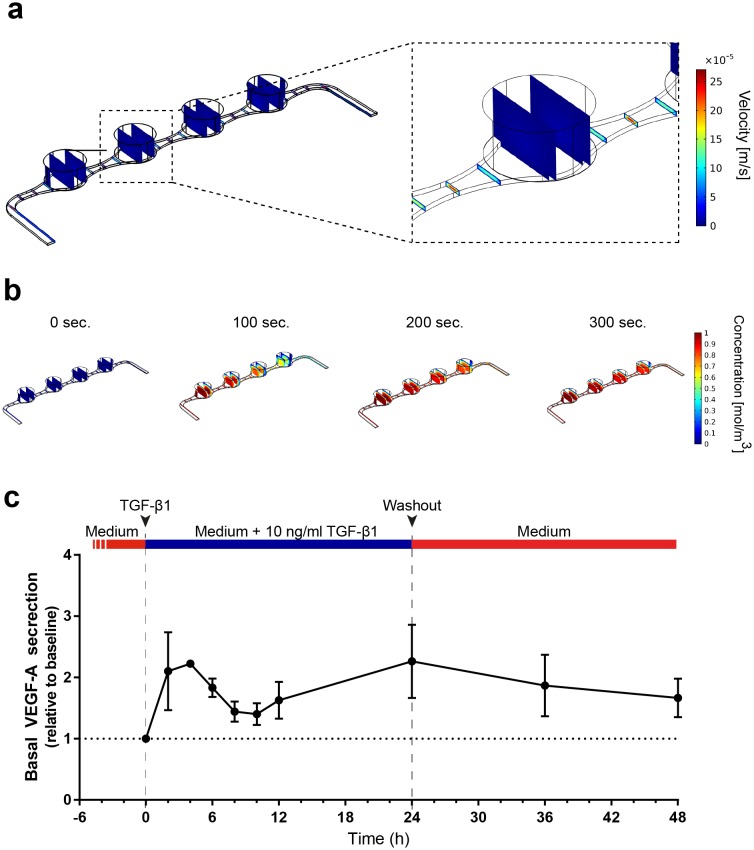
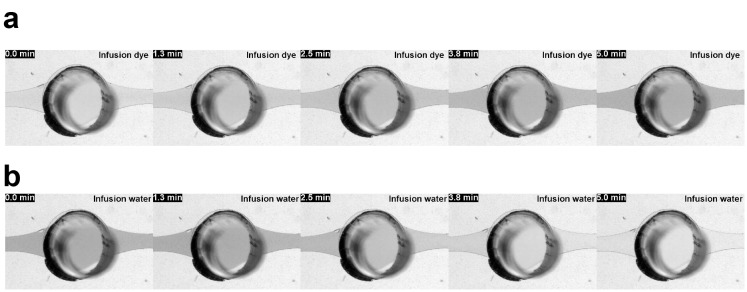
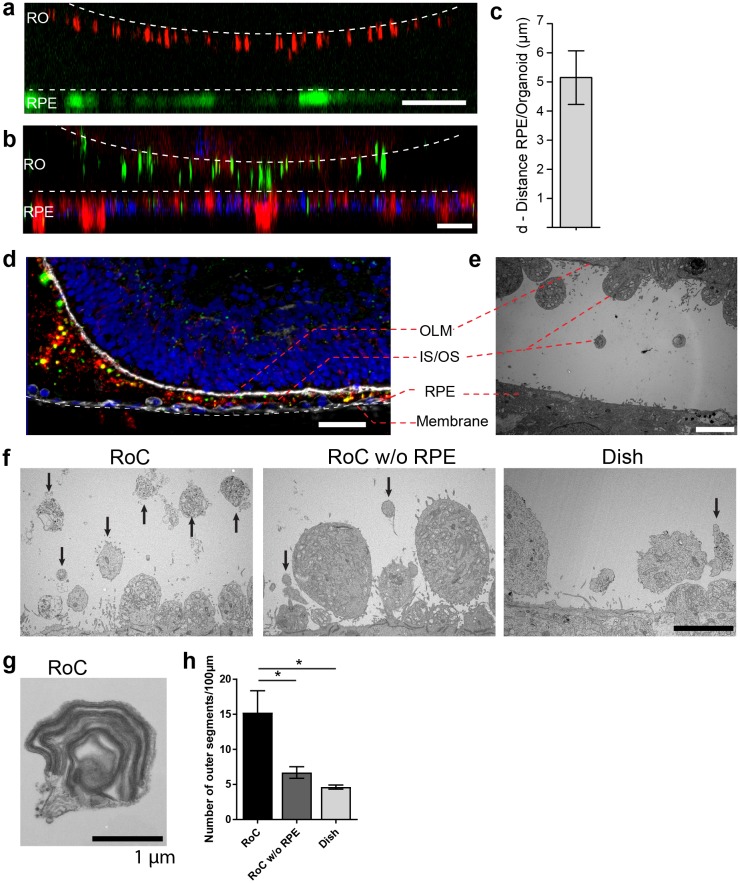
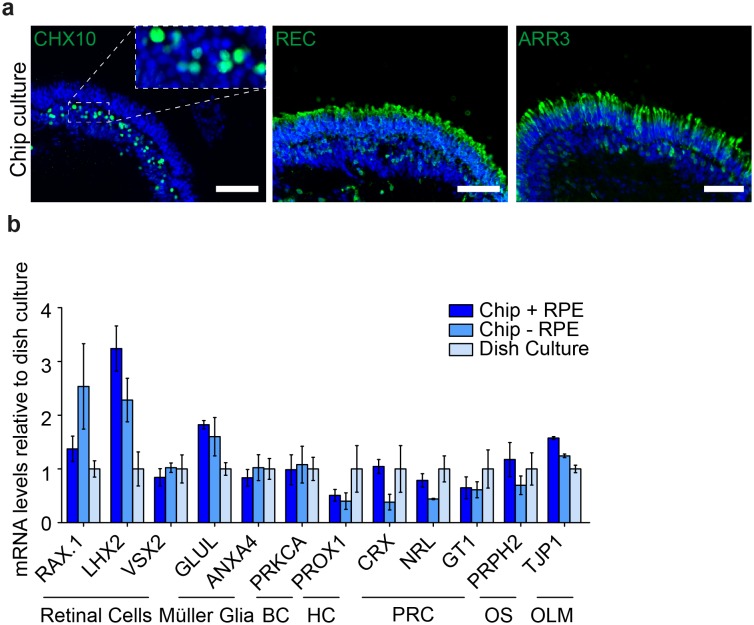
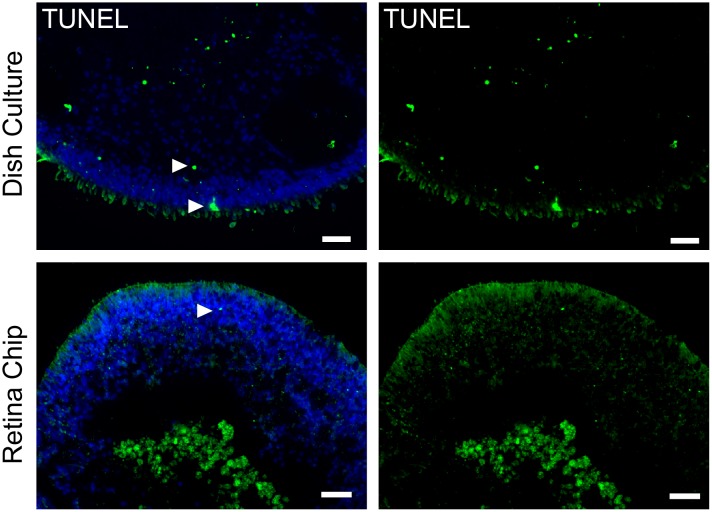
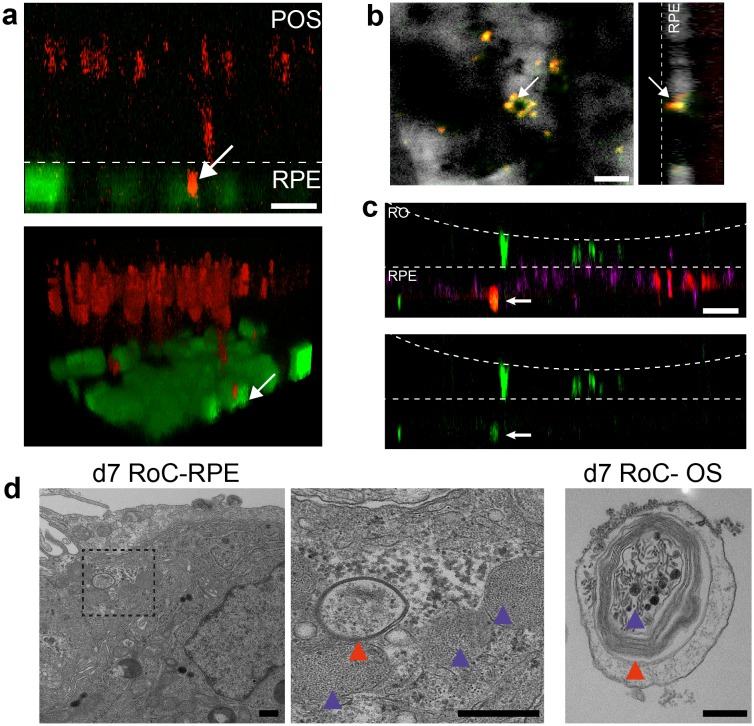
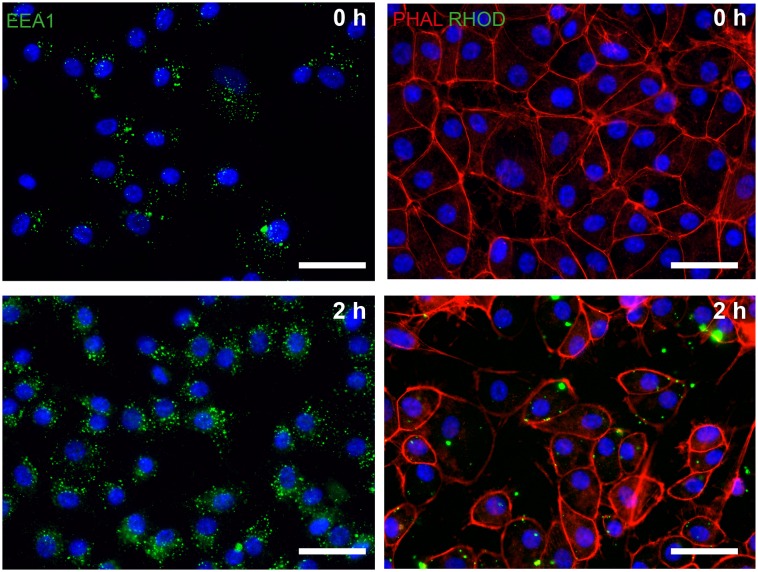
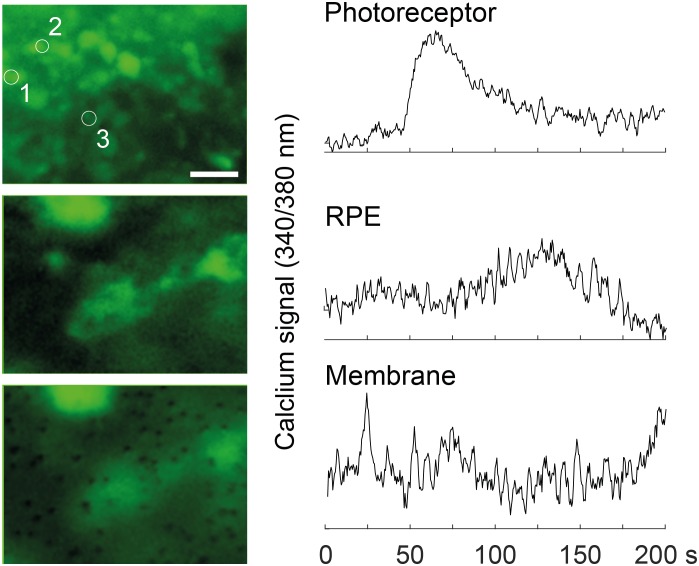
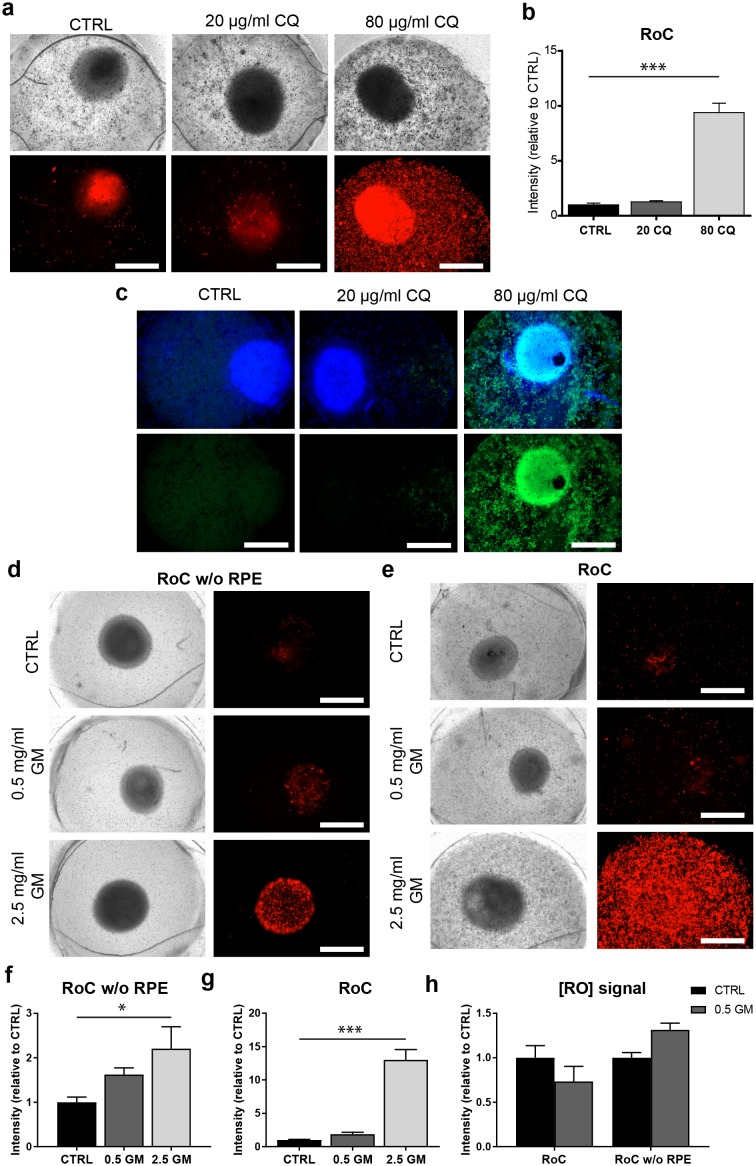
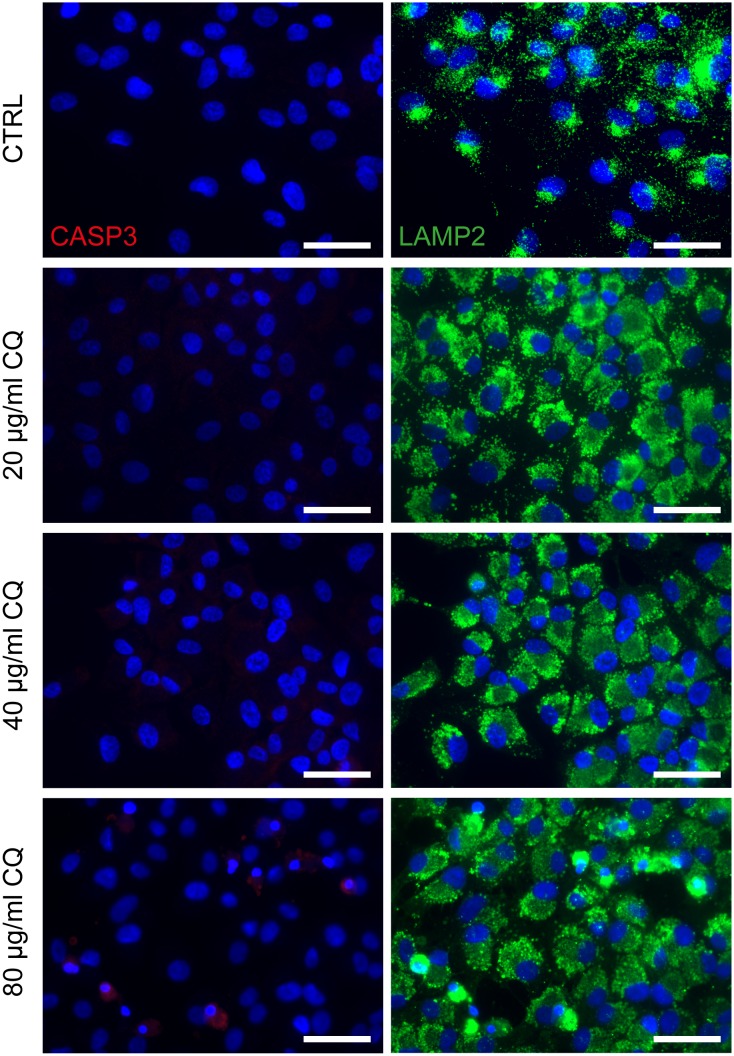
The devastating effects and incurable nature of hereditary and sporadic retinal diseases such as Stargardt disease, age-related macular degeneration or retinitis pigmentosa urgently require the development of new therapeutic strategies. Additionally, a high prevalence of retinal toxicities is becoming more and more an issue of novel targeted therapeutic agents. Ophthalmologic drug development, to date, largely relies on animal models, which often do not provide results that are translatable to human patients. Hence, the establishment of sophisticated human tissue-based in vitro models is of upmost importance. The discovery of self-forming retinal organoids (ROs) derived from human embryonic stem cells (hESCs) or human induced pluripotent stem cells (hiPSCs) is a promising approach to model the complex stratified retinal tissue. Yet, ROs lack vascularization and cannot recapitulate the important physiological interactions of matured photoreceptors and the retinal pigment epithelium (RPE). In this study, we present the retina-on-a-chip (RoC), a novel microphysiological model of the human retina integrating more than seven different essential retinal cell types derived from hiPSCs. It provides vasculature-like perfusion and enables, for the first time, the recapitulation of the interaction of mature photoreceptor segments with RPE in vitro. We show that this interaction enhances the formation of outer segment-like structures and the establishment of in vivo-like physiological processes such as outer segment phagocytosis and calcium dynamics. In addition, we demonstrate the applicability of the RoC for drug testing, by reproducing the retinopathic side-effects of the anti-malaria drug chloroquine and the antibiotic gentamicin. The developed hiPSC-based RoC has the potential to promote drug development and provide new insights into the underlying pathology of retinal diseases.

Keywords: human biology; human induced pulipotent stem cells; medicine; microphysiological systems; none; organ-on-a-chip; regenerative medicine; retinal organoids; retinal pigment epithelial cell; stem cells.


Conflict of interest statement

KA, CP, JH, SB, JR, JC, MN, VC, LA, WH, NS, KS, MU, SL, PL No competing interests declared

Figures

Figure 1.
Figure 1.. Advantages and limitations of retinal models for drug development and mechanistic research.
Figure 2.
Figure 2.. Characterization of retinal organoids.
(a) Brightfield image of a day 180 RO in dish culture. (b) Magnified area of a) highlighting inner and outer segment-like structures. (c) Day 180 ROs cryosectioned and immunostained for the rod marker rhodopsin (red), the outer segment marker ROM1 (green) and phalloidin (white) visualizing the outer limiting membrane. (d) Day 180 ROs sectioned and immunostained for the rod marker rhodopsin (red) and the outer segment marker ROM1 (green). (e) Day 180 ROs sectioned and immunostained for the rod marker rhodopsin (green) and for PNA lectin (red). (f) 3D visualization of whole-mount staining of day 180 RO stained for rhodopsin (red) and ROM1 (green). Bars indicate a) 250 µm b) 50 µm c) 100 µm d-f) 20 µm. Blue: DAPI.
Figure 2—figure supplement 1.
Figure 2—figure supplement 1.. Cell types in dish cultured hiPSC-derived retinal organoids.
(a) d190 RO stained for the neural retina marker CHX10 (green). (b) d260 RO stained for rod marker rhodopsin (green) and cone marker arrestin 3 (ARR3, red) (c) d260 RO stained for rod marker rhodopsin (green) and s-cone marker s-opsin (white). (d) d42 RO stained for ganglion cell marker BRN3B (green). (e) RO stained for amacrine marker AP2α (green). (f) d260 RO stained for bipolar cell marker PKCα (green). (g) d260 RO stained for Müller glia marker CRALBP (green) (h) d260 RO stained for OLM marker ZO-1 (green). Scale bars: a-h) 20 µm. Blue: DAPI.
Figure 3.
Figure 3.. Microfluidic RoC.
(a) Schematic representation of the human retinal composition and cell types in vivo. (b) Photo (left) of the RoC and (right) representation of the RO photoreceptor and RPE interaction. (c) RPE cells are seeded into the device, (d) forming a densely packed monolayer after 24 hr of culture. (e) ROs and the hyaluronic acid-based hydrogel are directly loaded from the top into the well and onto the RPE. Bars indicate (c) 500 µm, (d) 80 µm, (e) 400 µm.
Figure 3—figure supplement 1.
Figure 3—figure supplement 1.. Long-term culture of RoC.
Representative bright-field and propidium idiode images of day 176 RO cultured in the RoC with RPE over 21 days. RoC were either untreated (CTRL) or treated with 10 µg/ml Chloroquine (as a positive control for the viability assessment). On day 21, RoC were stained with prodidium iodide (PI) (red, cell death). As controls experiments, organoids and RPE of the same differentiation as used in the RoC were cultured in dishes for the same period. Scale bars: 500 µm.
Figure 4.
Figure 4.. Specific marker expression and polarization of retinal pigment epithelial cells in the RoC.
(a-d) Evaluation of RPE cells cultured for 14 days in the RoC by immunostaining of relevant RPE markers: a) RPE cells stained for MITF (green), (b) PAX6 (green), (c) ZO-1 (green) and (d) Melanoma gp100 (green), ZO-1 (red). (e) Electron microscopic image of polarized RPE cells. RPE cells display apical microvilli (top row) and a basal membrane (bottom row). (f) Apical microvilli formation is shown using confocal microscopy (orthogonal view of a z-stack) and immunohistochemical staining for ezrin (green). (g) Fluorescent quantification of VEGF-A secretion using ELISA comparing medium collected from a basal and apical channel in a specialized version of the RoC (n = 3 chips). Bars indicate a-d) (left) 50 µm, e) 2 µm, f) 20 µm. Blue: DAPI. Error Bars: S.E.M. p=p value (Two-sided student’s t-test).
Figure 4—figure supplement 1.
Figure 4—figure supplement 1.. Characterization of dish and chip cultured human iPSC-derived RPE.
(a) Chip cultured hiPSC-RPE immunostained for RPE markers ZO-1, RPE65 and MITF in green. (b) mRNA analysis of i) dish cultured hiPSC-RPE p0, ii) after starvation for 14 days, iii) of hiPSC-RPE inside the chip and iv) respective hiPSCs. Data were normalized to dish p0 culture expression. Scale bars: a) 40 µm. Blue: DAPI. Error bars: S.E.M.
Figure 5.
Figure 5.. Precisely controllable delivery of stimulants and time-resolved secretion kinetics.
(a-b) Analysis of the free and porous media flow and the transport of diluted species in the RoC: (a) Convective flow is confined to the vasculature-like media compartments and (b) compounds are delivered rapidly into the tissue chambers via diffusion. (c) Time-resolved monitoring of the secretion of VEGF-A before and after media supplemented with 10 ng/ml TGF-β1 was injected into RoCs (n = 3). After 24 hr, TGF-β1 was washed out using a normal medium. VEGF-A secretion in individual RoCs was normalized to the baseline secretion at 0 hr. Error bars: S.E.M.
Figure 5—figure supplement 1.
Figure 5—figure supplement 1.. Perfusion-enabled precisely controllable injection and washout.
Bright field images from VS1 and VS2 depicting (a) the switch in media conditions by infusion of a colored liquid into a RoC previously perfused with color-less liquid and (b) the switch back to color-less liquid; flow rate 20 µl/hr; min = minutes after infusion start.
Figure 6.
Figure 6.. RO-RPE interaction enhances the outer segment number at the connection site.
(a) For live-cell observation of RoCs, hiPSC-RPE was labeled with a pJG-IRBP-GFP viral vector prior co-culture (green); hiPSC-derived RO-RPCs were labeled with PNA lectin Alexa Fluor 568 (red). RO-RPE interaction site is illustrated as an orthogonal view (b) Orthogonal view of RO (Day 181) and RPE co-cultured for 7 days in the RoC and subsequently stained in situ for rhodopsin (green) and phalloidin (red). c) Distance between GFP-labeled RPE and PNA lectin-stained segment tips in a) was assessed by measurement using orthogonal images (n = 12 chip compartments). (d) Representative cryosection from 7 days co-cultured day 260 ROs and hiPSC-RPE. Sections were immunostained with ROM1 (green; outer segment marker), phalloidin (white; cytoskeleton) and rhodopsin (red; rods). (e) Electron microscopic image of a day 190 organoid facing RPE cultured in the RoC. (f) Representative electron microscopic images of inner and outer segments on the surface of day 181 ROs cultured for 7 days in f1) the RoC, f2) the RoC without RPE and f3) dish-cultured ROs. Black arrows indicate outer segments identified by stack formation. (g) Exemplary high magnification image of an outer segment-like structure containing organized membrane disks found in day 181 ROs cultured for 7 days in the RoC with RPE. (h) Number of segments/100 µm RO circumference comparing RoC, RoC without RPE and dish cultured RO. In the RoC, only the RPE facing side was analyzed (n = 3 RoC, 4 RoC w/o RPE and 3 dish cultured ROs were analyzed). Bars indicate (a-b) 40 µm, (d) 40 µm, (e-f) 5 µm, (g) 1 µm. Blue: DAPI. IS = inner segment, OS = outer segment. Error Bars: S.E.M. *p-value<0.05.
Figure 6—figure supplement 1.
Figure 6—figure supplement 1.. Comparison of dish and chip cultured human iPSC-derived retinal organoids.
(a) After 7 days of chip-culture, d190 RO inside the RoC showed preserved markers for retinal cells. a1) CHX10 (green) a2) recoverin (REC, green) a3) arrestin3 (ARR3, green). (a) mRNA expression from d190 organoids with and without RPE culture for 3 days inside the RoC were comparable to respective classically dish cultured organoids. Scale bars: a) 80 µm. Blue: DAPI. Error bars: S.E.M.
Figure 6—figure supplement 2.
Figure 6—figure supplement 2.. Comparison of cell death in RO cultured in the RoC or dish.
(a) RO in the retina chip (upper lane) in comparison to dish culture (lower lane) labeled with the dead cell marker TUNEL. Arrows indicate exemplary positive signals. Scale bars: 40 µm. Blue: DAPI.
Figure 7.
Figure 7.. Interaction of RO and RPE in the RoC displays phagocytosis of outer segment-like structures.
(a) Orthogonal view (x-z projection) and 3D reconstruction (bottom) of live-cell-monitored ROs and RPE at day 1 of RoC (RoC) culture. RO (red) and RPE (green) marked as described in Figure 6a. Arrow indicates PNA lectin stained photoreceptor segment fragment internalization by RPE cells. (b) Samples, as described in a) stained with rhodopsin antibody (red) and PNA lectin (green). RPE (white). Arrows indicate PNA lectin-marked fragments which perfectly co-localize with rhodopsin. The left image shows a top-view; right image an orthogonal y-z projection (c) Immunofluorescence imaging of RoC (ROs at day 190 of differentiation). Previously to the chip culture, RPE cells were labeled with an early endosome-GFP construct (red). Chips were thereafter immunostained for rhodopsin (green). (d) Electron microscopic images of day 7 RoC. d1) shows RPE situated underneath the RO. d2) magnification of d1) as indicated by the dotted black square. d3) Outer segment-like structure in a day 7 RoC. Red and blue arrows indicate segment-disk structures within the RPE (d2) and the corresponding structures found in an RO outer segment (d3). Scale bars: (a) 10 µm, (b) 10 µm, (c) 50 µm, (d) 500 nm Blue: DAPI.
Figure 7—figure supplement 1.
Figure 7—figure supplement 1.. Phagocytosis assay in dish cultured hiPSC-derived RPE.
hiPSC-RPE were incubated with bovine photoreceptor outer segments (POS) and after 2 hr stained positive for endosomal marker EEA1 (green, left panel) and rhodopsin (RHOD, green, right panel). Scale bars: 40 µm. Blue: DAPI.
Figure 7—figure supplement 2.
Figure 7—figure supplement 2.. Calcium-imaging in the RoC (at 370 nm) with ratiometric calcium indicator dye Fura-2.
Outer rim of the RO at the photoreceptor layer (top), deeper focal plane at the RPE layer (middle, encircled) and the focal plane at the membrane layer, visualizing the RPE contacting the membrane. Scale bar: 10 µm.
Figure 8.
Figure 8.. The RoC as a pharmacological testing platform.
(a) Representative bright-field and fluorescence images of day 243–260 RO cultured in the RoC with RPE on day three after treatment with chloroquine (CQ). RoC were either not treated with chloroquine as control (CTRL), treated with 20 µg/ml CQ or treated with 80 µg/ml CQ for 3 days. On day 3, chips were stained with propidium iodide (PI) (red; cell death). (b) Quantification of fluorescence intensities of PI staining, relative to controls (n = 6–11 chip compartments in three independent experiments). (c) Immunostaining with LAMP2 (green, lysosomes) and HOECHST (blue) after 3 days of drug testing of untreated RoCs (CTRL) and RoCs treated with 20 µg/ml CQ or 80 µg/ml CQ. (d) Representative bright-field and fluorescence images of day 202 RO cultured in the RoC without RPE. Cells were treated for 6 days with 0.5 mg/ml gentamicin, 2.5 mg/ml gentamicin or H2O (CTRL). On day 6, RoCs were stained with propidium iodide (PI) (red, cell death). (e) Representative bright-field and fluorescence images of day 202 RO cultured in the RoC. Cells were treated for six days with 0.5 mg/ml gentamicin, 2.5 mg/ml gentamicin or H2O (CTRL). On day 6, RoCs were stained with propidium iodide (PI) (red, cell death). (f) Quantification of fluorescence intensities of the PI signal of RO chip compartments without RPE relative to controls (n = 3 chip compartments per conditions). (g) Quantification of fluorescence intensities of the PI signal in the co-culture RoC relative to controls (n = 9 chips compartments per condition). (h) Comparison of the fluorescence intensities of PI staining of RO cultured in the RoC with (left bars) and without RPE (right bars) treated for 6 days with gentamicin (0.5 mg/ml) relative to their individual controls (CTRL). CQ = Chloroquine, GM = Gentamicin. HOECHST (blue; nuclei). Scale bars: 500 µm. Error bars: S.E.M. *p<0.05, ***p<0.001.
Figure 8—figure supplement 1.
Figure 8—figure supplement 1.. Chloroquine applied on dish cultured hiPSC-RPE.
Treatment of hiPSC-derived RPE grown on cover slips with 20, 40 or 80 µg/ml chloroquine for 24 hr and immunostaining against cleaved-caspase 3 (CASP3, red) and LAMP2 (green) a) Scale bars: 40 µm. Blue: DAPI.

Comment in

References

    1. Achberger K, Haderspeck JC, Kleger A, Liebau S. Stem cell-based retina models. Advanced Drug Delivery Reviews. 2019;140:33–50. doi: 10.1016/j.addr.2018.05.005. - DOI - PubMed
    1. Agarwal A, Goss JA, Cho A, McCain ML, Parker KK. Microfluidic heart on a chip for higher throughput pharmacological studies. Lab on a Chip. 2013;13:3599–3608. doi: 10.1039/c3lc50350j. - DOI - PMC - PubMed
    1. Berson JF, Harper DC, Tenza D, Raposo G, Marks MS. Pmel17 initiates premelanosome morphogenesis within multivesicular bodies. Molecular Biology of the Cell. 2001;12:3451–3464. doi: 10.1091/mbc.12.11.3451. - DOI - PMC - PubMed
    1. Bhise NS, Manoharan V, Massa S, Tamayol A, Ghaderi M, Miscuglio M, Lang Q, Shrike Zhang Y, Shin SR, Calzone G, Annabi N, Shupe TD, Bishop CE, Atala A, Dokmeci MR, Khademhosseini A. A liver-on-a-chip platform with bioprinted hepatic spheroids. Biofabrication. 2016;8:014101. doi: 10.1088/1758-5090/8/1/014101. - DOI - PubMed
    1. Blanks JC, Johnson LV. Specific binding of peanut lectin to a class of retinal photoreceptor cells: A species comparison. Investigative Ophthalmology & Visual Science. 1984;25:546–557. - PubMed

Publication types

MeSH terms