. 2019 Oct 3;6(5):ENEURO.0163-19.2019.
doi: 10.1523/ENEURO.0163-19.2019. Print 2019 Sep/Oct.

Knock-In Rat Lines with Cre Recombinase at the Dopamine D1 and Adenosine 2a Receptor Loci

Affiliations

Knock-In Rat Lines with Cre Recombinase at the Dopamine D1 and Adenosine 2a Receptor Loci

Jeffrey R Pettibone et al. eNeuro. .

Abstract

Genetically modified mice have become standard tools in neuroscience research. Our understanding of the basal ganglia in particular has been greatly assisted by BAC mutants with selective transgene expression in striatal neurons forming the direct or indirect pathways. However, for more sophisticated behavioral tasks and larger intracranial implants, rat models are preferred. Furthermore, BAC lines can show variable expression patterns depending upon genomic insertion site. We therefore used CRISPR/Cas9 to generate two novel knock-in rat lines specifically encoding Cre recombinase immediately after the dopamine D1 receptor (Drd1a) or adenosine 2a receptor (Adora2a) loci. Here, we validate these lines using in situ hybridization and viral vector mediated transfection to demonstrate selective, functional Cre expression in the striatal direct and indirect pathways, respectively. We used whole-genome sequencing to confirm the lack of off-target effects and established that both rat lines have normal locomotor activity and learning in simple instrumental and Pavlovian tasks. We expect these new D1-Cre and A2a-Cre rat lines will be widely used to study both normal brain functions and neurological and psychiatric pathophysiology.

Keywords: Cre rat line; adenosine; direct pathway; dopamine; indirect pathway; knockin rat; striatum.


Figures

Figure 1.
Figure 1.
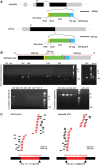
Details of insertion design and founder line screening. A, Schematic of insertion cassettes into Adora2a (above) and Drd1a (below) genes. NLS, nuclear localization sequence; HA, influenza hemagglutinin protein tag YPYDVPDYA; V5, peptide tag GKPIPNPLLGLDST; bGH, bovine growth hormone polyadenylation sequence. B, PCR primer loci (above) and corresponding gels (below) demonstrating G0 screening of the A2a-Cre line. The top row of gels indicate that rats 507, 509, 516, 520, and 527 are transgenic for iCre. The bottom gels show that rats 520 and 527 have iCre inserted correctly at both the 3’ and 5’ junctions. See Table 1 for full primer sequences for screening both lines. pc, single copy detection; nc, unrelated rat tail DNA; H2O, water control; E, empty. C, Reads from whole genome sequencing aligned to a wild-type rat genome demonstrate that, for each transgenic line, the iCre cassette is inserted only once in the genome and at the target loci. Each row corresponds to one paired-end read, where one mate of the pair is aligned to the inserted cassette (red) and the other mate in the genome (black). Sequence reads with at least 100-bp match in the inserted cassette are shown. All such pairs map to only one location in the genome.
Figure 2.
Figure 2.
Confirmation and quantification of iCre production in D1+ and A2a+ MSNs. A, left of each column, Example 40× images of FISH labeling used for quantification, taken from DS (scale bars = 50 μm). Right of each column: closeup images (top) aligned with their corresponding automated software output (bottom). Gray regions indicate DAPI boundaries and colored dots indicate puncta within DAPI boundaries, using the same color scheme as the raw images. Gray dots indicate the locations of puncta detected outside of DAPI boundaries. B, Scatterplots of raw puncta counts for each cell show selective iCre mRNA co-localization with the target receptor mRNA. Black, dark red, and red lines indicate the 50th (i.e., median), 95th, and 99.9th confidence limits, respectively. Subpanels are grouped into rows by region and into columns by genotype. Atlas images depict the locations of confocal images used for mRNA quantification. Barplots show specificity and consistency of on-target and off-target expression, in each rat (n = 3 rats per line).
Figure 3.
Figure 3.
Cre-dependent expression confirms pathway segregation and functional expression A, Functional Cre expression is confined to appropriate BG pathways. Left, CAG-Flex-tdTomato injected into DS of the D1-Cre line expresses in terminals in SNr/GPi. Right, CAG-Flex-tdTomato injected into DS of the A2a-Cre line expresses in terminals in GPe but not SNr/GPi. B, Optogenetic identification of Cre+ cells. Left, hSyn-FLEX-ChrimsonR-TdTomato expression pattern into ventral striatum of a D1-Cre animal. Inset at top right, Closer-up view of transfected neurons. Middle, Examples of a light-responsive neuron in a D1-Cre rat (top; identified dMSN) and an A2a-Cre rat (bottom; identified iMSN). Red bar indicates duration of light pulse, small black bars indicate spike times surrounding each stimulation (rows). Inset, Average session-wide spike wave form (black) with average light-evoked wave form overlaid in red. Scale bars = 0.1 mV, 1 ms. Right, Wave form feature plot demonstrates that light-responsive dMSNs (red) are intermingled within the large cluster of presumed MSNs (black). Other, unclassified cells (mostly GABAergic interneurons) are shown in gray. Inset includes average spike waveforms from three examples each of light-responsive and non-responsive cells within the MSNs cluster. Scale bars = 0.1 mV, 1 ms.
Figure 4.
Figure 4.
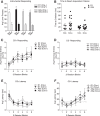
Instrumental and Pavlovian discrimination are similar between transgenic lines and Cre– littermate controls. A, The average total number of responses on the active and inactive lever did not differ between groups and all groups preferentially responded on the active lever; *p < 0.05 active versus inactive responses. B, The total time to reach the acquisition criterion does not differ between groups. C, The average rate of food cup entries during the first 10 s of CS+ presentations increases across two-session training blocks and is similar between groups. D, The average rate of food cup entries during the first 10 s of CS– presentations is low, does not change across training blocks and is similar between groups. E, The average latency to approach the food cup following CS+ onset gets faster across training and is similar between groups. F, The average latency to approach the food cup following CS– becomes slower across training and is similar between groups. Note the scale difference between panels E, F; the dotted line in panel F indicates 15 s on the y-axis to facilitate comparison. All data represented as mean ± SEM.
Figure 5.
Figure 5.
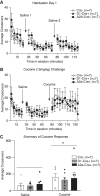
Basal and cocaine induced locomotor activity is similar between transgenic lines and Cre– littermate controls. A, Locomotor activity decreases similarly in all groups across habituation and repeated saline injection. B, Acute cocaine injection results in an increase in locomotor activity that is similar across groups. C, Summary of locomotor activity in response to saline versus cocaine. Cocaine significantly increases locomotor activity compared to saline, and the magnitude of this response is similar across groups; *p < 0.005 locomotor activity in response to cocaine versus saline. All data represented as mean ± SEM.

References

    1. Alcantara AA, Chen V, Herring BE, Mendenhall JM, Berlanga ML (2003) Localization of dopamine D2 receptors on cholinergic interneurons of the dorsal striatum and nucleus accumbens of the rat. Brain Res 986:22–29. 10.1016/s0006-8993(03)03165-2 - DOI - PubMed
    1. Barbera G, Liang B, Zhang L, Gerfen CR, Culurciello E, Chen R, Li Y, Lin DT (2016) Spatially compact neural clusters in the dorsal striatum encode locomotion relevant information. Neuron 92:202–213. 10.1016/j.neuron.2016.08.037 - DOI - PMC - PubMed
    1. Becker JB, Koob GF (2016) Sex differences in animal models: focus on addiction. Pharmacol Rev 68:242–263. 10.1124/pr.115.011163 - DOI - PMC - PubMed
    1. Berke JD (2008) Uncoordinated firing rate changes of striatal fast-spiking interneurons during behavioral task performance. J Neurosci 28:10075–10080. 10.1523/JNEUROSCI.2192-08.2008 - DOI - PMC - PubMed
    1. Berke JD (2018) What does dopamine mean? Nat Neurosci 21:787–793. 10.1038/s41593-018-0152-y - DOI - PMC - PubMed

Publication types