. 2019 Oct 1;203(7):1820-1829.
doi: 10.4049/jimmunol.1800419. Epub 2019 Aug 26.

Distinct Tissue-Specific Roles for the Disease-Associated Autophagy Genes ATG16L2 and ATG16L1

Affiliations

Distinct Tissue-Specific Roles for the Disease-Associated Autophagy Genes ATG16L2 and ATG16L1

Bernard Khor et al. J Immunol. .

Abstract

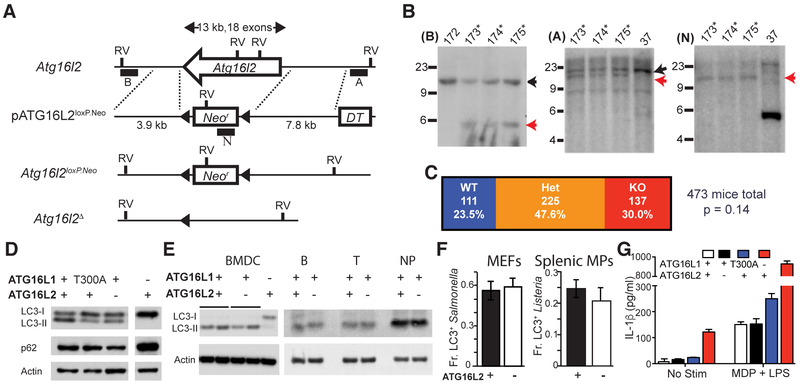
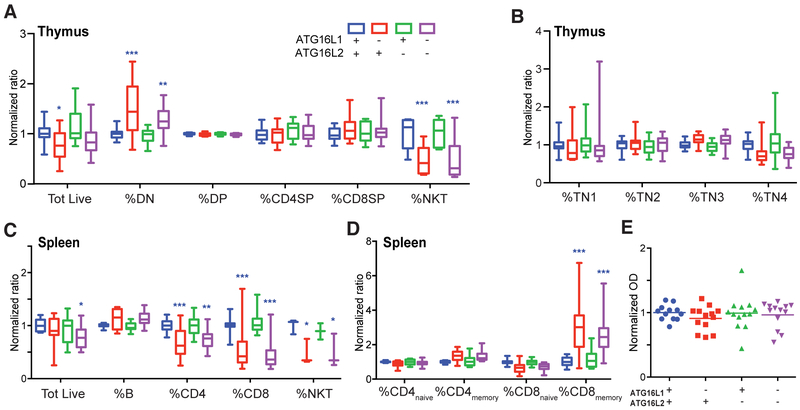
The clear role of autophagy in human inflammatory diseases such as Crohn disease was first identified by genome-wide association studies and subsequently dissected in multiple mechanistic studies. ATG16L1 has been particularly well studied in knockout and hypomorph settings as well as models recapitulating the Crohn disease-associated T300A polymorphism. Interestingly, ATG16L1 has a single homolog, ATG16L2, which is independently implicated in diseases, including Crohn disease and systemic lupus erythematosus. However, the contribution of ATG16L2 to canonical autophagy pathways and other cellular functions is poorly understood. To better understand its role, we generated and analyzed the first, to our knowledge, ATG16L2 knockout mouse. Our results show that ATG16L1 and ATG16L2 contribute very distinctly to autophagy and cellular ontogeny in myeloid, lymphoid, and epithelial lineages. Dysregulation of any of these lineages could contribute to complex diseases like Crohn disease and systemic lupus erythematosus, highlighting the value of examining cell-specific effects. We also identify a novel genetic interaction between ATG16L2 and epithelial ATG16L1. These findings are discussed in the context of how these genes may contribute distinctly to human disease.


Conflict of interest statement

Disclosures: The authors declare that they have no conflict of interest.

Figures

Fig. 1.
Fig. 1.. Role of ATG16L1 and ATG16L2 in canonical autophagy functions.
(A) Schematic of targeting strategy, not drawn to scale, indicating the Atg16l2 exons in a single open arrow, the genes for neomycin resistance (Neor) and diphtheria toxin sensitivity (DT), loxP sites (filled triangles), EcoRV sites (RV) and probes for Southern analyses (filled boxes). (B) Southern blot analyses of selected ES clones with indicated probes in parentheses. Molecular weights indicated to the left of each blot, as well as expected band sizes for the wildtype and targeted alleles (black and red arrows respectively). Asterisks denote clones with appropriate patterns, 172 shows an untargeted clone, 37 shows a non-homologous integration. C. Summary of genotypes from 473 pups born to Atg16l2+ × Atg16l2+ mating pairs indicating numbers and percentages of offspring with 0, 1 and 2 Atg16l2+ alleles (WT, Het and KO respectively). Chi-squared test p value, compared to a 1:2:1 Mendelian ratio, is shown. (D) Western blot analyses of LC3 isoforms and p62 accumulation in MEFs with perturbed ATG16L1 (T300A or deficient) or ATG16L2. Representative of 3 independent experiments. (E) Western blot analyses of LC3 isoforms in bone marrow-derived dendritic cells (BMDCs) and primary B cells, T cells and neutrophils (NP). Representative of 2 independent experiments. (F) Antibacterial autophagy in either ATG16-sufficient or -deficient MEFs and primary splenic macrophages (MPs). (Data shown as mean ± SD, n = 75 cells per condition from 3 biologic replicates, representative of 3 independent experiments) (G) IL-1β production in primary splenic macrophages in response to stimulation with MDP and LPS. (Data shown as mean ± SD, representative of 3 independent experiments)
Fig. 2.
Fig. 2.. Effect of ATG16L2 loss on development and function of hematopoietic subsets.
(A) Data obtained from the GTex Portal (https://gtexportal.org/home/) showing normalized expression of Atg16l1 and Atg16l2 (green and red, respectively; overlap in yellow) across different tissues. Blood and spleen are indicated, tissues where expression of Atg16l2 appears disproportionately higher. (B) Hematopoietic parameters in ATG16L2-deficient mice. RBC, red blood cell count; Hct, hematocrit; MCV, mean corpuscular volume; RDW, red cell distribution width; Hb, hemoglobin. Data shown as min-max box-and-whiskers plots. (9 gender- and age-matched mice/cohort, min-max plot, representative of 3 independent experiments) (C) Leukocyte parameters in ATG16L2-deficient mice. Data shown as mean ± SD, 3 mice per group, representative of 3 independent experiments. (D) Immune cell subsets in major lymphoid compartments. Perit, peritoneum; DN, CD4CD8 double negative; DP, CD4+CD8+ double positive; SP, CD4+/CD8+ single positive. Data shown as mean ± SD, 3 littermates per group, representative of 3 independent experiments. (E) Mixed bone marrow chimeras of wildtype CD45.1+CD45.2+ stem cells with either ATG16L2-sufficient or -deficient CD45.2+ stem cells into immune-sufficient CD45.1+ hosts. Black and red lines show normalized contribution from wildtype and ATG16L2-deficient CD45.2+ cells respectively. BM, bone marrow; Periph, periphery; Sp, spleen; MZ, marginal zone; FO, follicular B cells; PC, plasma cells; LN, lymph node; Thy, thymus; n, naïve; m, memory. Data shown as mean ± SD of 3 independent experiments, 4 recipients per group per experiment. (F) Proliferation of ATG16L2−/− (KO) T cells in response to anti-CD3/CD28 stimulation. (F-H Data shown as mean ± SD, technical triplicates, representative of 3 independent experiments) (G) IL-2 production be ATG16L2−/− (KO) T cells in response to anti-CD3/CD28 stimulation. (H) Ability of ATG16L2−/− (KO) T cells to differentiate into pro- and anti-inflammatory subsets. (I) Ability of ATG16L2−/− (KO) mice to mount an antigen-specific T-independent antibody response. Data shown as mean ± SD, 3 mice per group, representative of 3 independent experiments. All differences non-significant unless otherwise indicated; **, q<0.01; t-test (E, F, H) with Benjamini, Krieger and Yekutieli correction (A-D, G).
Fig. 3.
Fig. 3.. Impact of ATG16L1 and/or ATG16L2 loss on T cell development and function.
(A) and (B) Thymic development in mice deficient in ATG16L1 and/or ATG16L2. Earliest CD4-CD8-CD3- triple negative (TN) subsets are displayed separately for clarity. (C) and (D) Splenic lymphoid populations in mice deficient in ATG16L1 and/or ATG16L2. Naïve and memory subsets are displayed separately for clarity. (A-D) Data shown as min-max box-and-whiskers plots of 5 independent experiments, 3 age- and gender-matched mice per group per experiment. (E) Effect of loss of ATG16L1 (in T cells) and/or ATG16L2 on ability to mount an antigen-specific T-dependent antibody response. All differences non-significant unless otherwise indicated; *, p<0.05; **, p<0.01; ***, p<0.005; 2-way ANOVA with Dunnett correction, comparisons against wildtype (blue).
Fig. 4.
Fig. 4.. Impact of ATG16L1 and/or ATG16L2 loss on epithelial barrier biology and function.
(A) Effect of loss of ATG16L1 (in epithelial cells) and/or ATG16L2 on response to oral infection with Citrobacter rodentium. Data shown as mean ± SD, 4 mice per group, 2 independent experiments, 2-way ANOVA with Tukey correction. (B) Cytokine response in mice deficient in ATG16L1 and/or ATG16L2 after infection with Citrobacter rodentium. Data shown as min-max box-and-whiskers plots of 2 independent experiments, technical triplicates, 2 mice each, 2-way ANOVA with Tukey correction. (A-B) All differences non-significant unless otherwise indicated; *, p<0.05; **, p<0.01; ***, p<0.005. Significant differences from wildtype, ATG16L1-deficient and ATG16L2-deficient mice in blue, red and green respectively. (C) Single-cell RNAseq of epithelial cells from mice deficient in ATG16L1 and/or ATG16L2. Displayed is tSNE analysis of all cells in aggregate, overlaid with genetic identity (left), cellular identity (middle) and Lyz1 expression to highlight Paneth cells (right). (D) Comparison of cell populations between genotypes. *, p<0.05, hypergeometric test. (E-F) Histological quantitation of Paneth cells (E) and TUNEL+ cells (F) in intestinal sections from ATG16L2-deficient mice, Mann-Whitney p-values.

References

    1. Mizushima N, and Komatsu M. 2011. Autophagy: renovation of cells and tissues. Cell 147: 728–741. - PubMed
    1. Levine B, Mizushima N, and Virgin HW. 2011. Autophagy in immunity and inflammation. Nature 469: 323–335. - PMC - PubMed
    1. Barrett JC, Hansoul S, Nicolae DL, Cho JH, Duerr RH, Rioux JD, Brant SR, Silverberg MS, Taylor KD, Barmada MM, Bitton A, Dassopoulos T, Datta LW, Green T, Griffiths AM, Kistner EO, Murtha MT, Regueiro MD, Rotter JI, Schumm LP, Steinhart AH, Targan SR, Xavier RJ, NIDDK IBD Genetics Consortium, Libioulle C, Sandor C, Lathrop M, Belaiche J, Dewit O, Gut I, Heath S, Laukens D, Mni M, Rutgeerts P, van Gossum A, Zelenika D, Franchimont D, Hugot J-P, de Vos M, Vermeire S, Louis E, Belgian-French IBD Consortium, Wellcome Trust Case Control Consortium, Cardon LR, Anderson CA, Drummond H, Nimmo E, Ahmad T, Prescott NJ, Onnie CM, Fisher SA, Marchini J, Ghori J, Bumpstead S, Gwilliam R, Tremelling M, Deloukas P, Mansfield J, Jewell D, Satsangi J, Mathew CG, Parkes M, Georges M, and Daly MJ. 2008. Genome-wide association defines more than 30 distinct susceptibility loci for Crohn’s disease. Nature Genetics 40: 955–962. - PMC - PubMed
    1. Khor B, Gardet A, and Xavier RJ. 2011. Genetics and pathogenesis of inflammatory bowel disease. Nature 474: 307–317. - PMC - PubMed
    1. Lassen KG, and Xavier RJ. 2017. Genetic control of autophagy underlies pathogenesis of inflammatory bowel disease. Mucosal immunology 10: 589–597. - PMC - PubMed

Publication types

MeSH terms