. 2019 Aug 26;10(1):3846.
doi: 10.1038/s41467-019-11722-8.

Molecular profiling of tissue biopsies reveals unique signatures associated with streptococcal necrotizing soft tissue infections

Collaborators, Affiliations

Molecular profiling of tissue biopsies reveals unique signatures associated with streptococcal necrotizing soft tissue infections

Robert Thänert et al. Nat Commun. .

Abstract

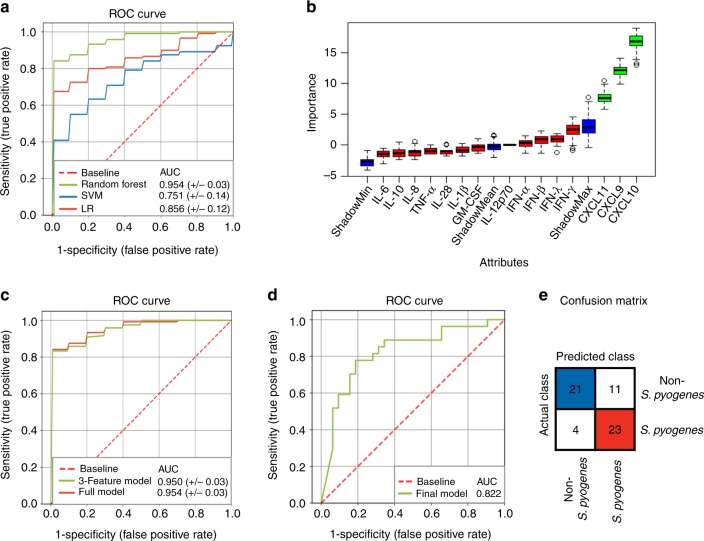
Necrotizing soft tissue infections (NSTIs) are devastating infections caused by either a single pathogen, predominantly Streptococcus pyogenes, or by multiple bacterial species. A better understanding of the pathogenic mechanisms underlying these different NSTI types could facilitate faster diagnostic and more effective therapeutic strategies. Here, we integrate microbial community profiling with host and pathogen(s) transcriptional analysis in patient biopsies to dissect the pathophysiology of streptococcal and polymicrobial NSTIs. We observe that the pathogenicity of polymicrobial communities is mediated by synergistic interactions between community members, fueling a cycle of bacterial colonization and inflammatory tissue destruction. In S. pyogenes NSTIs, expression of specialized virulence factors underlies infection pathophysiology. Furthermore, we identify a strong interferon-related response specific to S. pyogenes NSTIs that could be exploited as a potential diagnostic biomarker. Our study provides insights into the pathophysiology of mono- and polymicrobial NSTIs and highlights the potential of host-derived signatures for microbial diagnosis of NSTIs.


Conflict of interest statement

The authors declare no competing interests.

Figures

Fig. 1
Fig. 1
Single pathogens as well as complex bacterial communities can cause severe NSTIs. a Bacterial composition in tissue biopsies (n = 148) from patients with NSTIs. Bacterial genera with a mean relative abundance of ≥2.5% across all samples or a maximal relative abundance of ≥80% are depicted. The Gini–Simpson diversity index shows genus-level diversity. b Co-occurrence network of the 18 genera with the highest mean relative abundance across all samples. Dark edges illustrate co-occurrence, light edges mutual exclusion (Brown’s p-value ≤0.05). Outer lines represent distinct bacterial clusters (see Supplementary Figure 8). c Bacterial community diversity and structure in NSTI biopsies depicted against the affected body part. The bacterial community diversity is given to the top where each dot represents the Gini–Simpson diversity index from one specimen. Lines represent median values. Diversity indices across the five body parts (n = 14, 18, 12, 23, and 37, respectively from left to right) were compared using the Kruskal–Wallis test with Dunn’s multiple comparison post hoc test with ***p < 0.001; *p < 0.05. The bacterial community structure is indicated to the bottom where bars depict the mean relative abundance of genera at each body site. The color code depicting the different genera is as given in a. For statistical evaluation of the relative abundance of genera at different body sites see Table 2. Source data are provided in Supplementary Data 1, 2, 3, and 4
Fig. 2
Fig. 2
NSTIs can be grouped into distinct infection types based on the associated pathobiome. a Patient classification (n = 148) into different infection types based on their associated bacterial composition using hierarchical agglomerative clustering. Infection type definitions are assigned based on the genus-level distribution of the associated bacterial composition. b Principal Coordinate Analysis (PCoA) of Bray–Curtis dissimilarities between the bacterial composition identified in all tissue biopsies (n = 148), colored by infection type. Source data are provided in Supplementary Data 2 and 3
Fig. 3
Fig. 3
Streptococcus spp. and polymicrobial communities express different functionalities that facilitate nutrient acquisition and sustained inflammation. GO terms (root: biological process) with significantly higher associated gene expression in the transcriptional profile of Streptococcus spp. (red, n = 17) or polymicrobial communities (blue, n = 22) during NSTIs (Benjamini–Hochberg adjusted p-value ≤ 0.05 Kruskal–Wallis test, log2 fold difference ≥ 2) are shown. The heat map depicts summed sample-wise transcript abundance (log2 TPM) of genes associated with each GO term. The dendrogram depicts the GO hierarchy of all visualized GO terms. GO term clusters (labeled below the graph) are based on common parent terms. Nodes are hierarchically arranged to reflect distance to the root and their color indicates the pathobiome with the higher associated average expression. Source data are provided in Supplementary Data 5
Fig. 4
Fig. 4
Different virulence functionalities contribute to the pathogenicity of Streptococcus spp. and polymicrobial communities during NSTIs. a Summed mean expression level (log2 TPM ± s.d.) of genes categorized based on their encoded InterPro (IPR) domains. The relative contribution of documented streptococcal virulence genes to IPR domain expression is depicted on the bars (left). The log2 differences in IPR expression between Streptococcus spp. (red, n = 17) and polymicrobial community (blue, n = 22) mediated NSTIs are depicted in the center. Gray bars mark IPR domains expressed by only one pathobiome and were calculated assuming one pseudo-TPM. b Streptococcal virulence factor expression (TPM) during NSTIs. The expression level is given for virulence-associated genes annotated using the virulence factor database (VFDB). c, d IPR domain expression associated with specific virulence categories. Average total abundances (TPM ± s.d.) (c) and relative expression levels of virulence categories (d) are given. e, f Relative proportion of InterPro domain expression in the functional categories ‘adhesion’ (e) and ‘proteolysis’ (f) associated with terms indicating target specificity (e) or protease class (f). Putative adhesins and unclassified proteases are depicted in gray. ***p < 0.001; **p < 0.01; *p < 0.05, Kruskal–Wallis test with Dunn’s multiple comparison post hoc test (n = 39). g Contribution of the five genera with the highest average abundances in polymicrobial NSTIs to the total pathobiome expression of specific virulence categories. The relative amount of transcripts (TPM) expressed by each genus is plotted against the relative amount of transcripts encoding IPR domains involved in adhesion (top) or proteolysis (bottom). Squared correlation coefficients are depicted. Source data are available as a source data file
Fig. 5
Fig. 5
Functional profiling of infected patient tissue during streptococcal and polymicrobial NSTIs reveals distinct patterns of gene expression. a Network plot of gene ontology (GO) terms enriched within the genes differentially expressed between human tissue biopsies infected with Streptococcus spp. (red, n = 17) or the polymicrobial community (blue, n = 22) (Benjamini–Hochberg adjusted p-value ≤ 0.05, Wald test). Nodes represent enriched GO terms, grouped into functional clusters. b Average expression level, fold change (upper panel) and inter-individual transcriptional variation (lower panel) of selected genes with significantly higher transcript abundances in human tissue infected by Streptococcus spp. (red) or by a polymicrobial community (blue). Source data are provided in Supplementary Data 5, 7, and 8
Fig. 6
Fig. 6
Plasma levels of interferon-inducible mediators that differ in NSTI patients. The levels of 15 interferon-inducible mediators were measured in the plasma of patients with S. pyogenes (n = 12) or polymicrobial (n = 22) NSTIs, or healthy controls (n = 5) by a multiplex beads array. The levels of those three mediators that differ between patients with polymicrobial and streptococcal NSTIs are shown whereas those of the 12 other mediators are given in Supplementary Figure 12. The mean value (±s.d.) is indicated by a horizontal line. Statistical significance was evaluated using ordinary one-way ANOVA with *p-value < 0.05; **p-value < 0.01; ***p-value < 0.001. Source data are available as a source data file
Fig. 7
Fig. 7
Identification of potential plasma biomarkers for microbial diagnosis of NSTIs. a ROC curves for the model comparison of Random Forest (RF, green), linear support vector machine (SVM, blue) and logistic regression (LR, red) on the training cohort (n = 12 S. pyogenes NSTIs, n = 22 non-S. pyogenes NSTIs) using the full panel of available measured variables. AUC values ± 95% CI are given. b Selection of relevant plasma markers for discrimination between S. pyogenes and non-S. pyogenes NSTIs in the training cohort using the Boruta algorithm. Boxplots of features are sorted by increasing importance according to the Z-scores. Features colored in green are those which were classified as relevant (exhibiting Z-scores higher than shadowMax). Features colored in red are unimportant for model performance. The blue boxes correspond to minimal (shadowMin), mean (shadowMean) and maximal (shadowMax) importance calculated from randomly permuted features. c ROC curves for a RF classifier trained on the full panel of features (red) and a 3-feature model trained solely on CXCL9, CXCL 10, and CXCL 11 (green) of the training dataset. AUC values ± 95% CI are given. d ROC curve showing the 3-feature RF classifier performance in the independent validation cohort (n = 27 S. pyogenes NSTIs, n = 32 non-S. pyogenes NSTIs). e Confusion matrix summarizing the performance of the 3-feature model in the independent validation cohort. Each row of the confusion matrix shows the number of samples in an actual class while each column shows the number of samples in a predicted class. Tiles showing the number of correctly classified cases are colored blue (non-S. pyogenes) or red (S. pyogenes). Source data are available as a source data file

References

    1. Stevens DL, Bryant AE. Necrotizing soft-tissue infections. N. Eng. J. Med. 2017;377:2253–2265. doi: 10.1056/NEJMra1600673. - DOI - PubMed
    1. Anaya DA, Dellinger EP. Necrotizing soft-tissue infection: diagnosis and management. Clin. Infect. Dis. 2007;44:705–710. doi: 10.1086/511638. - DOI - PubMed
    1. Boyer A, et al. Influence of surgical treatment timing on mortality from necrotizing soft tissue infections requiring intensive care management. Intensive Care Med. 2009;35:847–853. doi: 10.1007/s00134-008-1373-4. - DOI - PubMed
    1. Misiakos EP, et al. Current concepts in the management of necrotizing fasciitis. Front. Surg. 2014;1:36. doi: 10.3389/fsurg.2014.00036. - DOI - PMC - PubMed
    1. Bruun T, et al. Necrotizing soft tissue infections caused by Streptococcus pyogenes and Streptococcus dysgalactiae subsp. equisimilis of groups C and G in western Norway. Clin. Microbiol. Infect. 2013;19:E545–E550. doi: 10.1111/1469-0691.12276. - DOI - PubMed

Publication types

MeSH terms