. 2019 Aug 27:8:e49324.
doi: 10.7554/eLife.49324.

Mapping person-to-person variation in viral mutations that escape polyclonal serum targeting influenza hemagglutinin

Affiliations

Mapping person-to-person variation in viral mutations that escape polyclonal serum targeting influenza hemagglutinin

Juhye M Lee et al. Elife. .

Abstract

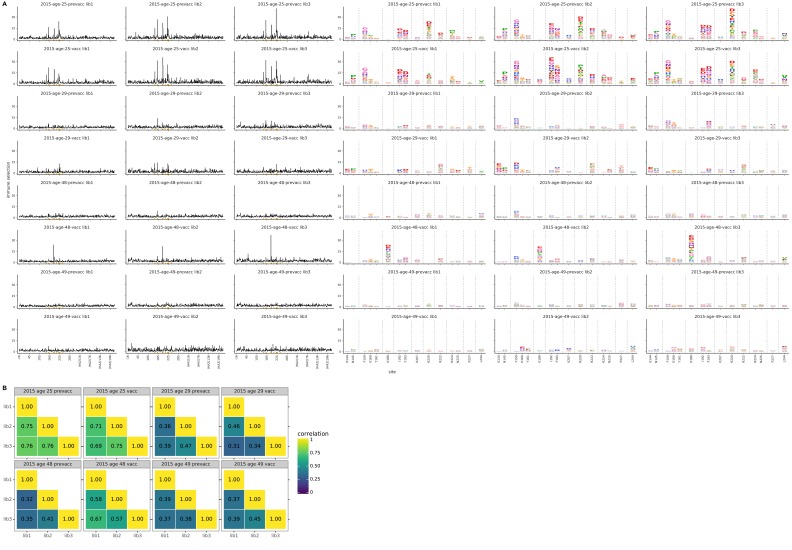
A longstanding question is how influenza virus evolves to escape human immunity, which is polyclonal and can target many distinct epitopes. Here, we map how all amino-acid mutations to influenza's major surface protein affect viral neutralization by polyclonal human sera. The serum of some individuals is so focused that it selects single mutations that reduce viral neutralization by over an order of magnitude. However, different viral mutations escape the sera of different individuals. This individual-to-individual variation in viral escape mutations is not present among ferrets that have been infected just once with a defined viral strain. Our results show how different single mutations help influenza virus escape the immunity of different members of the human population, a phenomenon that could shape viral evolution and disease susceptibility.

Keywords: antigenic drift; deep mutational scanning; evolutionary biology; hemagglutinin; human; infectious disease; influenza virus; microbiology; mutational antigenic profiling; virus.


Conflict of interest statement

JL, RE, SZ, SC, PW, TB, TS, MB, AH, SL, SH, JB No competing interests declared

Figures

Figure 1.
Figure 1.. Mutational antigenic profiling quantifies the antigenic effect of all amino-acid mutations to HA.
We generate libraries of mutant viruses carrying all mutations to HA compatible with viral growth. We incubate the libraries with antibodies or serum, and infect cells with non-neutralized virus. Viral RNA from infected cells is deep sequenced to measure the frequency of each mutation. We quantify immune selection on each mutation as its log enrichment relative to wildtype in the immune-selected sample versus a mock-selection control. Data are displayed in logo plots, with larger letters indicating stronger immune selection for a mutation.
Figure 2.
Figure 2.. Mutational antigenic profiling of monoclonal antibodies targeting HA.
(A) Maps of immune selection from two antibodies targeting near the receptor binding pocket. Line plots show the total immune selection at each site, and logo plots show mutations at strongly selected sites (indicated by red marks at the bottom of the line plots). (B) Neutralization assays validate that mutations mapped to be under strong immune selection indeed have large effects on neutralization. For each antibody, we validated the mutation under strongest selection (F159G for 5A01 and F139D for 4C01), as well as K160T since it was selected by 5A01 but not 4C01. (C) Maps of immune selection for two antibodies targeting lower on the HA head and (D) corresponding neutralization curves for the most strongly selected escape mutation for each antibody (N121E for 4F03 and K82A for 1C04). (E) Immune selection mapped onto HA’s structure for the antibodies targeting near the receptor binding pocket or (F) lower on the HA head. The color scale is calibrated separately for each structure. For interactive versions of the structures, click https://mybinder.org/v2/gh/jbloomlab/map_flu_serum_Perth2009_H3_HA/master?urlpath=%2Fapps%2Fresults%2Fnotebooks%2Fmap_on_struct_antibody_region_B.ipynb and https://mybinder.org/v2/gh/jbloomlab/map_flu_serum_Perth2009_H3_HA/master?urlpath=%2Fapps%2Fresults%2Fnotebooks%2Fmap_on_struct_antibody_lower_head.ipynb.
Figure 2—figure supplement 1.
Figure 2—figure supplement 1.. Percent of viral library retaining infectivity after antibody treatment during mutational antigenic profiling.
The percent of the mutant virus library that remained infectious after incubation with antibody was determined using qPCR for each replicate of the mutational antigenic profiling. Higher antibody concentrations generally lead to larger values of the immune selection measured in the mutational antigenic profiling.
Figure 2—figure supplement 2.
Figure 2—figure supplement 2.. Biological replicates of the mutational antigenic profiling are well correlated.
For each antibody, we performed two or three biological replicates of the mutational antigenic profiling. Each replicate used a fully independently generated mutant library. (A) Maps of mutations selected by each antibody with each replicate viral mutant library (‘lib1’, ‘lib2’, or ‘lib3’). These plots are replicate-to-replicate breakdowns of those in Figure 2A,C except that the logo plots are colored by the physicochemical properties of amino acids rather than using the color scheme in the main figure. Note that Figure 2A,C displays the median of the replicates shown here. (B) The Pearson correlation coefficients of the total immune selection at each site (height of the letter stack) computed over all sites for each pair of replicates. (C), (D) are like (A) and (B) but for the antibodies targeting lower on the HA head.
Figure 3.
Figure 3.. Mutational antigenic profiling of four human serum samples.
Plot titles indicate the year the serum was collected and the age of the individual at that time. (A) Line plots show the total immune selection at each site, and logo plots show mutations at strongly selected sites. (B) Neutralization assays validate that mutations mapped to be under strong immune selection indeed have large antigenic effects. The dashed vertical lines show the serum concentrations used in the mutational antigenic profiling. We validated five amino-acid mutants against all four sera, choosing mutations for the following reasons: F193D is the most strongly selected mutation for the 21- and 65-year-old, L157D is the most selected for the 53-year-old, F159G is the most selected for the 64-year-old, K160T is modestly selected by all sera, and K189D is strongly selected by ferret sera (see below). The ‘syn’ mutant is a control with a synonymous mutation does not change the protein sequence and so should not affect antigenicity. (C) Immune selection mapped onto HA’s structure for each sera. The color scale is calibrated separately for each structure. For interactive versions of the structures, click https://mybinder.org/v2/gh/jbloomlab/map_flu_serum_Perth2009_H3_HA/master?urlpath=%2Fapps%2Fresults%2Fnotebooks%2Fmap_on_struct_VIDD_sera.ipynb. Site 189 is shown in the logo plots despite not being a strongly selected site because it is important for ferret sera (see below).
Figure 3—figure supplement 1.
Figure 3—figure supplement 1.. Percent of viral library retaining infectivity after serum treatment during mutational antigenic profiling.
The percent of the mutant virus library that remained infectious after incubation with serum was determined using qPCR for each replicate of the mutational antigenic profiling. Higher serum concentrations generally lead to larger values of the immune selection measured in the mutational antigenic profiling.
Figure 3—figure supplement 2.
Figure 3—figure supplement 2.. Biological replicates of the mutational antigenic profiling are well correlated.
For each serum, we performed three biological replicates of the mutational antigenic profiling. Each replicate used a fully independently generated mutant library. (A) Maps of mutations selected by each serum with each replicate viral mutant library (‘lib1’, ‘lib2’, or ‘lib3’). These plots are replicate-to-replicate breakdowns of those in Figure 3A,B except that the logo plots are colored by the physicochemical properties of amino acids rather than using the color scheme in the main figure. Note that Figure 3A displays the median of the replicates shown here. Site 189 is not shown in the logo plots here since it is not a strongly selected mutation for any of the human serum samples in this figure, and is shown in the main Figure 3B simply for comparative purposes with the ferret sera. The serum sample labeled ‘2009 age 53 plus 2 months’ is that described in Figure 4. (B) The Pearson correlation coefficients of the total immune selection at each site (height of the letter stack) computed over all sites for each pair of replicates.
Figure 4.
Figure 4.. The maps of immune selection are stable over short time periods in the absence of vaccination or infection.
This figure re-displays the (A) map of immune selection and (B) neutralization curves from Figure 3 for the serum from the 53-year-old individual alongside comparable data generated using another serum sample from the same individual collected 2 months later. The dashed vertical lines on the neutralization curves show the serum concentrations used in the mutational antigenic profiling. The mutations chosen for validation by neutralization curves are the ones that the neutralization curves in Figure 3B found had an effect for sera from this individual.
Figure 4—figure supplement 1.
Figure 4—figure supplement 1.. Percent of viral library retaining infectivity after serum treatment during mutational antigenic profiling.
The percent of the mutant virus library that remained infectious after incubation with serum was determined using qPCR for each replicate of the mutational antigenic profiling. Higher serum concentrations generally lead to larger values of the immune selection measured in the mutational antigenic profiling.
Figure 4—figure supplement 2.
Figure 4—figure supplement 2.. Biological replicates of the mutational antigenic profiling are well correlated.
For each serum, we performed three biological replicates of the mutational antigenic profiling. Each replicate used a fully independently generated mutant library. Shown are the Pearson correlation coefficients of the total immune selection at each site (positive site differential selection) computed over all sites for each pair of replicates. The full replicate-by-replicate maps are in Figure 3—figure supplement 2A.
Figure 5.
Figure 5.. Mutational antigenic profiling of sera from four humans pre- and post-vaccination.
Plot titles indicate the year the serum was collected, the age of the individual at that time, and the vaccination status. (A) Line plots show total immune selection at each site, and logo plots show mutations at strongly selected sites. (B) Neutralization assays validate that mutations mapped to be under strong immune selection indeed have large antigenic effects. The dashed vertical lines show the serum concentrations used in the mutational antigenic profiling. Note that not all mutations are tested against all sera. (C) Immune selection mapped onto HA’s structure for sera that selected escape mutants. The color scale is calibrated separately for each structure. For interactive versions of the structures, click https://mybinder.org/v2/gh/jbloomlab/map_flu_serum_Perth2009_H3_HA/master?urlpath=%2Fapps%2Fresults%2Fnotebooks%2Fmap_on_struct_Hensley_sera.ipynb.
Figure 5—figure supplement 1.
Figure 5—figure supplement 1.. Percent of viral library retaining infectivity after serum treatment during mutational antigenic profiling.
The percent of the mutant virus library that remained infectious after incubation with serum was determined using qPCR for each replicate of the mutational antigenic profiling. Higher serum concentrations generally lead to larger values of the immune selection measured in the mutational antigenic profiling. For the pre-vaccination samples from the 48- and 49-year-old individuals, we were unable to achieve a concentration that reduced the infectivity of the viral libraries to <10% because these sera were not very potent (Figure 5B).
Figure 5—figure supplement 2.
Figure 5—figure supplement 2.. Biological replicates of the mutational antigenic profiling are well correlated.
For each serum, we performed three biological replicates of the mutational antigenic profiling. Each replicate used a fully independently generated mutant library. (A) Maps of mutations selected by each serum with each replicate viral mutant library (‘lib1’, ‘lib2’, or ‘lib3’). These plots are replicate-to-replicate breakdowns of those in Figure 5A except that the logo plots are colored by the physicochemical properties of amino acids rather than using the color scheme in the main figure. Note that Figure 5A displays the median of the replicates shown here. (B) The Pearson correlation coefficients of the total immune selection at each site (height of the letter stack) computed over all sites for each pair of replicates.
Figure 6.
Figure 6.. Mutational antigenic profiling of sera from five ferrets.
Plot titles indicate the lab that performed the infection and if the infecting strain was Victoria/2011 rather than Perth/2009. For ferrets from Pittsburgh, both pre- and post-infection sera were analyzed as indicated in the plot titles. (A) Line plots show total immune selection at each site, and logo plots show mutations at strongly selected sites. (B) Neutralization assays validate that mutations mapped to be under strong immune selection indeed have large antigenic effects. The dashed vertical lines show the serum concentrations used in the mutational antigenic profiling. Note that not all mutations are tested against all sera. (C) Immune selection mapped onto HA’s structure for sera that selected escape mutants. The color scale is calibrated separately for each structure. For interactive versions of the structures, click https://mybinder.org/v2/gh/jbloomlab/map_flu_serum_Perth2009_H3_HA/master?urlpath=%2Fapps%2Fresults%2Fnotebooks%2Fmap_on_struct_ferret.ipynb.
Figure 6—figure supplement 1.
Figure 6—figure supplement 1.. Percent of viral library retaining infectivity after serum treatment during mutational antigenic profiling.
The percent of the mutant virus library that remained infectious after incubation with serum was determined using qPCR for each replicate of the mutational antigenic profiling. Higher serum concentrations generally lead to larger values of the immune selection measured in the mutational antigenic profiling. For the pre-infection samples, we were unable to achieve a concentration that reduced the infectivity of the viral libraries to <10% because these sera do not neutralize the virus (Figure 6B).
Figure 6—figure supplement 2.
Figure 6—figure supplement 2.. Biological replicates of the mutational antigenic profiling are well correlated.
For each serum, we performed three biological replicates of the mutational antigenic profiling. Each replicate used a fully independently generated mutant library. (A) Maps of mutations selected by each serum with each replicate viral mutant library (‘lib1’, ‘lib2’, or ‘lib3’). These plots are replicate-to-replicate breakdowns of those in Figure 6A except that the logo plots are colored by the physicochemical properties of amino acids rather than using the color scheme in the main figure. Note that Figure 6A displays the median of the replicates shown here. (B) The Pearson correlation coefficients of the total immune selection at each site (height of the letter stack) computed over all sites for each pair of replicates. Note that the correlations are low for the pre-infection sera as these sera do not neutralize the virus and so do not consistently select any antigenic mutations.
Figure 7.
Figure 7.. Mutational antigenic profiling of polyclonal human serum spiked with a monoclonal antibody.
The antibody is spiked into the serum at a ‘low’ concentration (antibody alone less potent than serum alone), a ‘mid’ concentration (antibody similarly potent to serum), and a ‘high’ concentration (antibody more potent than serum); see Figure 7—figure supplement 1 for details. (A) Line plots show the total immune selection at each site, and logo plots show mutations at sites that are strongly selected by the serum (orange) or antibody (blue). (B) Neutralization curves for some of the most strongly selected mutations against serum or antibody alone. Note that the antibody is 4F03 from Figure 2, the human serum is that from the 65-year-old in Figure 3, and the antibody-alone and serum-alone panels re-display data from those figures using a different color-scheme and subset of sites in the logo plots.
Figure 7—figure supplement 1.
Figure 7—figure supplement 1.. Percent of viral library retaining infectivity after treatment with each serum+antibody mix.
The percent of the mutant virus library that remained infectious after incubation with serum and/or antibody was determined using qPCR for each replicate of the mutational antigenic profiling. The blue points show the actual percent infectivity for each experiment in Figure 7A that used a mix of serum and antibody. The green points show the actual percent infectivity for the serum-alone selection in Figure 7A; in the serum-antibody mix selections the serum was at the same concentrations that gave these percent infectivities. The orange points show the percent infectivity measured at each antibody concentration used in the serum-antibody mix selections; the antibody concentrations used to generate the antibody-alone selection in Figure 7A are those shown in Figure 2—figure supplement 1. The numerical values reported in the text are the average of the percents across the three replicates.
Figure 7—figure supplement 2.
Figure 7—figure supplement 2.. Biological replicates of the mutational antigenic profiling are well correlated.
For each serum-antibody mix, we performed three biological replicates of the mutational antigenic profiling. Each replicate used a fully independently generated mutant library. (A) Maps of mutations selected by each mix with each replicate viral mutant library (‘lib1’, ‘lib2’, or ‘lib3’). These plots are replicate-to-replicate breakdowns of those in Figure 7A except that the logo plots are colored by the physicochemical properties of amino acids rather than using the color scheme in the main figure. Note that Figure 7A displays the median of the replicates shown here. The replicate plots for the antibody-alone and serum-alone plots in Figure 7A are in Figure 2—figure supplement 2 and Figure 3—figure supplement 2. (B) The Pearson correlation coefficients of the total immune selection at each site (height of the letter stack) computed over all sites for each pair of replicates.
Figure 8.
Figure 8.. Frequencies of amino acids at key sites in human H3N2 influenza HA between 2007 and 2019.
There are 16 sites under strong immune selection in our mutational antigenic profiling with human sera, and this figure shows the nine of these sites for which a new amino acid rose to ≥5% frequency. The numbers at the top of each plot indicate the site number, and the letters indicate the amino acid identity. The figure panels are taken from the Nextstrain real-time pathogen evolution website (Hadfield et al., 2018; Neher and Bedford, 2015).

Similar articles

Cited by

References

    1. Altman MO, Bennink JR, Yewdell JW, Herrin BR. Lamprey VLRB response to influenza virus supports universal rules of immunogenicity and antigenicity. eLife. 2015;4:e07467. doi: 10.7554/eLife.07467. - DOI - PMC - PubMed
    1. Andrews SF, Kaur K, Pauli NT, Huang M, Huang Y, Wilson PC. High preexisting serological antibody levels correlate with diversification of the influenza vaccine response. Journal of Virology. 2015a;89:3308–3317. doi: 10.1128/JVI.02871-14. - DOI - PMC - PubMed
    1. Andrews SF, Huang Y, Kaur K, Popova LI, Ho IY, Pauli NT, Henry Dunand CJ, Taylor WM, Lim S, Huang M, Qu X, Lee JH, Salgado-Ferrer M, Krammer F, Palese P, Wrammert J, Ahmed R, Wilson PC. Immune history profoundly affects broadly protective B cell responses to influenza. Science Translational Medicine. 2015b;7:316ra192. doi: 10.1126/scitranslmed.aad0522. - DOI - PMC - PubMed
    1. Angeletti D, Gibbs JS, Angel M, Kosik I, Hickman HD, Frank GM, Das SR, Wheatley AK, Prabhakaran M, Leggat DJ, McDermott AB, Yewdell JW. Defining B cell immunodominance to viruses. Nature Immunology. 2017;18:456–463. doi: 10.1038/ni.3680. - DOI - PMC - PubMed
    1. Bedford T, Suchard MA, Lemey P, Dudas G, Gregory V, Hay AJ, McCauley JW, Russell CA, Smith DJ, Rambaut A. Integrating influenza antigenic dynamics with molecular evolution. eLife. 2014;3:e01914. doi: 10.7554/eLife.01914. - DOI - PMC - PubMed

Publication types

Substances